FIGURE 1. Type specimen of Homunculus patagonicus, MACN-A 634. Photograph, taken in 1901 by W.B. Scott. The photograph is housed in the collections of the Yale Peabody Museum, New Haven, Connecticut, U.S.A.
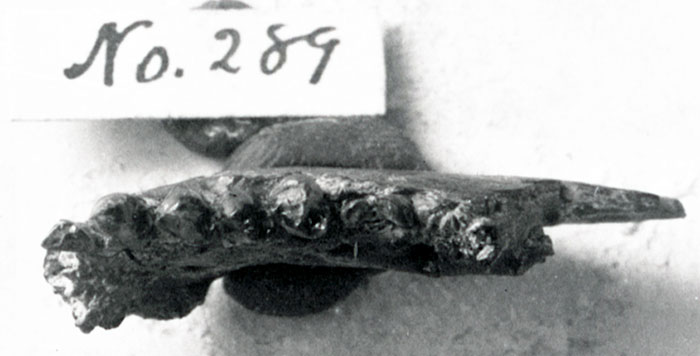
FIGURE 2. Map of southern Patagonia showing principal localities in the text (red stars and text) and in Table1. Exposures of the Santa Cruz Formation are shown in blue. BB, Barrancas Blancas, Río Santa Cruz; ELC, Estancia La Costa; KAN, Killik Aike Norte; PLC, Puesto Estancia La Costa; RBo, Río Bote; RBu, Rincón del Buque; SBB, Segundas Barrancas Blancas, Río Santa Cruz.
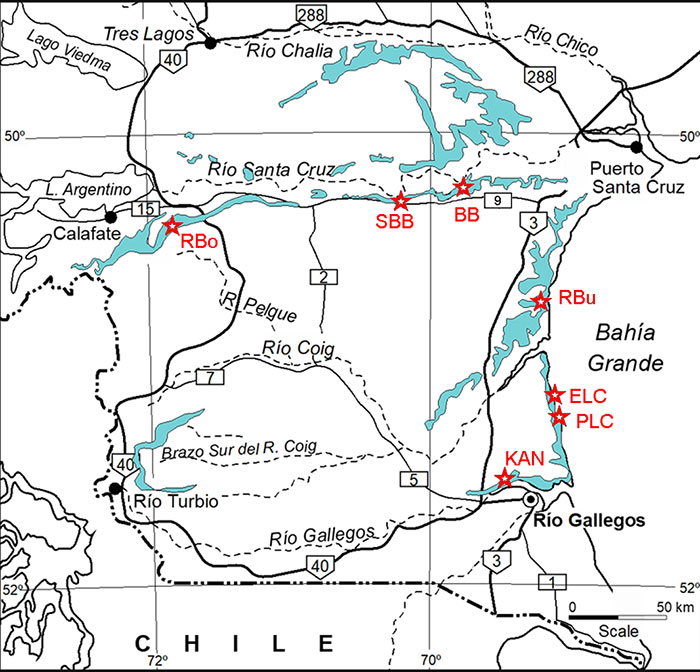
FIGURE 3. Progressive preparation of Homunculus patagonicus MPM-PV 17453 showing exposure of skeletal elements. Cr: cranium, Dent: dentary, Fem: femur, Hum: humerus, L: left, Pelv: pelvic bone, R: right, Sac: sacrum, Scap: scapula. A, B, and C are successive stages of preparation.
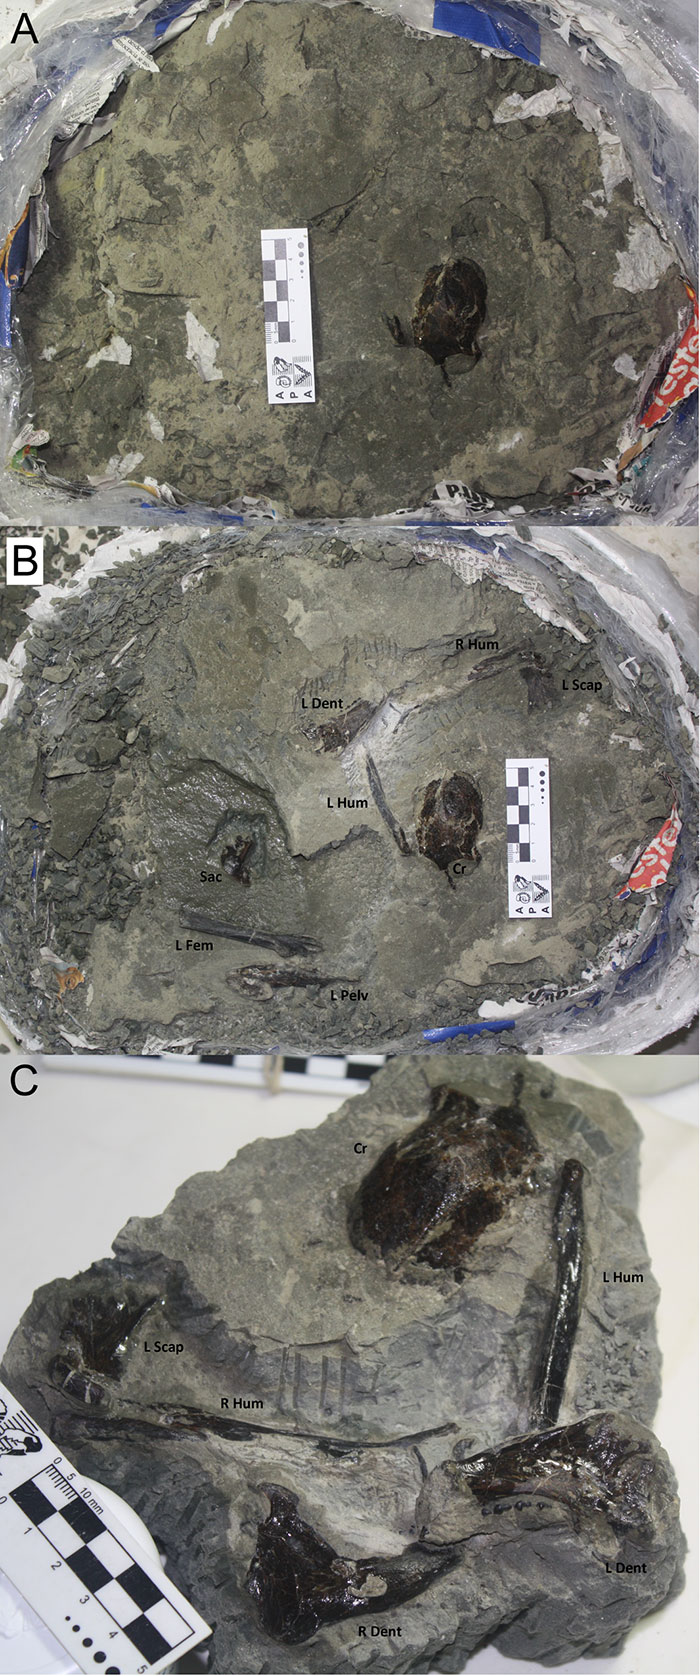
FIGURE 4. Body size estimation of MPM-PV 17453. A: Phylogeny utilized in the PIC analysis (Pampush et al., 2021). B: 3D reconstructions of the right humerus and right femur, both in posterior view. Red lines across the bone models indicate the locations where midshaft cross-sectional area was measured. Black silhouettes represent cortical bone at the cross section and area measurements represent the product of the maximum anteroposterior distance and the maximum mediolateral distance. Directional indications at center apply to the cross sections only, not to the 3D models.
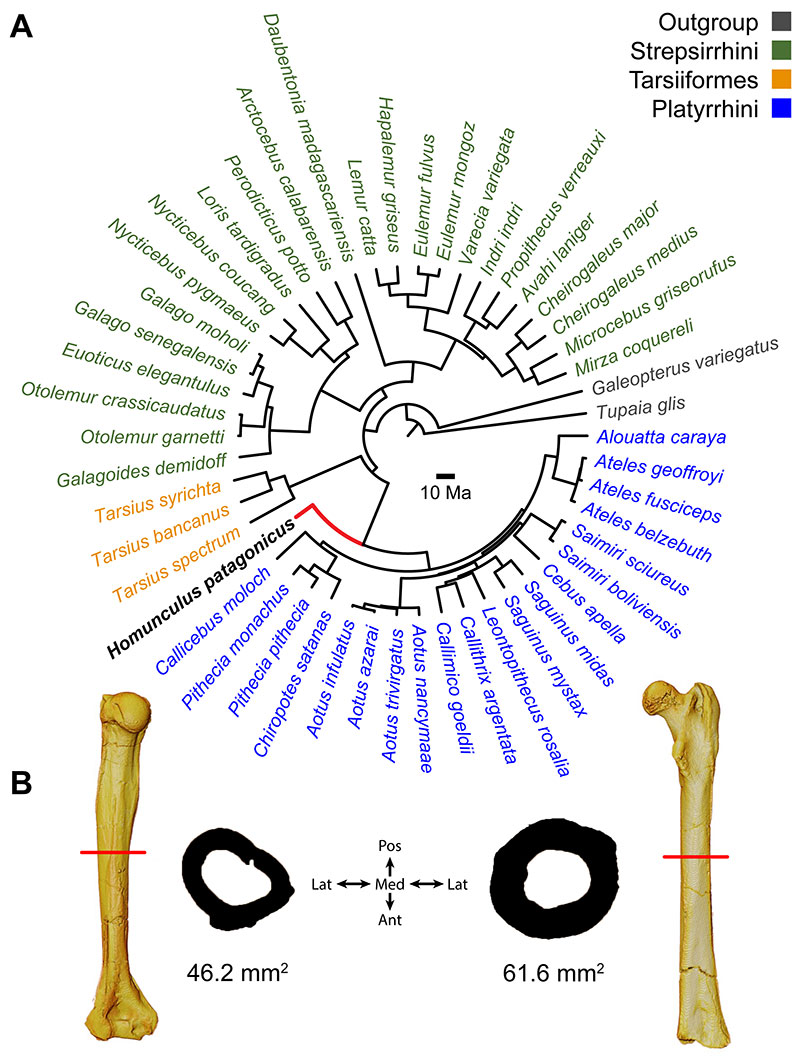
FIGURE 5. Skull of Homunculus patagonicus MPM-PV 17453 in various views. Scale bar equals 1 cm.
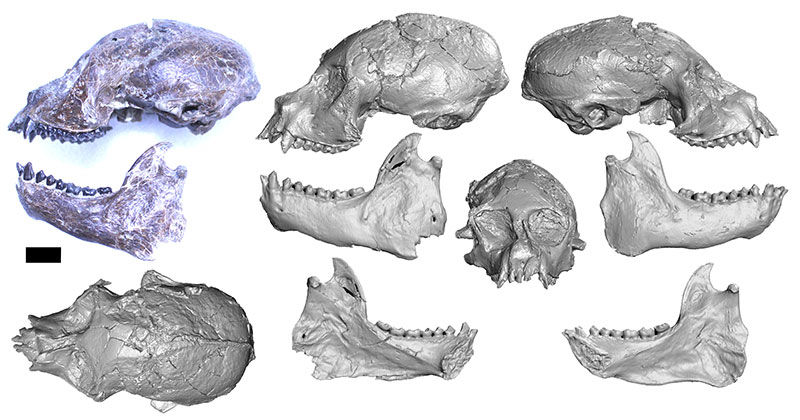
FIGURE 6. Restored skull of Homunculus patagonicus based primarily on MPM-PV 17453.
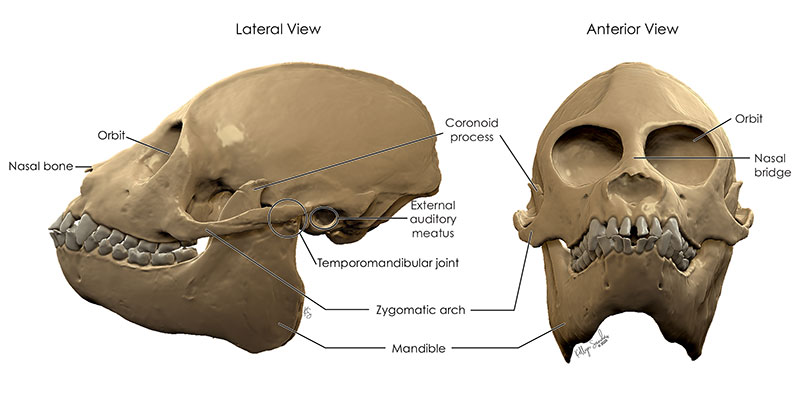
FIGURE 7. Principal components analysis of six dimensions of the face and orbits of Homunculus. Open blue diamonds represent five Homunculus crania. Closed red diamond is MPM-PV 5000, the specimen originally described as the type specimen of Killikaike blakei.
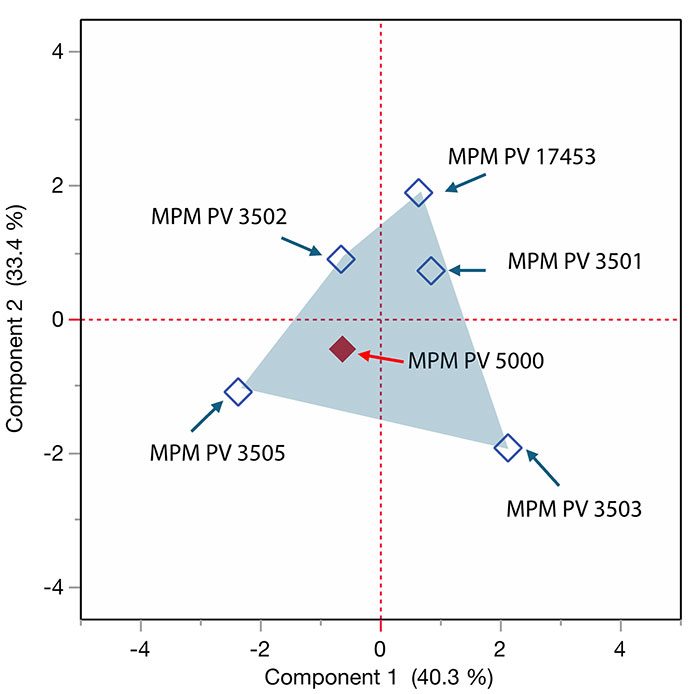
FIGURE 8. Basicranium of Homunculus specimens with an extant platyrrhine comparison. The white scale bar is 2cm long for each. A: MPM-PV 17453, B: MPM-PV 3502, C: extant Plecturocebus.
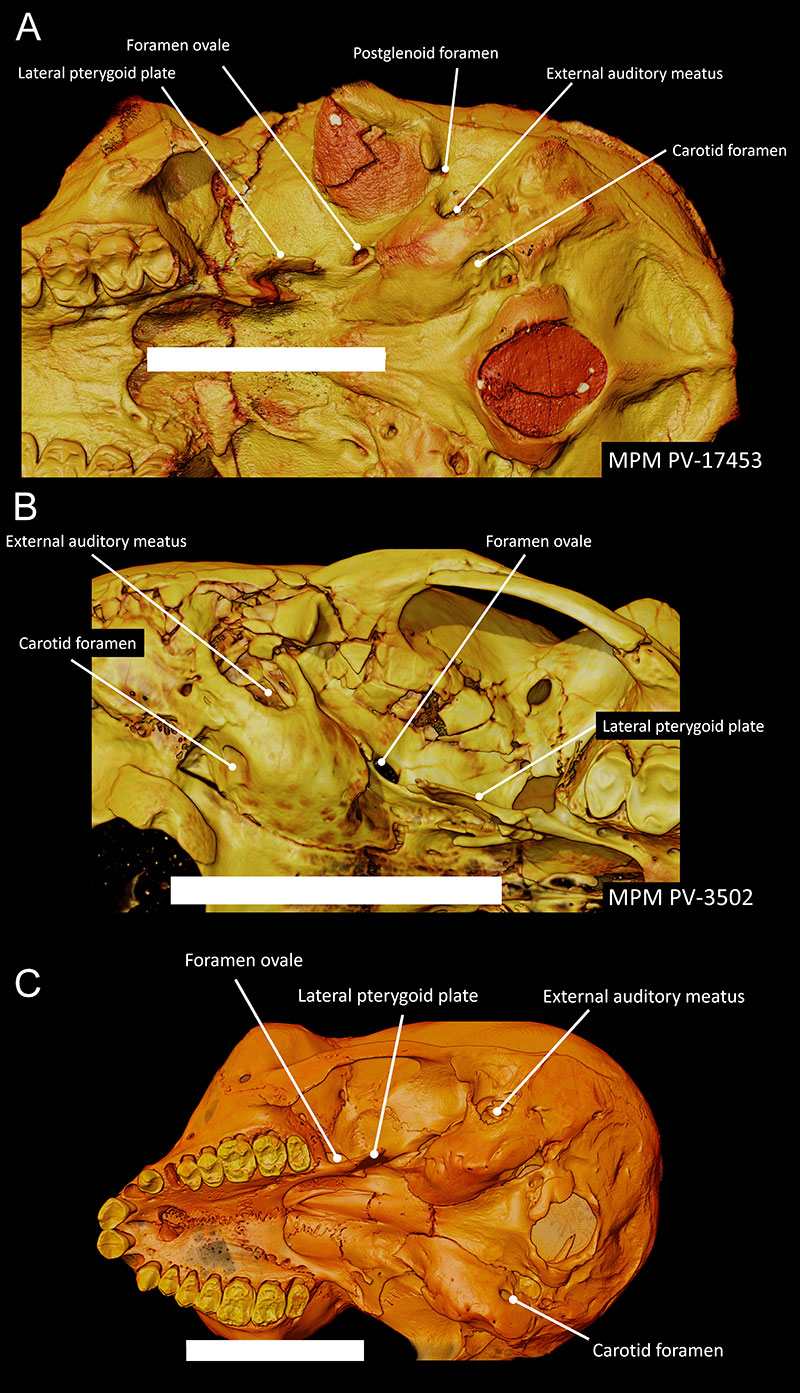
FIGURE 9. Schematic of the right ear region in ventral view. Anterior is toward the top of the image and lateral is toward the left margin. The purple arrow is the connection between the middle ear cavity and the pharynx via the auditory/pharyngotympanic tube. The green arrow is the connection between the middle ear cavity and the anterior accessory chamber. The asterisk labels the bony partition separating the middle ear cavity from the anterior accessory chamber. Redrawn after Cartmill et al. 1981: fig.10B.
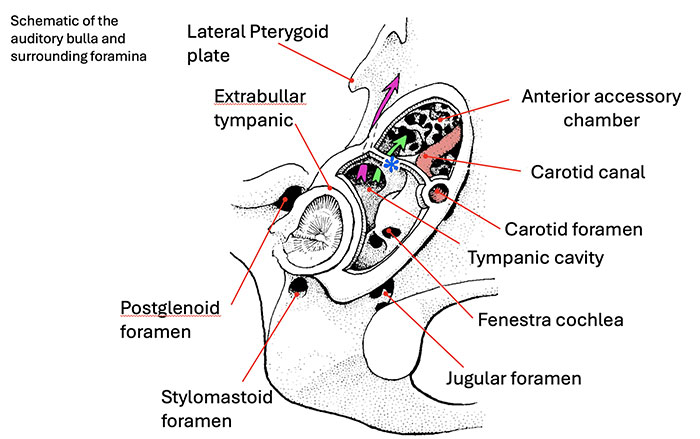
FIGURE 10. Bivariate logistic plots of body mass versus brain size (A) and olfactory bulb size (B) for extant genera of Platyrrhini (blue squares) and Strepsirrhini (red dots) with Homunculus shown as a range depending on the estimated body size.
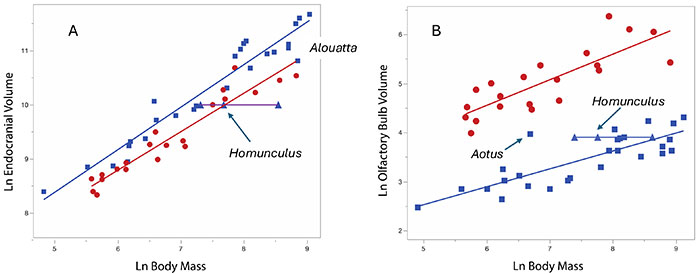
FIGURE 11. Left upper and right lower dentition of Homunculus patagonicus MPM-PV 17453 from high resolution CT stacks at 70 microns. Scale bar equals 1 cm.
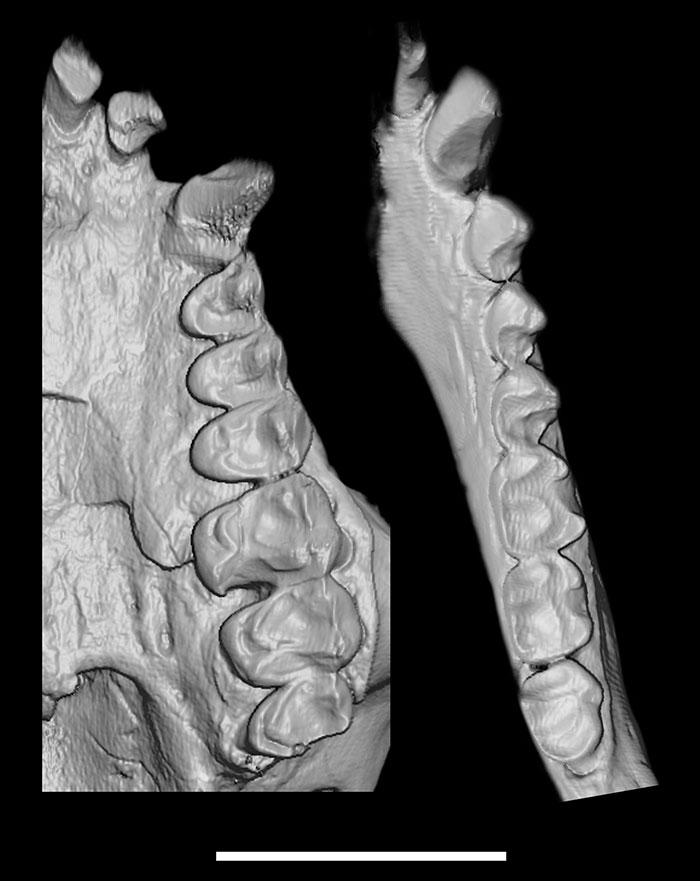
FIGURE 12. Humeri and scapulae of Homunculus patagonicus MPM-PV 17453. Original photos are shown along with the CT surface reconstructions for the more complete humerus and for the scapulae. Scale bar equals 1 cm.
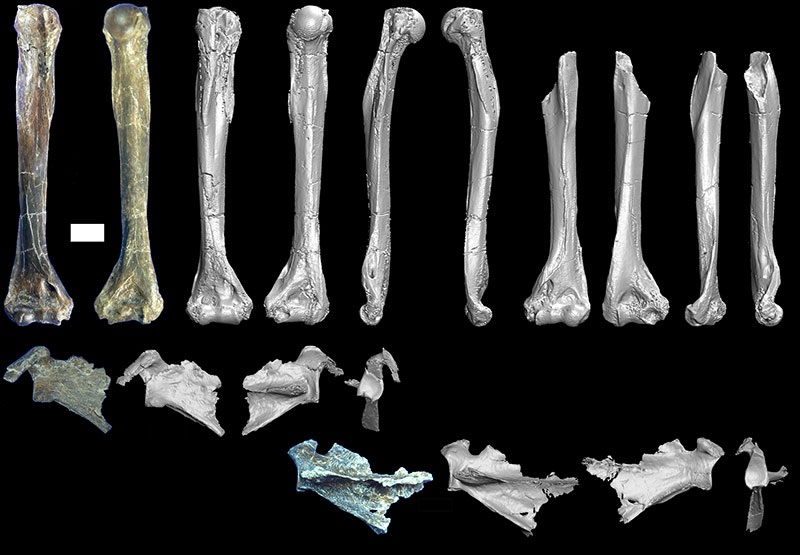
FIGURE 13. Left scapula of Homunculus patagonicus MPM-PV 17453 showing planes in posterior view for angular measurements. The yellow line is the axillary border, the purple line is the spine of the scapula, and the red line is the plane of the glenoid fossa. The axillo-glenoid angle is the obtuse angle at the intersection of the yellow and red lines, the axillo-spinal angle is the acute angle at the intersection of the yellow and purple lines, and the spino-glenoid angle is the obtuse angle at the intersection of the purple and red lines.
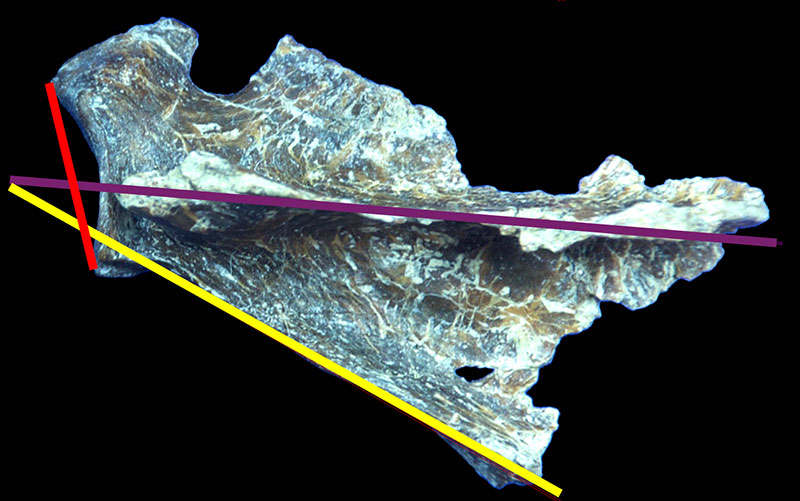
FIGURE 14. Femur, os coxa, and sacrum of Homunculus patagonicus MPM-PV 17453. Original photos are shown along with the CT surface reconstructions for the os coxa and sacrum. Scale bar equals 1 cm.
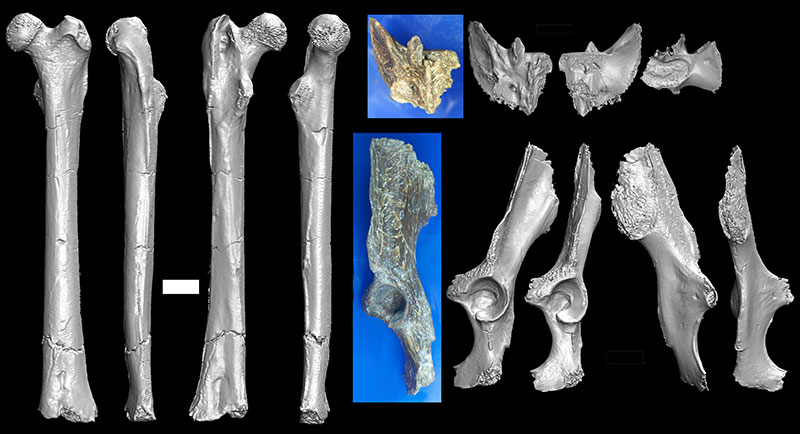
FIGURE 15. Reconstruction of chewing muscles of Homunculus.
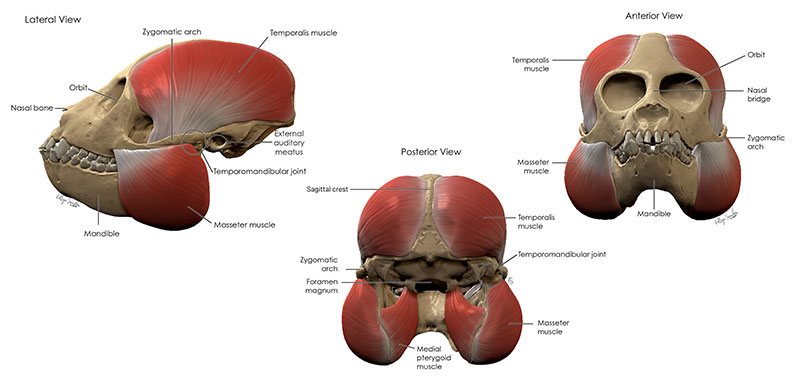
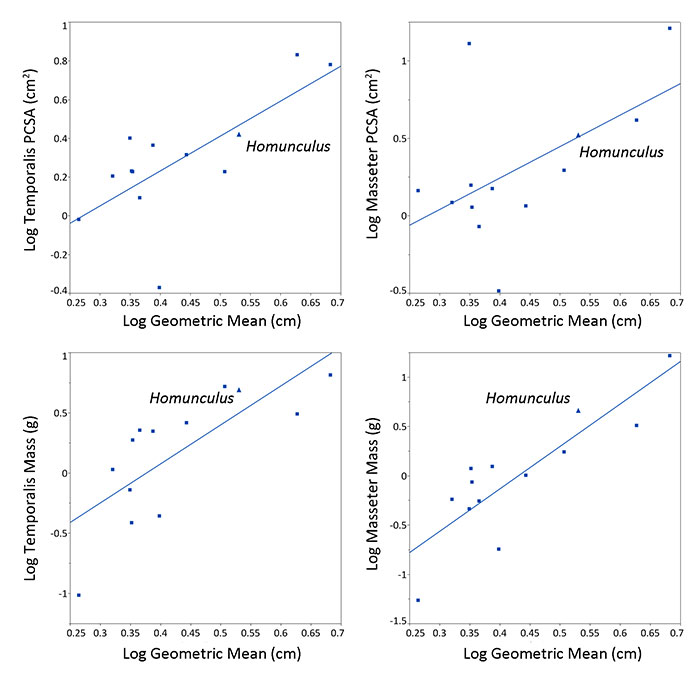
FIGURE 16. Least squares plots of temporalis and masseter PCSA and mass against a geometric mean of nine skull measurements. For measurements, see Table 8. The datum for Homunculus is shown by a cross. See text for details.