FIGURE 1. Map of the Western Interior of North America showing the approximate locations of localities discussed in the text. 1-2, upper Paleocene localities in the Paskapoo Formation: 1, Joffre Bridge locality, Alberta, Canada; 2, Paskapoo Formation, Calgary locality, Alberta, Canada. 3-6, upper Maastrichtian localities: 3, Scollard Formation, KUA-2 locality, Alberta, Canada; 4, Hell Creek Formation, localities in Garfield and McCone Counties, Montana, USA; 5: Lance Formation, Bushy Tailed Blowout locality, Wyoming, USA. 6, lower Eocene Wasatch Formation, Bitter Creek locality, Wyoming, USA. 7-8, lower Paleocene localities: 7, Ravenscrag Formation, Pine Cree Park locality, Saskatchewan, Canada; 8, Tullock Member, localities in Garfield and McCone Counties, Montana. USA. 9, upper Paleocene localities, Ravenscrag Formation, Roche Percée area, Saskatchewan, Canada. Modified from Brinkman et al. (2021, figure 1).
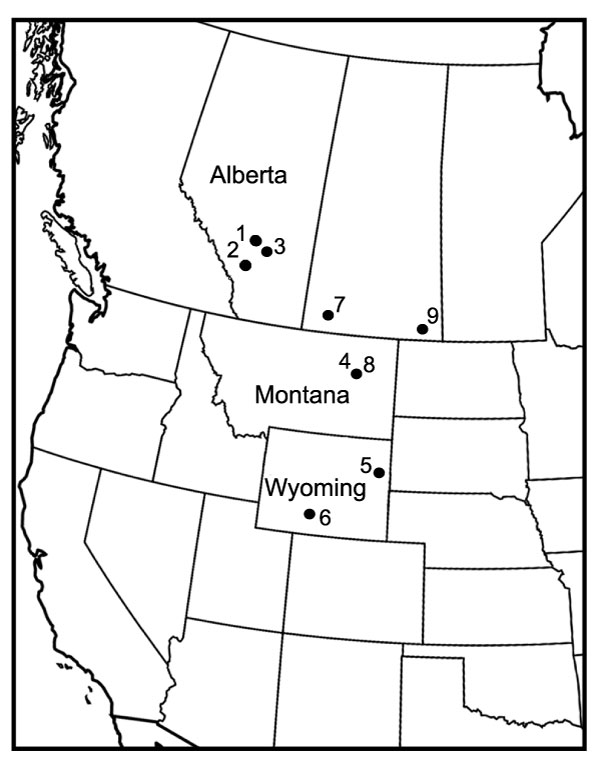
FIGURE 2. Phyllodus paulkatoi partial tooth-plates shown in occlusal and lateral views, showing variation in the surface texture of functional teeth. A, three teeth in a single stack, with the functional tooth having a rugose surface texture. B, two teeth in a stack, with the functional tooth having a smooth surface texture. Both specimens included in UCMP 191569 from locality V73080. From Brinkman et al. (2021, figure 2). Scale bar equals 2 mm.
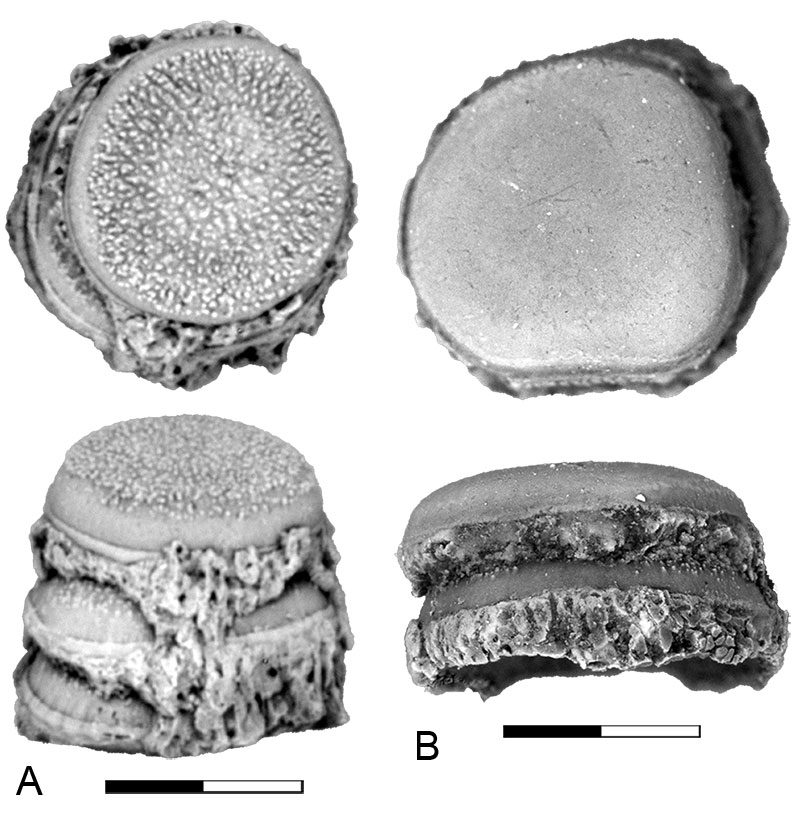
FIGURE 3. Osteoglossomorph tooth-bearing elements. A, basibranchial element of Coriops sp. 191562 from locality V73080 shown in occlusal and internal views. B, partial dentary of aff. Lopadichthys sp. in medial and lateral views, RSM 1954-114. C, dentary of Lopadichthys colwellae from the anterior Paskapoo Formation of Alberta, UALVP 15069. D, dentary of Ostariostoma sp. from the Ravenscrag Formation of Saskatchewan shown in lateral, occlusal, and medial views, UALVP 58819. Scale bar equals 2 mm.
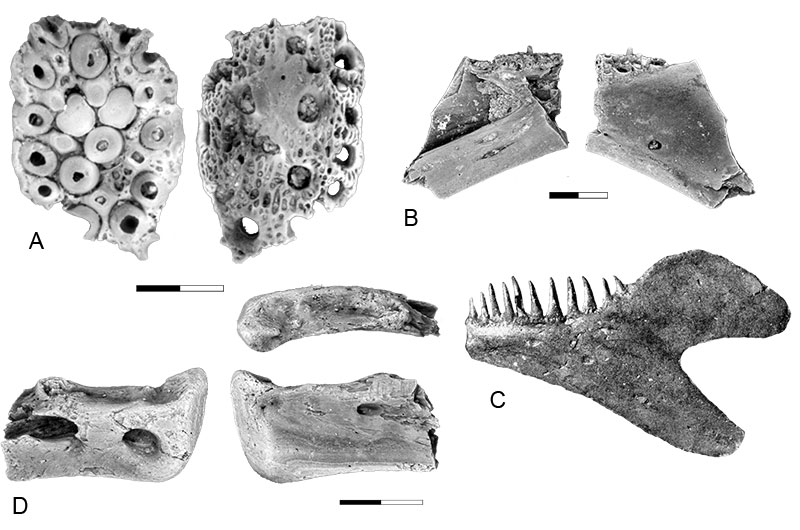
FIGURE 4. Centra of Coriops or Lopadichthys sp. from the Pine Cree locality in anterior, left lateral, posterior, dorsal, and ventral views. A, anterior abdominal centrum, RSM 1954-95. B-C, mid abdominal centra, both included in RSM 1954-95. D, posterior abdominal centrum, RSM 1954-95. Scale bar equals 2 mm.
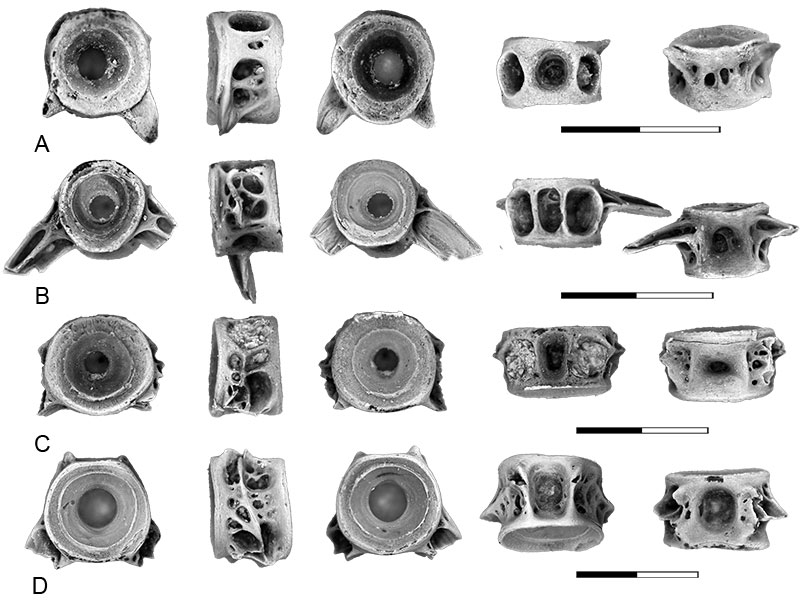
FIGURE 5. Centra of Diplomystus sp. from the Pine Cree locality in anterior, left lateral, posterior, dorsal, and ventral views. A, RSM 1594-35. B, RSM 1594-36. Scale bar equals 2 mm.
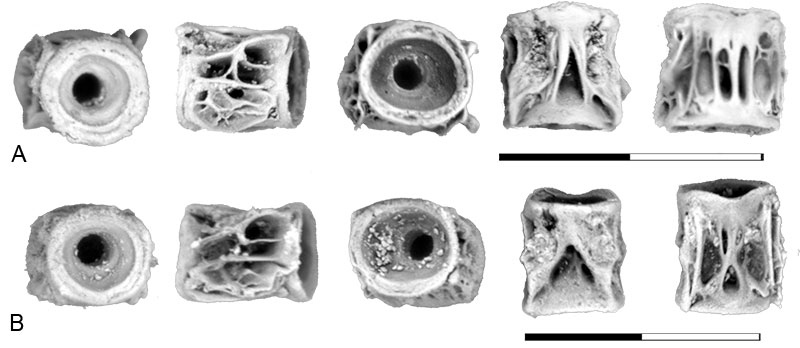
FIGURE 6. Centra of gonorynchiform indet. type H from the Pine Cree locality, Ravenscrag Formation, Saskatchewan, shown in anterior, left lateral, posterior, dorsal, and ventral views. A-B, first abdominal centrum: A, UALVP 58815; B, specimen RSM 1594-8. C, anterior abdominal centra, showing autogenous paraphyses, RSM 1594-7. D, posterior abdominal centra, showing parapophyses fused to the centrum; RSM 1595-6. Scale bar equals 2 mm.
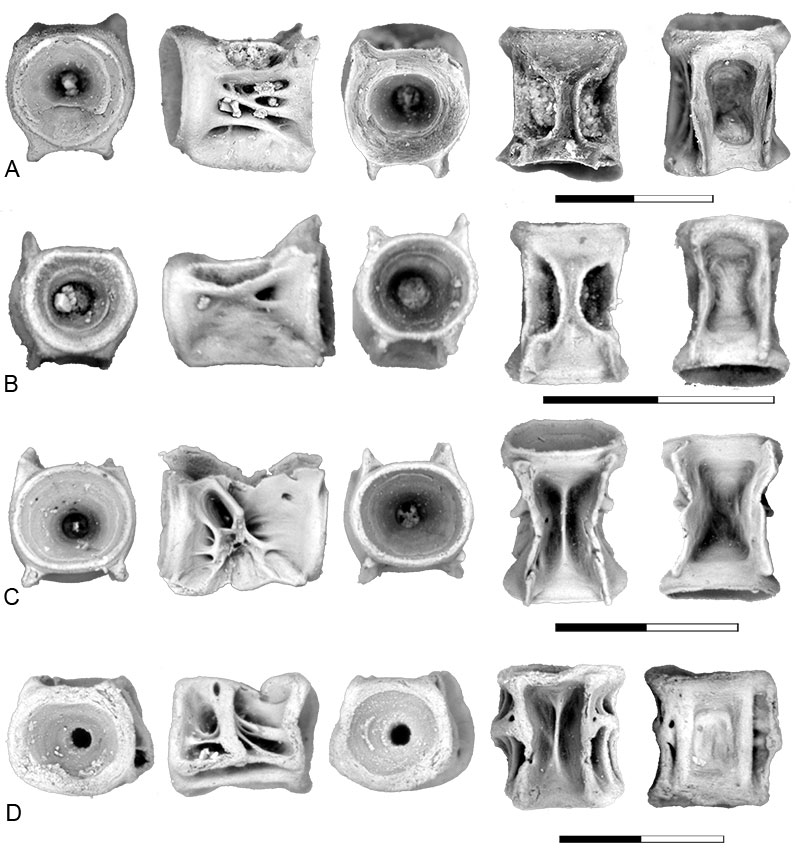
FIGURE 7. Cranial and postcranial elements of Notogoneus from the Pine Cree locality, Ravenscrag Formation, Saskatchewan. A, anterior end of vomer shown in dorsal and ventral views, RSM 1594-78. B, anguloarticular shown in medial, lateral (upper row), dorsal and ventral (lower row) views, RSM 1594-80. C, dentary shown in medial and lateral views, RSM 1594-82. D, retroarticular shown in lateral, anterior, and medial views, RSM 1594-81. E, basibranchial shown in dorsal, lateral and ventral views, RSM 1594-77. F, pectoral fin ray base shown in dorsal, anterior, and ventral views, RSM 1594-79. Scale bar equals 2 mm.
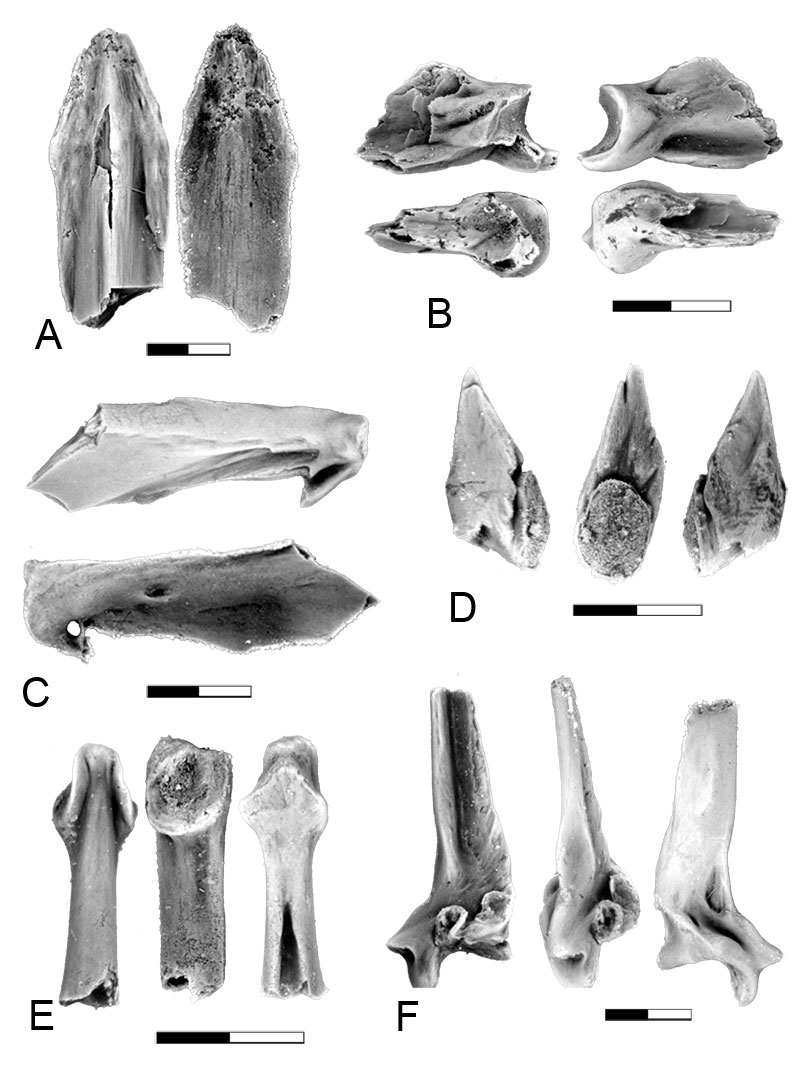
FIGURE 8. Notogoneus basioccipital and vertebral elements shown in anterior, left lateral, posterior, dorsal, and ventral views. From the Pine Cree Park locality, Ravenscrag Formation, Saskatchewan. A, basioccipital, UALVP 58823. B, first abdominal centrum, RSM 1594-9. C-E, abdominal centra, showing variation in development of ridges on the side of the centrum: C, RSM 1594-30; D, RSM 1594-31; E, RSM 1594-32. Scale bar equals 2 mm.
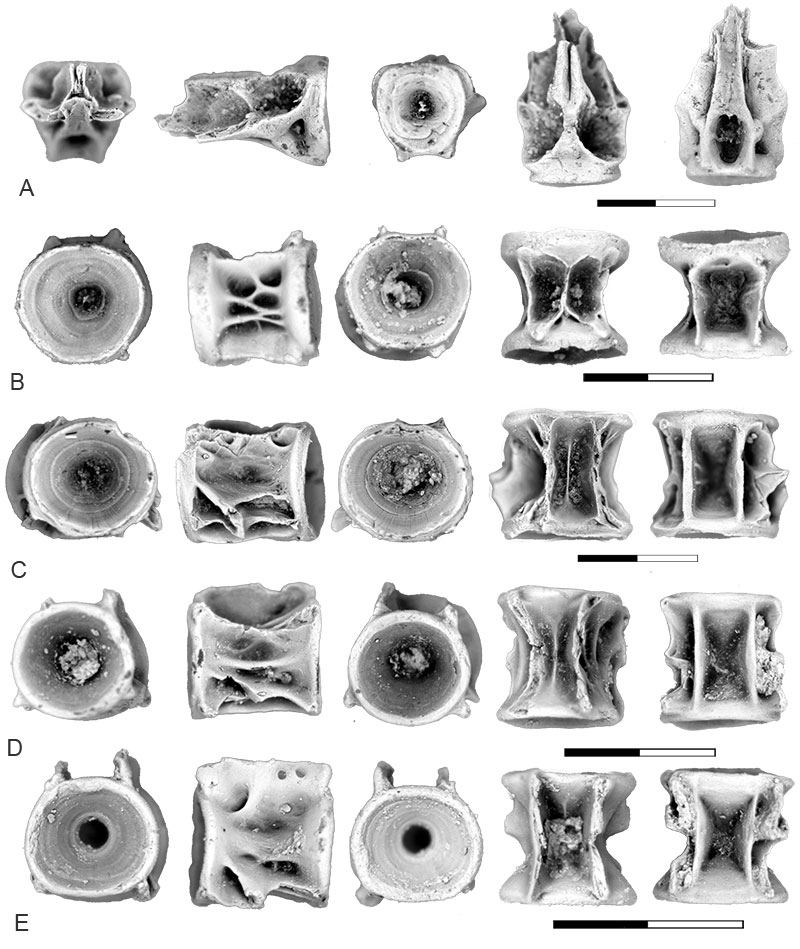
FIGURE 9. Teleost elements of Otophysi indet. type U3/BvD. A-B, dentaries of Otophysi indet. type U3/BvD (P morph) in occlusal (upper row), internal and lateral (lower row) views, both included in UCMP 191569 from locality V73080. C-G, centra shown in anterior, left lateral, posterior, dorsal, and ventral views: C, first Weberian centrum of Otophysi indet. type U3/BvD (P morph) UCMP 230603 from locality V73087; D-F, post-Weberian centra of Otophysi indet. type U3/BvD (P morph) showing variation in the development of mid-ventral pits, all included in UCMP 191564 from locality V73080; G, first Weberian centrum of Otophysi indet. type U3/BvD (K morph) UCMP 276731 from locality V74111. Scale bar equals 2 mm.
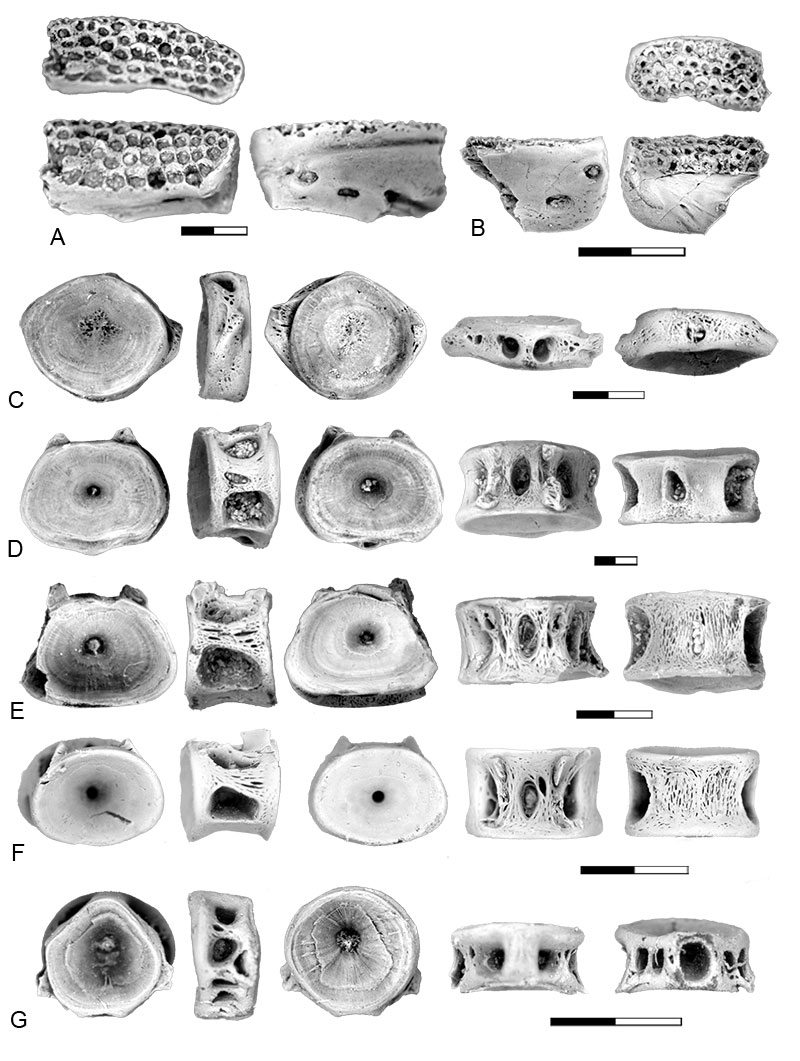
FIGURE 10. Skeletal elements of Estesesox sp. A, dentary in (upper row) dorsal, ventral, (lower row) medial, symphyseal, and lateral views, UCMP 276730 from locality V74111. B, palatine in dorsal and ventral views, UCMP 230660 from locality V74111. C-E, centra shown in anterior, left lateral, posterior, dorsal and ventral views: C, UCMP 230659 from locality V74111; D, UCMP 230708 from locality V72210; E, UCMP 230708 from locality V72210. Scale bar equals 2 mm.
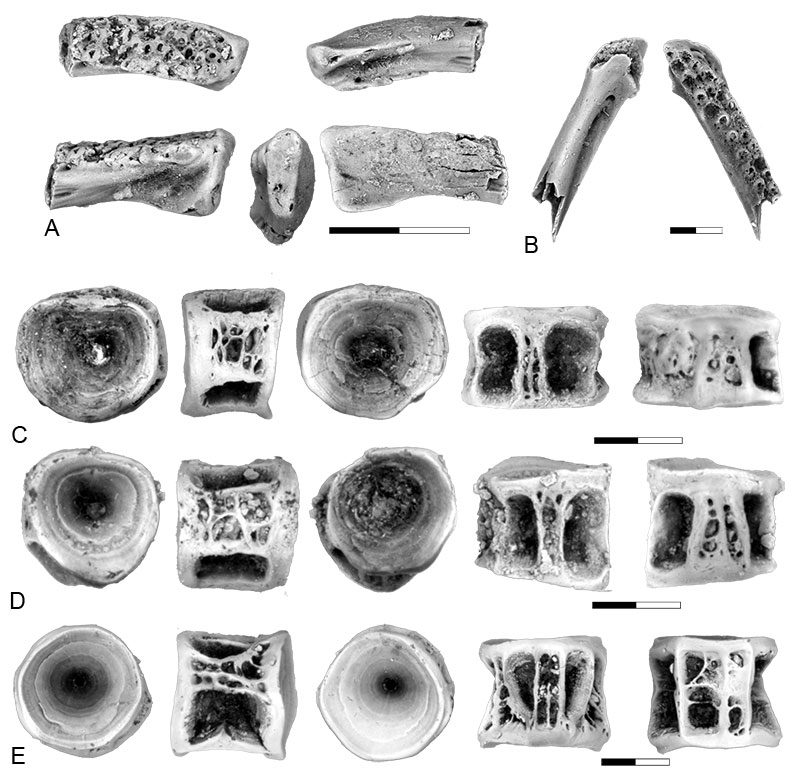
FIGURE 11. Esox sp. elements from the early Paleocene of Montana and Saskatchewan. A, dentary in medial, lateral, dorsal and ventral views, UCMP 191574 from locality V73080. B, palatine in dorsal and ventral views, UCMP 230701 from locality V72210. C-D, abdominal centrum with mid-ventral groove, both included in UCMP 276775 from locality V77128. Abbreviation: mx pr: maxillary process. Scale bar equals 2 mm.

FIGURE 12. Acanthomorph dentaries shown in occlusal, ventral (upper row), medial, and lateral (lower row) views. A, aff. Lindoeichthys dentary, RSM 1594-59. B, dentary of aff. McConichthys in ventral, occlusal, medial and lateral views, UCMP 191569 from locality V73080. C, dentary of aff. McConichthys with internal canals reconstructed from micro-CT scans. D, “Priscacara” dentary, RSM 1594-57. Abbreviations: mand tri can, mandibular trigeminal canal; Meck can, Meckelian canal. Scale bar equals 2 mm.
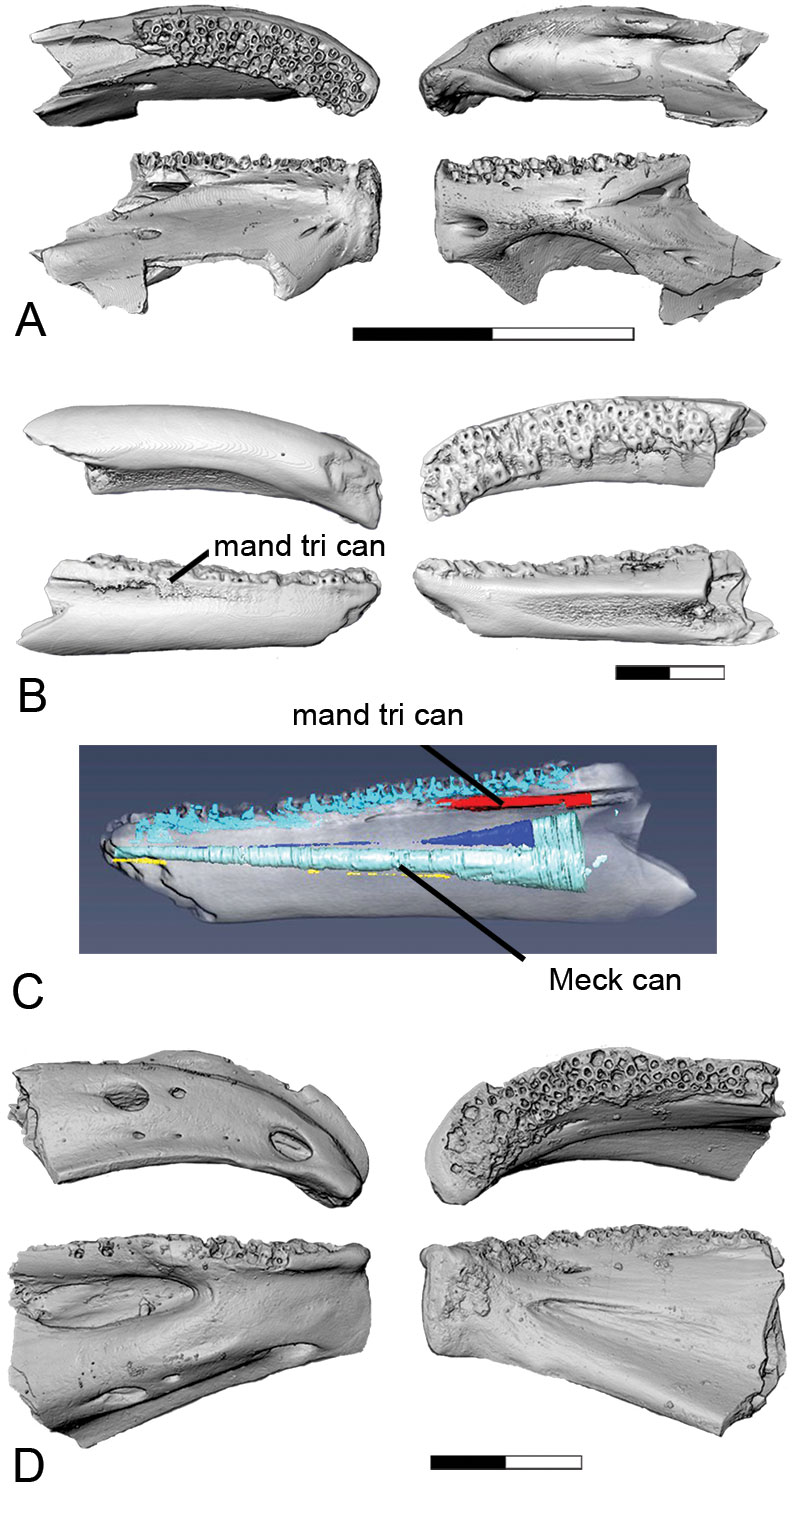
FIGURE 13. Acanthomorph premaxillae. A, premaxilla of Holocentrus in lateral and medial, views, ROM R2198, scale bar equals 5 mm. B, acanthomorph indet. premaxilla in lateral, medial, dorsal, and occlusal views, UALVP 58820, from the Pine Cree Park locality, scale bar equals 2 mm. C, acanthomorph indet. premaxilla with internal canals reconstructed from micro-CT scans.
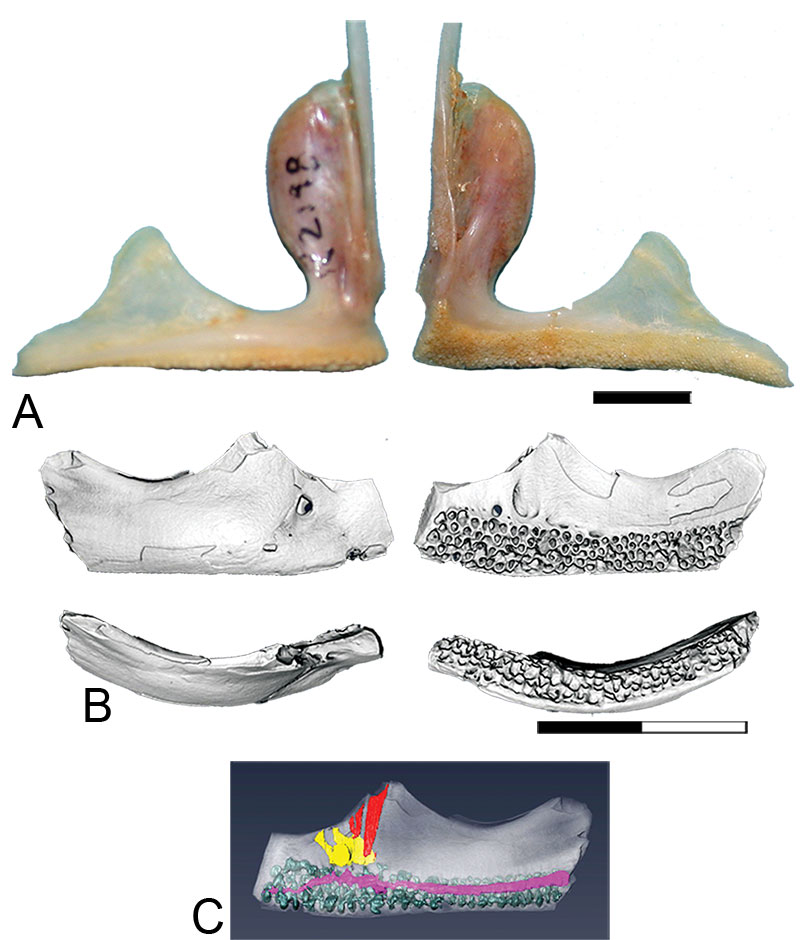
FIGURE 14. Acanthomorph centra type HC-1 shown in anterior, left lateral, posterior, dorsal, and ventral views. A-B, first abdominal centra; A, RSM 1594-47; B, RSM 1594-48. C-E, abdominal centra showing variation in length: C, RSM 1594-21; D, RSM 1594-18; RSM 1594-21; E, RSM 1594-21. Scale bar equals 2 mm.
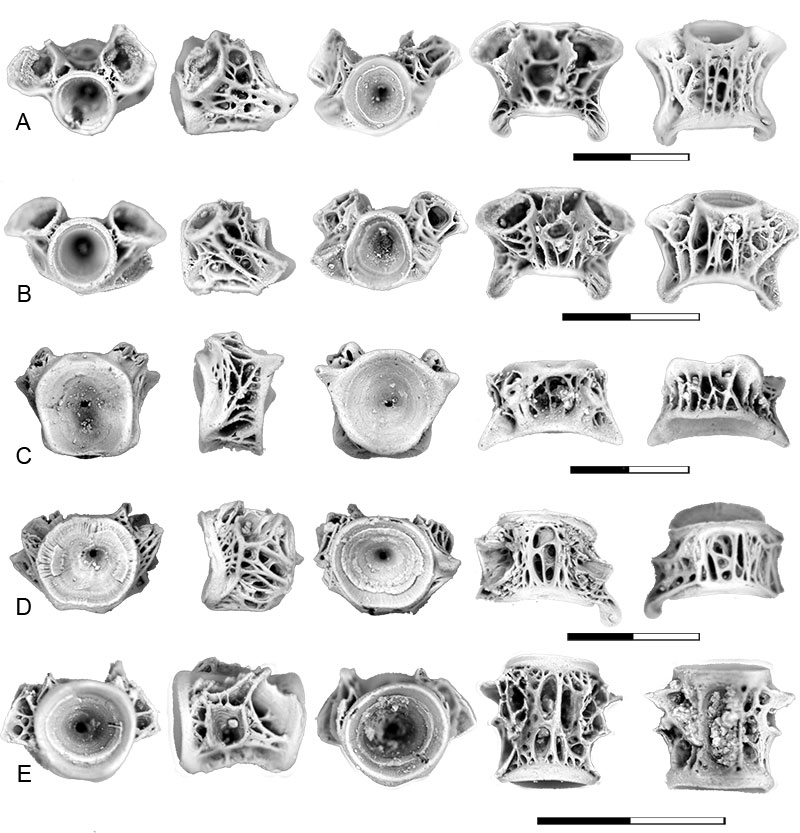
FIGURE 15. Acanthomorph centra type HC-2 shown in anterior, left lateral, posterior, dorsal, and ventral views. A-B, first abdominal centrum, showing variation in the development of the mid-ventral pit: A, RSM 1594-37; B, RSM 1594-38. C, anterior abdominal centrum with course network of ridges on side of centrum, RSM 1594-15. D, anterior abdominal centra with fine network of ridges on side of centrum, RSM 1594-12. E, mid- to posterior abdominal centrum with fine network of ridges on side of centrum, RSM 1594-13. Scale bar equals 2 mm.
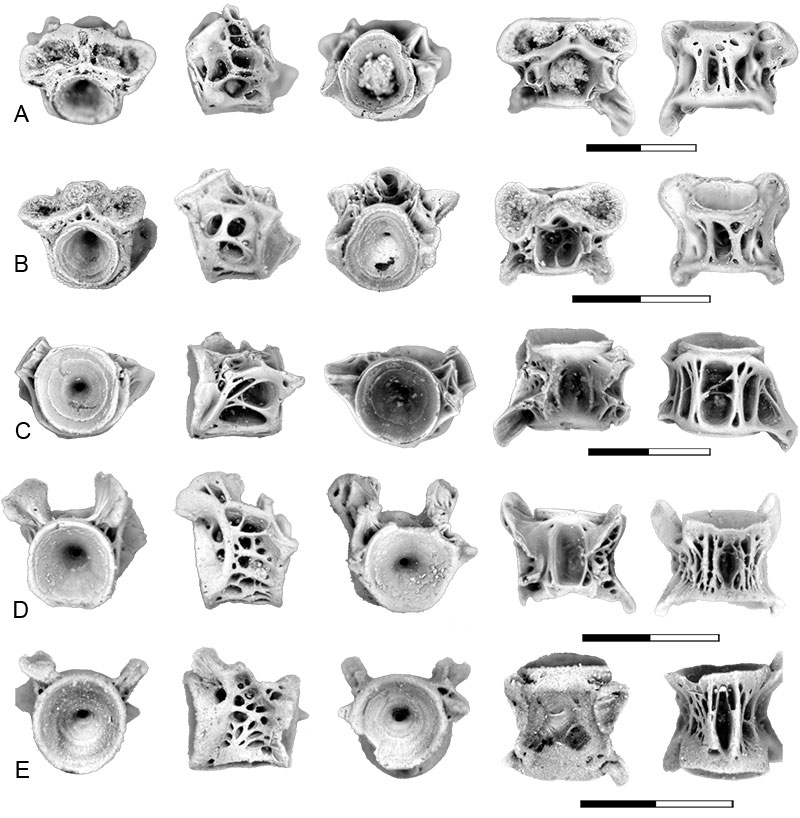
FIGURE 16. Acanthomorph centra type HC-4 shown in anterior, left lateral, posterior, dorsal, and ventral views. A, anterior abdominal centrum, UCMP 191570 from locality V73080. B, mid-abdominal centrum UCMP 191570 from locality V73080. Scale bar equals 2 mm.
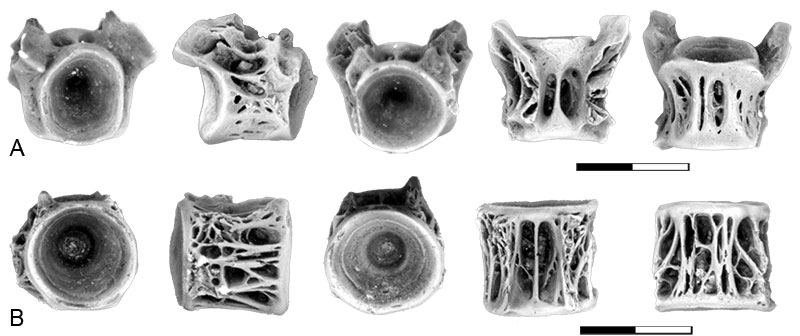
FIGURE 17. Acanthomorph centra type HC-5 shown in anterior, left lateral, posterior, dorsal, and ventral views. A-B, first abdominal centrum, showing variation in development of ridges on ventral surface of centrum: A, UCMP 230644 from locality V74111; B, UCMP 230646 from locality V74111. C-E, abdominal centra showing variation in length of the centrum and development of a mid-ventral pit; all included in UCMP 191570 from locality V73080. Scale bar equals 2 mm.
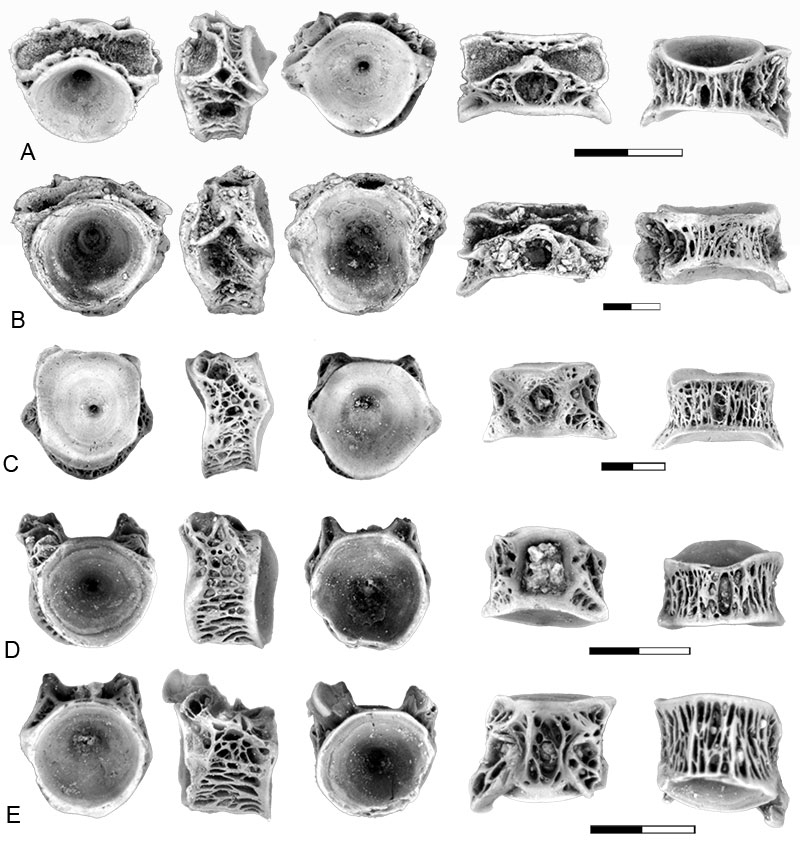
FIGURE 18. Acanthomorph centra type AvE, shown in anterior, left lateral, posterior, dorsal, and ventral views, all from the Pine Cree Park locality, Ravenscrag Formation, Saskatchewan. A-B, first abdominal centra: A, RSM 1594-43; B, RSM 1594-40. C-E, abdominal centra showing variation in length: C, RSM 1594-23; D, RSM 1594-25; E, RSM 1594-24. Scale bar equals 2 mm.
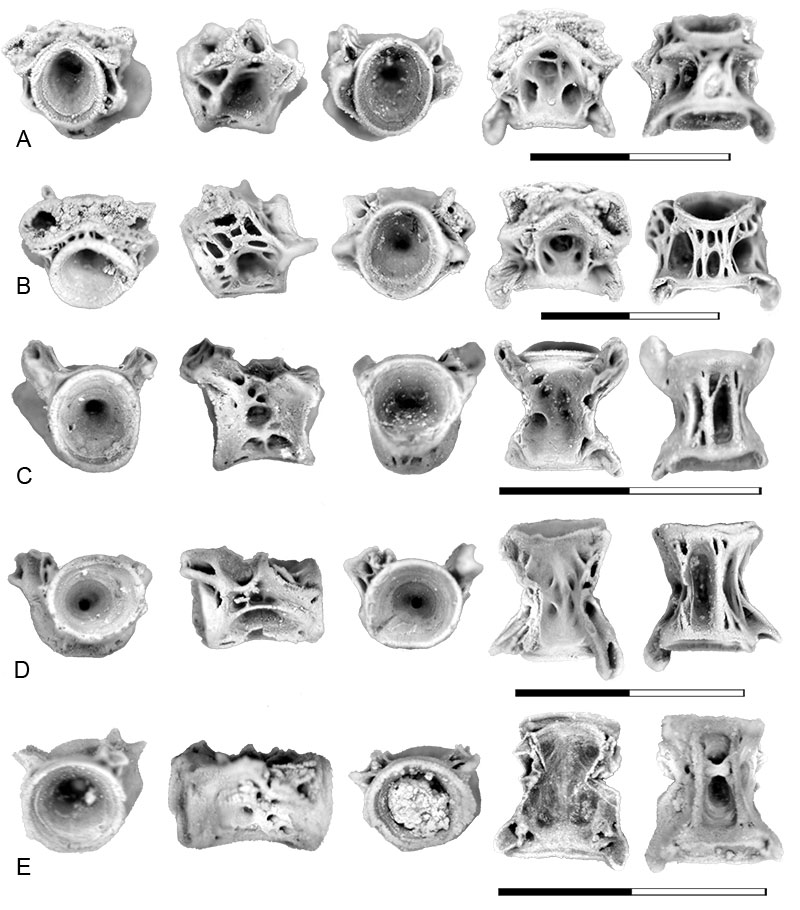
FIGURE 19. Teleost indet. centrum type U-4, shown in anterior, left lateral, posterior, dorsal, and ventral views, showing variation in development of pits on the side and ventral surface of the centrum. A, UCMP 230654 from locality V74111. B, UCMP 230654 from locality V74111. C, UCMP 230709 from locality V72220. D, UCMP 191563 from locality V73080. Abbreviations: mid-dor-pit: mid-dorsal-pit; neur arch pit: neural arch pit. Scale bar equals 2 mm.
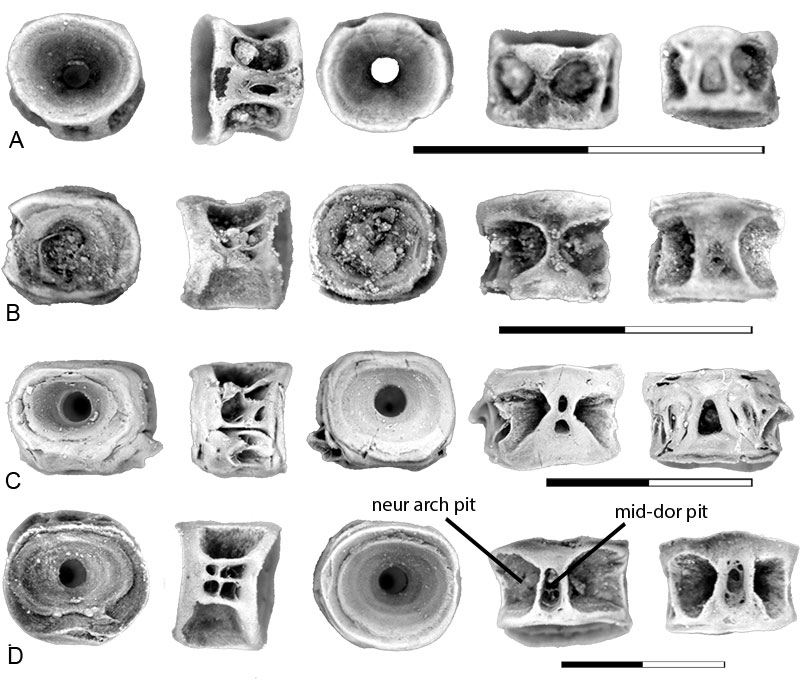
FIGURE 20. Teleost indet. centrum type PT-1, shown in anterior, left lateral, posterior, dorsal, and ventral views. A, UCMP 276762 from locality V77128. B, UCMP 276763 from locality V77128. C, UCMP 276762 from locality V77128. D, UCMP 276762 from locality V77128. E, UCMP 276763 from locality V77128. Scale bar equals 2 mm.
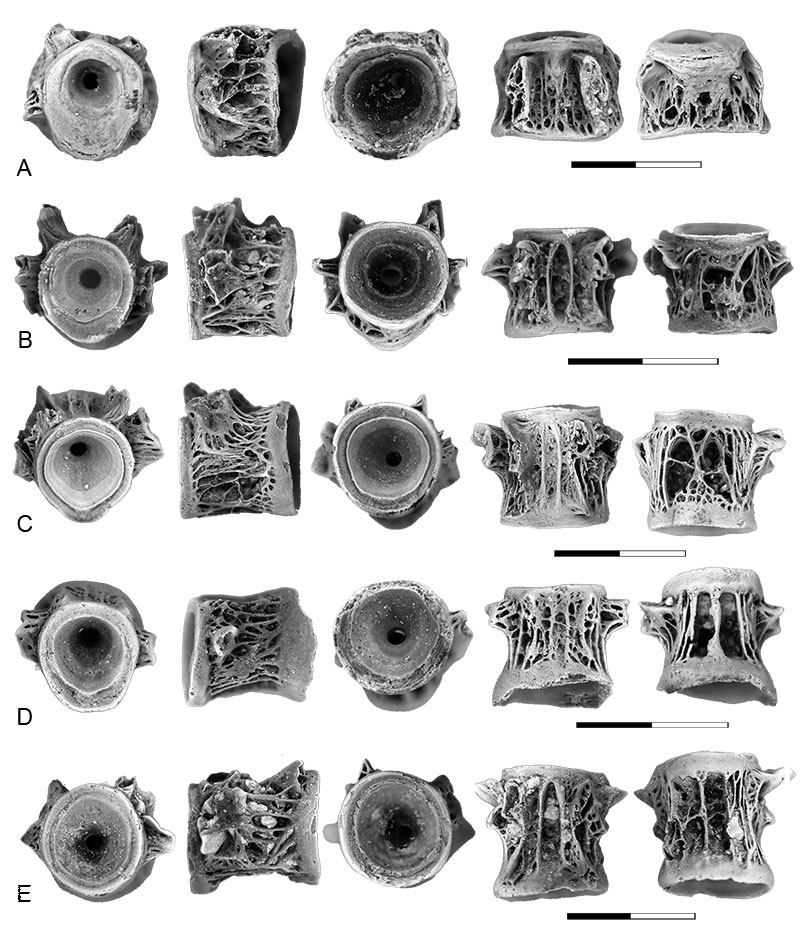
FIGURE 21. Teleost taxonomic richness through the latest Maastrichtian (Lancian NALMA) and earliest Paleocene (Puercan NALMA) of northeastern Montana, USA and southern Saskatchewan, Canada. Bottom graph: local teleost richness of Garfield County, Montana from the Hell Creek Formation (HC) and lower half of the Tullock Member of the Fort Union Formation (Tu). Top graph: regional teleost richness or the local Montanan plus Pine Cree Park (PCP) of the Ravenscrag Formation, Saskatchewan. Data from PCP were included in the regional graph to fill the temporal gap (Puercan 2 NALMA substage or Pu2) in the Montana record. Note that the bottom of the Y-axis of the top graph is truncated to save space. Richnesses are represented as (1) raw number of operational taxonomic units (OTU) per locality (filled black circles), (2) expected OTU richness (white diamonds with 95% confidence intervals) from rarefaction analysis of 124-specimen subsamples from select localities (see text for details and Table 3 for statistics), (3) standing OTU richness through the interval (gray shades under solid gray lines), and (4) standing OTU richness of local K-Pg extinction survivors (gray shades under dashed lines). Locality names are positioned near their respective raw and rarefied richness symbols with HC and Tu locality names shown only in the local richness graph. The chronostratigraphic framework for the Hell Creek and Tullock Member is based on an Ar-Ar radiometric age determination for the K-Pg boundary (†), ages of the geomagnetic polarity chron boundaries (‡), and an estimated age for the base of the Hell Creek Formation (*). See Sprain et al. (2018 and references therein) for details and age uncertainties. The vertical dashed lines demarcating the lower and upper boundaries of the Pu2 (see dark gray box) are approximate within the Tullock Member. The placement of the PCP locality within the Pu2 of the Ravenscrag Formation is meant only to demonstrate the localities temporal position (Pu2) relative to the Pu1 and Pu3 localities of the Tullock Member, not its measured stratigraphic position. The question mark (?) on the vertical dashed line at the Torrejonian 1 boundary indicates its temporal and stratigraphic uncertainty. Abbreviations: CMM, Celeste’s Magnificent Microsite locality; FH, Fox Hills Formation; K-Pg, Cretaceous-Paleogene; M1, Morales 1 locality; Ma, million years; McK R1, McKeever Ranch 1 locality; Mbr./Fm., member or formation; NALMA, North American Land Mammal “age”; OTU, operational taxonomic unit; PCP, Pine Cree Park locality; Pmag., geomagnetic polarity chron; Pu1, Pu2 (gray because Pu2 fauna has not been found in the local area), Pu3, Puercan 1, 2, 3; R, Ravenscrag Formation; Strat. (m), stratigraphic position in meters relative to the K-Pg boundary; To1, Torrejonian 1; WC1, Worm Coulee 1 locality; YSH8, Yellow Sand Hill 8 locality.
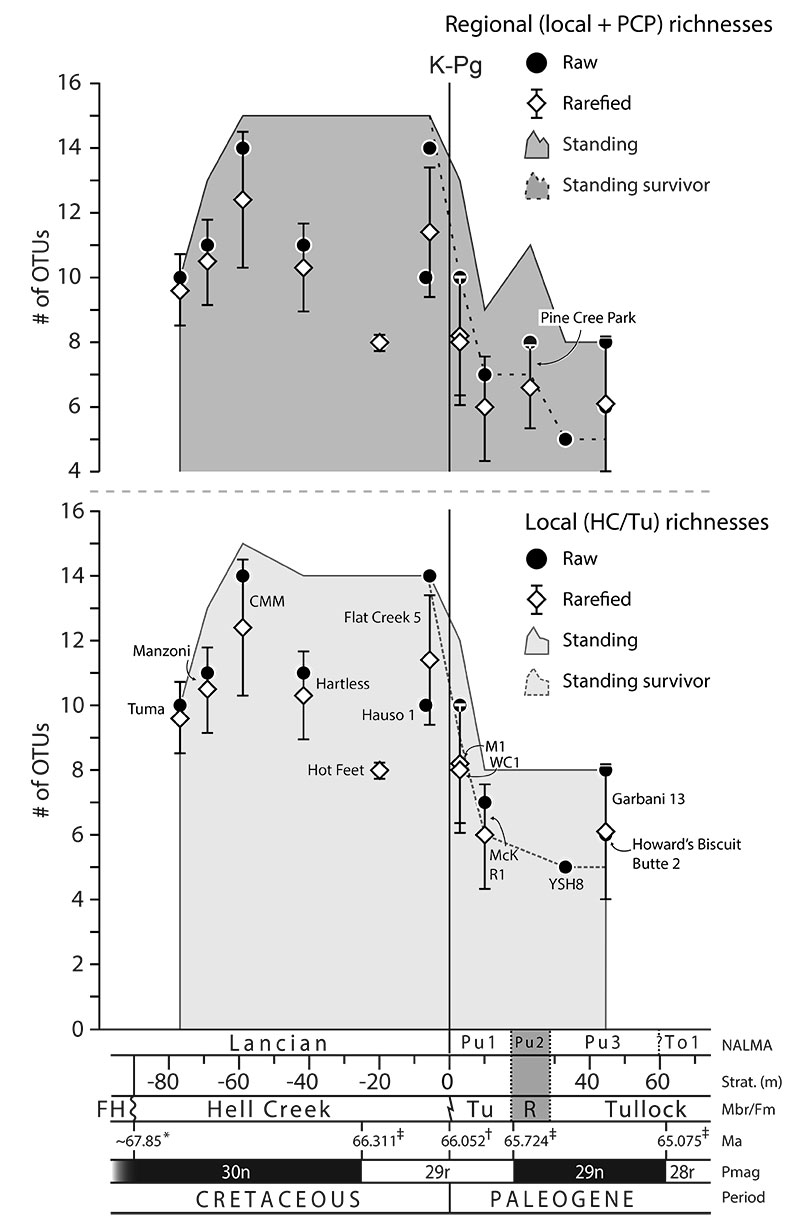
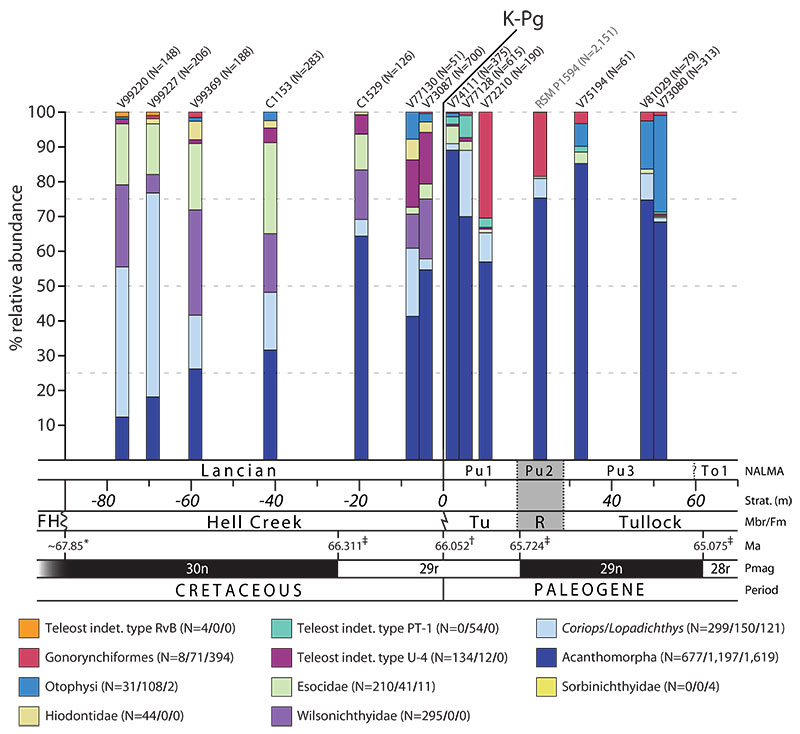
FIGURE 22. Higher-level taxonomic patterns of relative abundances of teleosts through the Hell Creek Formation and lower half of the Tullock Member of the Fort Union Formation, Garfield County, Montana, USA. Data from the Pine Cree Park (PCP) locality of the Ravenscrag Formation, Saskatchewan, Canada was included to fill the temporal gap (Puercan 2 NALMA substage or Pu2) in the Montana record. Percent relative abundances are based on centra per locality (vertical stacked columns; see Table 1 and Brinkman et al. [2021, table 2 and figure 20] for details), with each locality identified at the top of the figure and their total sample size (N) indicated in parentheses. Taxa are listed at the bottom of the figure, with their total sample sizes (N) per geologic unit indicated in parentheses; the first value (to the left of the first forward slash) is the total sample size from the Hell Creek Formation, the middle value is from the Tullock Member, and the last value is from the PCP locality of the Ravenscrag Formation. The colorized box next to each taxon name corresponds to the colorized portions in the vertical stacked columns. See the caption for Figure 22 for an explanation of the chronostratigraphic framework. Figure modified from Brinkman et al. (2021, figure 20). Abbreviations: FH, Fox Hills Formation; K-Pg, Cretaceous-Paleogene; Ma, million years; Mbr./Fm., member or formation; NALMA, North American Land Mammal “age”; Pmag., geomagnetic polarity chron; Pu1, Pu2 (gray because Pu2 fauna has not been found in the local area), Pu3, Puercan 1, 2, 3; Strat. (m), stratigraphic position in meters relative to the K-Pg boundary; To1, Torrejonian 1.