FIGURE 1. A, Fossil localities with Neogene fish record. 1) Pampa de Mejillones; 2) Caleta Herradura; 3) Cuenca del Tiburón 2; 4) Cuenca del Tiburón 1; 5) La Portada; 6) Norte Bahía Caldera; 7) Mina Fosforita; 8) Bahía Inglesa; 9) Los Dedos; 10) El Rincón; 11) Horcón-Maitencillo; 12) Río Rapel; 13) Punta Perro (PPS, PPN, PPP); 14) Punta Alta; 15) Matanzas; 16) Punta El Fraile; 17) Ranquil; 18) Lebu; 19) Punta Chocoi; 20) Cucao; 21) Isla Ipún (IPN14, IPN16; IPN18); 22) Isla Lemuy (Long, 1993; Nolf, 2002; Suárez et al., 2003; Carrillo-Briceño, 2011; Oyanadel-Urbina et al., 2018; Palacios, 2019; Oyanadel-Urbina et al., 2021; Schwarzhans and Nielsen, 2021; Pérez et al., 2021). B, number of taxa by geological formations with Neogene fish records. C, temporal distribution of geologic formations containing fish fossils in Chile.
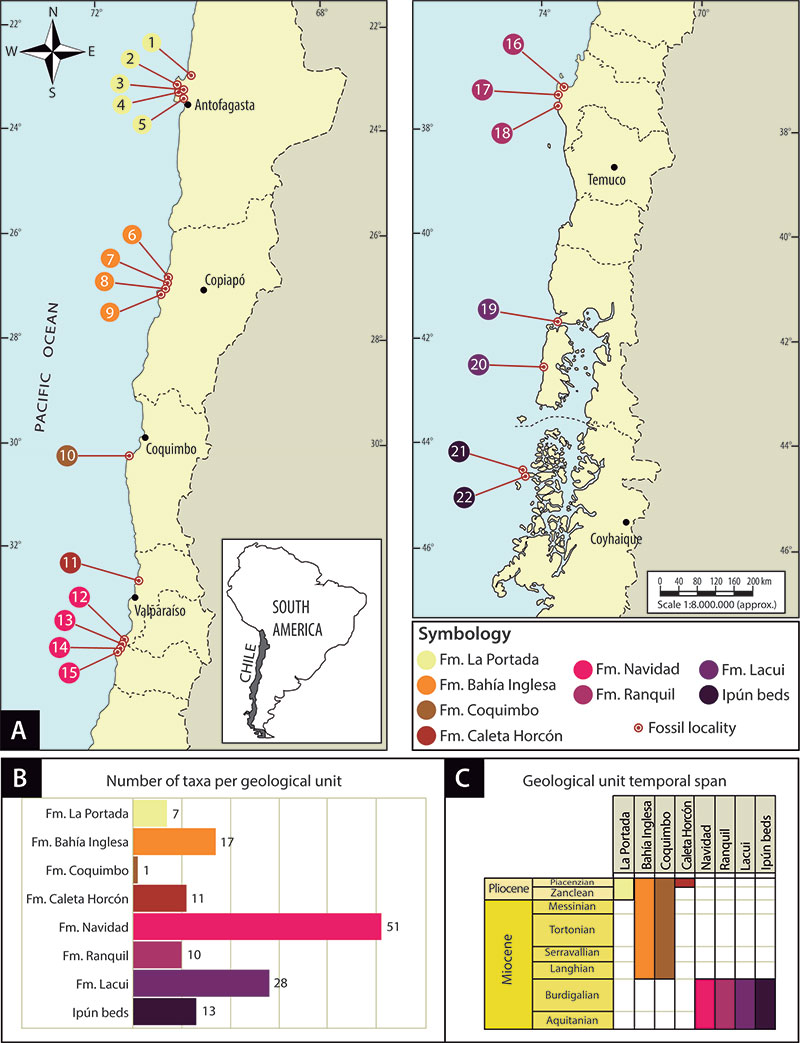
FIGURE 2. Presence-absence rarefaction curve versus sampled sites. In blue, the rarefaction curve of recorded bony fish genera for the Neogene of Chile with a 95% confidence interval (blue shading). In green, the Chao 2 index (based on presence-absence) for species extrapolation.
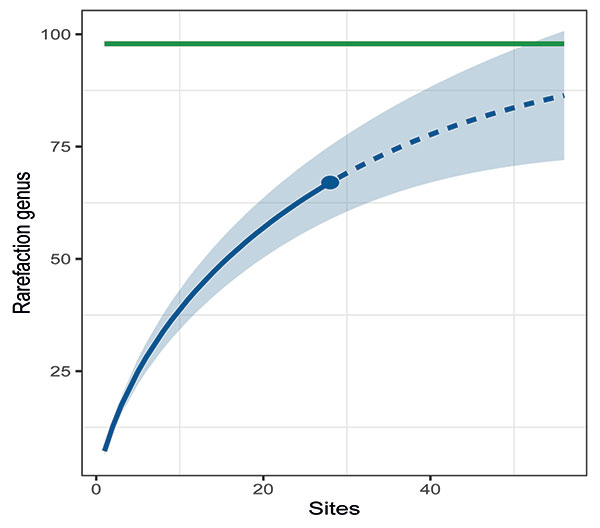
FIGURE 3. Biogeographyic dynamics of bony fishes of Chile from the Neogene to the recent. A) Frequency of extinct and survived genera, B) frequency of globally and regionally extinct genera, C) frequency of generathat maintain, increase, or decrease their latitudinal distribution ranges.
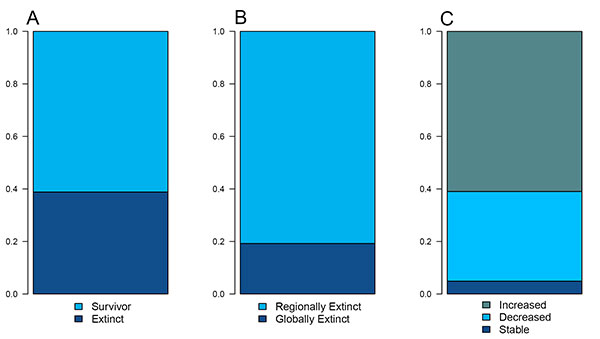
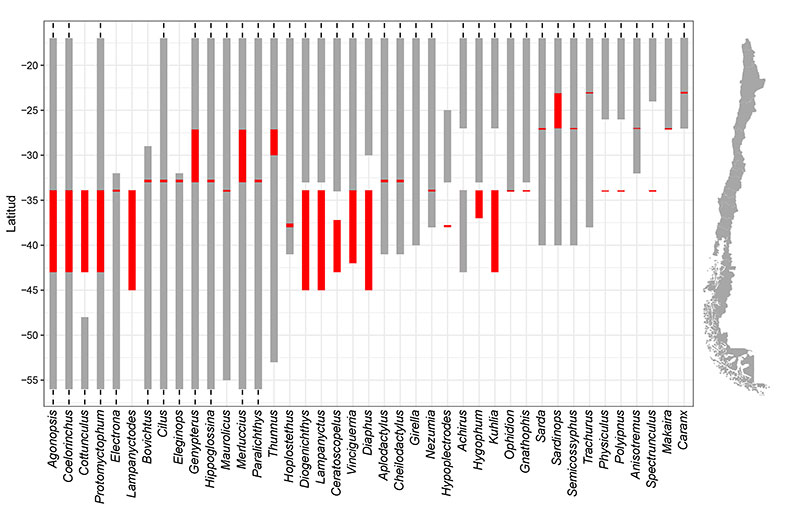
FIGURE 4. Latitudinal distribution ranges of fish genera in Chile, gray bars represent their current distribution, and red bars represent their fossil distribution.