FIGURE 1. Map and stratigraphy of the fossiliferous localities. A) Map of Newfoundland and detail of the Avalon and Bonavista peninsulas, red dots indicate the two main fossiliferous localities: the Mistaken Point Ecological Reserve (MPER) and the Catalina Dome area in the Discovery Global UNESCO Geopark; B) detail of the Catalina Dome area, surrounding the communities of Little Catalina, Catalina, Port Union and Melrose. Study site (Johnson Discovery Surface, JDS: 48.531124, -53.047274) in the Trepassey Formation of Little Catalina indicated by a red star; C) simplified stratigraphy of the Catalina Dome.
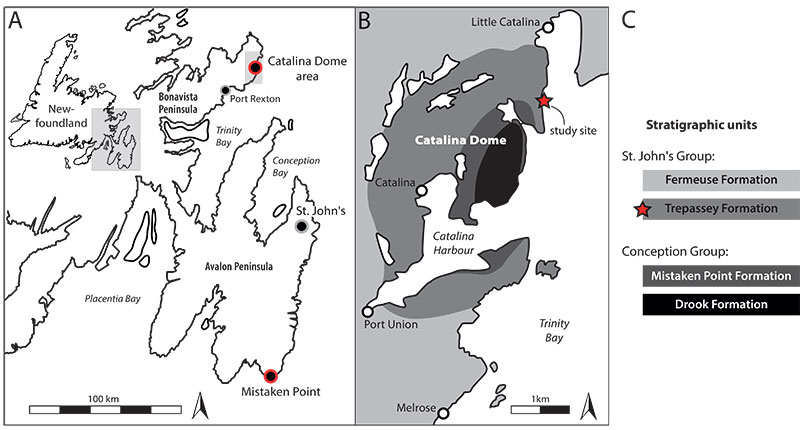
FIGURE 2. A) Two regular specimens in situ. Top: holotype of Lydonia gen. nov. (specimen id: r8); bottom: specimen id: r9. The two specimens have been previously figured and accessioned by Hofmann et al. 2008 (figure 25.4; NFM F-534). Scale bar equals 10 cm; B) irregular, trilobate specimen. Scale bar = 5 cm; C) obovate rangeomorph with a central ridge. Scale bar equals 5 cm.
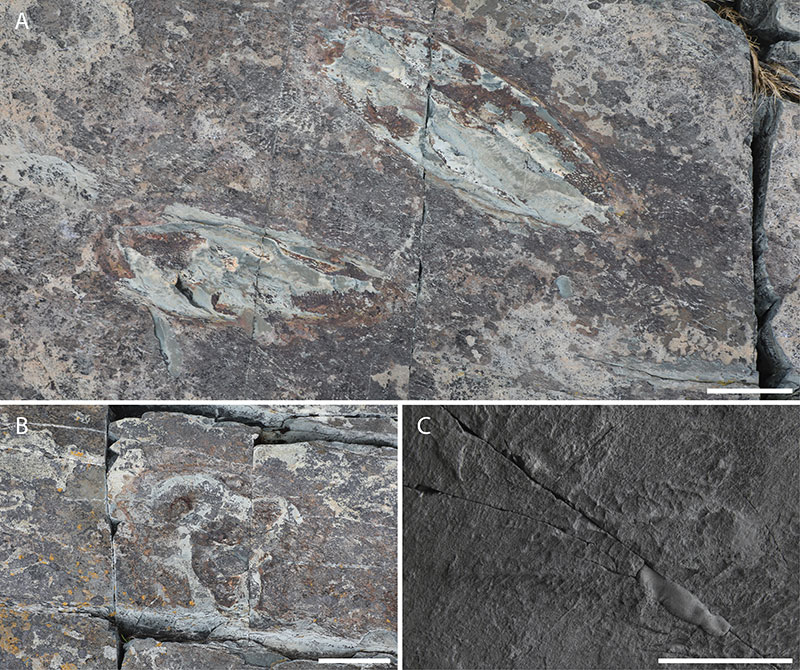
FIGURE 3. Linear models between different variables in the JDS population: A) Linear model between tV1 and tV2; B) linear model between tV1 and tV2, treating regular and irregular specimens separately; C) linear model between tV1 and tV3; D) linear model between tV2 and tV3. Circles represent regular specimens and triangles represent irregular specimens.
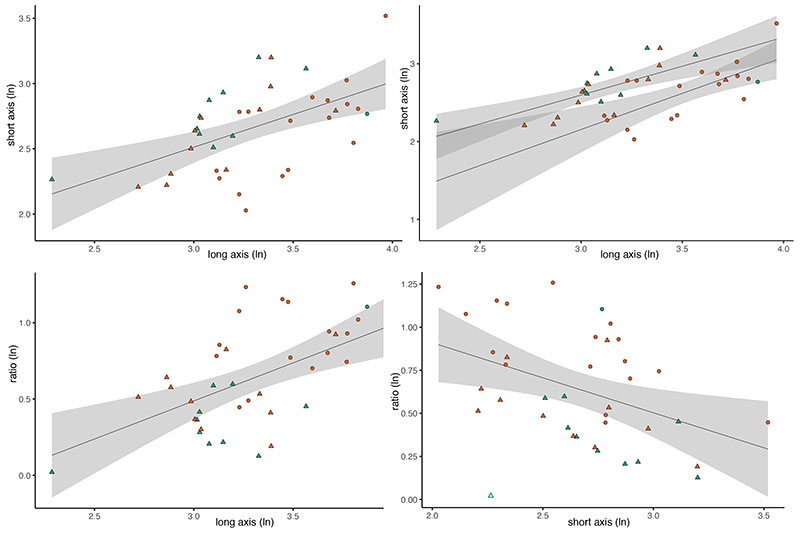
FIGURE 4. Backtransform morphospace analyses of part of the JDS population (n = 33). Specimens are identified by the letter “r” (regular) and “i” (irregular) and by an identification number.
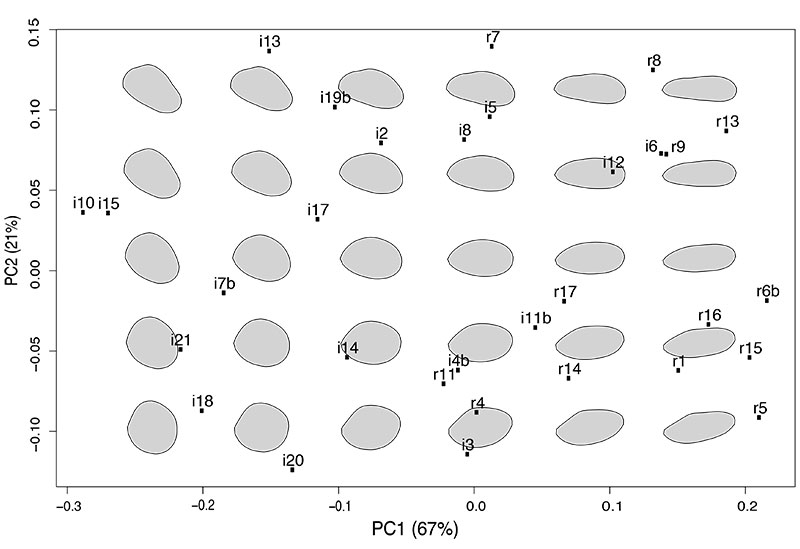
FIGURE 5. A) Rose plot with orientations of part of the JDS population (n = 31) and kernel distribution. Number in the bins is the number of specimens, bins without numbers have count of 1. The red line is the direction of the inferred palaeocurrent (from 15 towards195°); B) symmetrical ripples recording the palaeocurrent direction of 15-195°, stratigraphically underlying the fossiliferous horizon. Scale bar equals 10 cm.
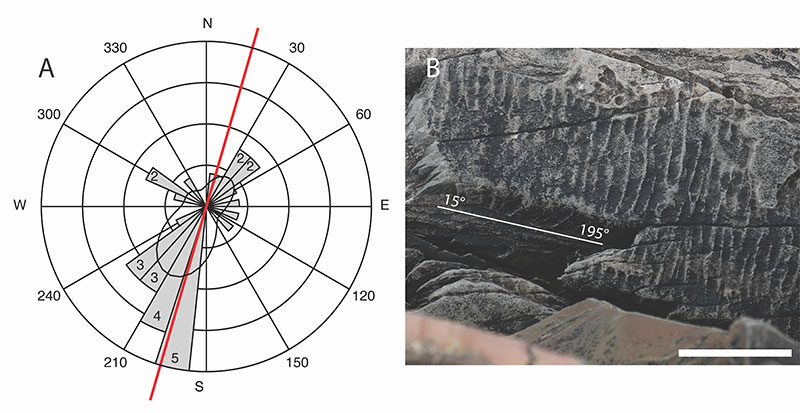
FIGURE 6. A) Detail of ferruginous mesh-like pattern on the surface of a regular specimen (r8); B) irregular specimen (i4) showing a folded upper surface, specimen previously figured in Hofmann et al. 2008 (figure 25.2); C) detail of the subconical projections observed in a single specimen (r9). Scale bar equals 5 cm.; D) detail figuring a zoom of panel A of this figure, showing pores morphology in specimen r8. All scale bars equal 5 cm.
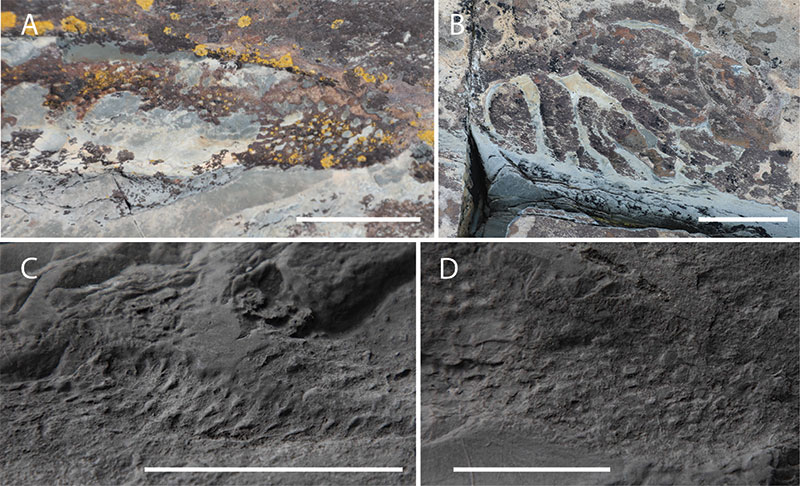
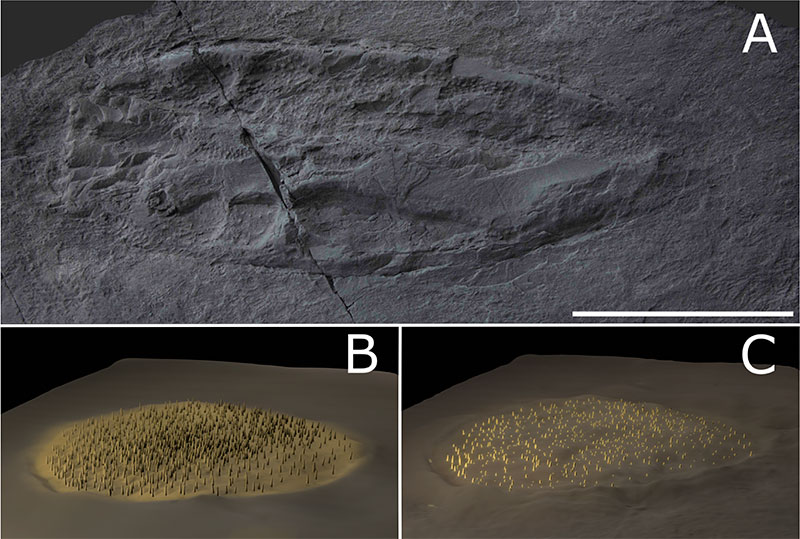
FIGURE 7. A) Variability of pores morphology within a single specimen (r8). Scale bar equals 5 cm.; B) detail of size variation of the pores within a single specimen (r8). Scale bar equals 5 cm.
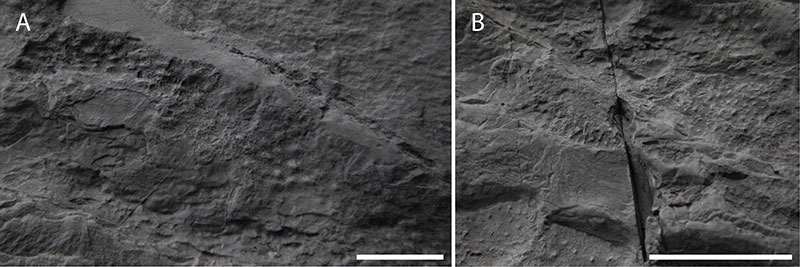
FIGURE 8. A) “Blackbrookia” specimen showing Bradgatia -like branching.; B) Fractofusus andersoni from the JDS; C) obovate specimen (i11) showing Fractofusus -like branching (yellow false-coulouring). Specimen previously figured in Hofmann et al. 2008 (figure 25.3).; D) detail of the “Blackbrookia” specimen with Bradgatia -like branching, showing porose morphology at the pointed end of the fossil. All scale bars equal 5 cm.
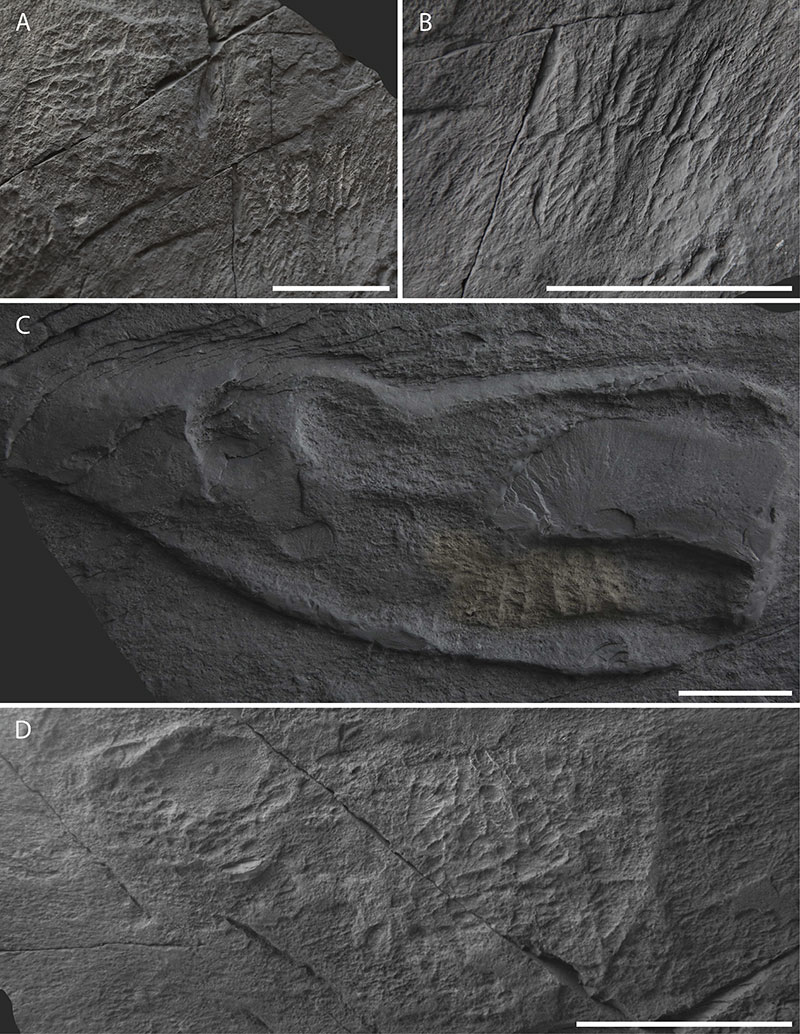
FIGURE 9. A) Size frequency distribution of tV1; B) Bayesian Inference Criterion (BIC) results for univariate data [tV1]; C) size frequency distribution of tV2; D) Bayesian Inference Criterion (BIC) results for univariate data [tV2]; E) size frequency distribution of tV3; F) Bayesian Inference Criterion (BIC) results for univariate data [tV3]); G) Bayesian Inference Criterion (BIC) results for bivariate data [tV1+tV2]; H) classification of the data point according to the best model (EEE, ellipsoidal, equal volume, shape and orientation) for bivariate [tV1+tV2] BIC. B, D, F: E and V correspond to models that assume equal and unequal variance. (G): A three letter code is associated to each model, which correspond to shape, volume and orientation, respectively and can be constrained (“E”) or unconstrained (“V”).
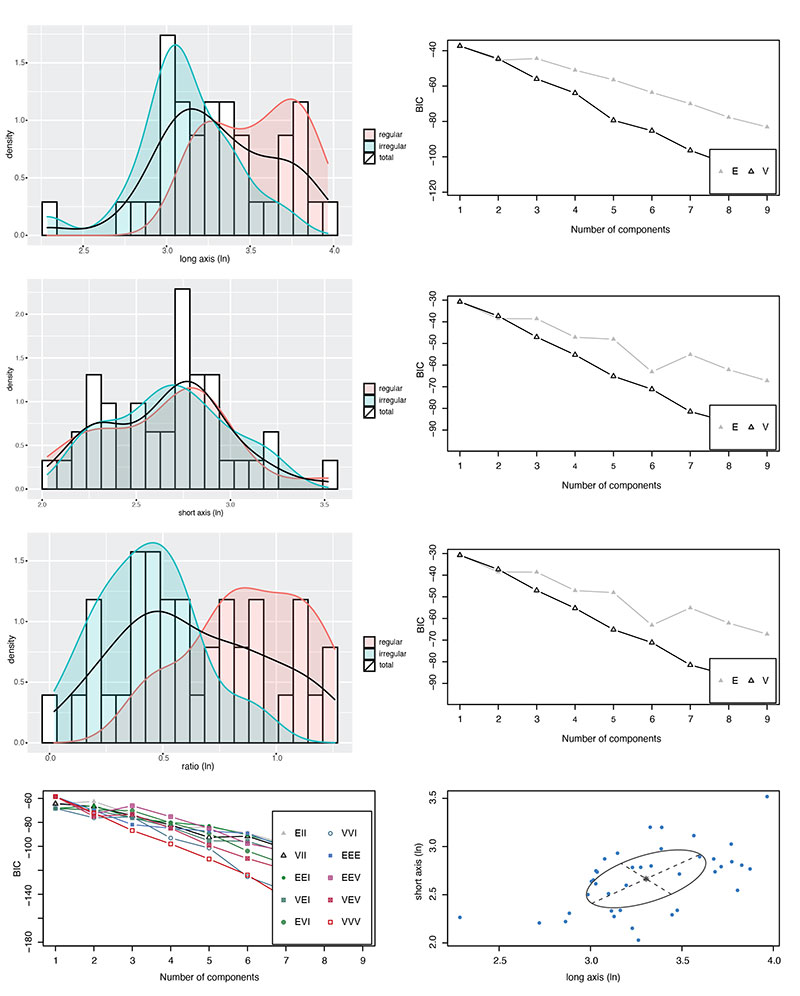
FIGURE 10. A) Specimen encrusting a possible arboreomorph from the D Surface at MPER, scale bar equals 5 cm; B) obovate specimen from the D Surface at MPER, scale bar = 5 cm; C) small circular specimen showing pores but no recognizable branching morphology from the E surface at MPER. Scale bar equals 1 cm; D) fossil matground Kinneyia from the Cambrian of Wales, UK. Scale bar equals 5 cm.
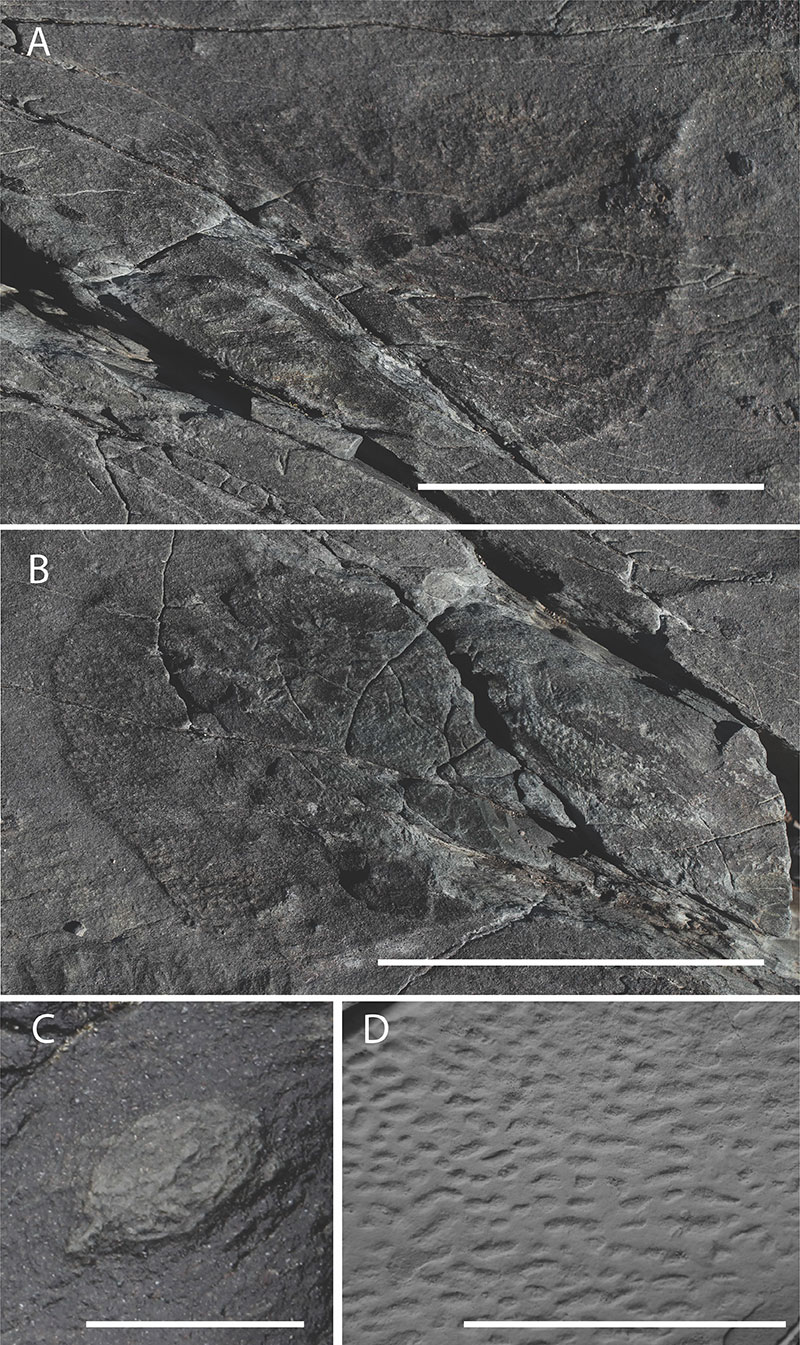
FIGURE 11. A) Jesmonite cast of the holotype of Lydonia jiggamintia (NFM F-534). Scale bar equals 10 cm; B) reconstruction of Lydonia jiggamintia as an epifaunal organism; C) reconstruction of Lydonia jiggamintia as a semi-infaunal organism, covered in microbial mat.