FIGURE 1. Map of Southeast Asia showing the locations of middle and late Pleistocene Stegodon sites. The middle Pleistocene sites include, Khok Sung, in Thailand (Suraprasit et al., 2016), Mogok Caves in Myanmar (Takai et al., 2006), Tham Om, Tham Khuyen, and Tham Hai in Vietnam (Ciochon, 2009). The late Pleistocene sites include Ban Fa Suai, in Thailand (Zeitoun et al., 2005, 2010), Nam Lot and Tham Hang South, in Laos (Bacon et al., 2008, 2011, 2012, 2015), Hang Hum, Keo Leng (Olsen and Ciochon, 1990), and Lang Trang (de Vos and Long, 1993; Long et al., 1996) in Vietnam. The insular Stegodon sites in Kedung Brubus, Trinil H.K (Hauptknochenschicht) (van den Bergh, 2001) and Ngandong (Tougard, 2001) are dated middle Pleistocene. Insert shows shaded relief map of Peninsular Malaysia with location of Stegodon Cave on the west of the Main Range batholith that forms the main highland. All key cave fossil sites like Tambun (Hooijer, 1963), Badak C Cave, Naga Mas Cave and Batu Caves (Ibrahim et al., 2013) are located on the west side of the highlands, with a new site of Gunung Layang complex on the east (Muhammad et al., 2019). Source: Shuttle Radar Topography Mission (SRTM) Digital Elevation Model (DEM) data with a resolution of 1-arc second (~30 m), courtesy of the U.S. Geological Survey, generated using ArcGIS.
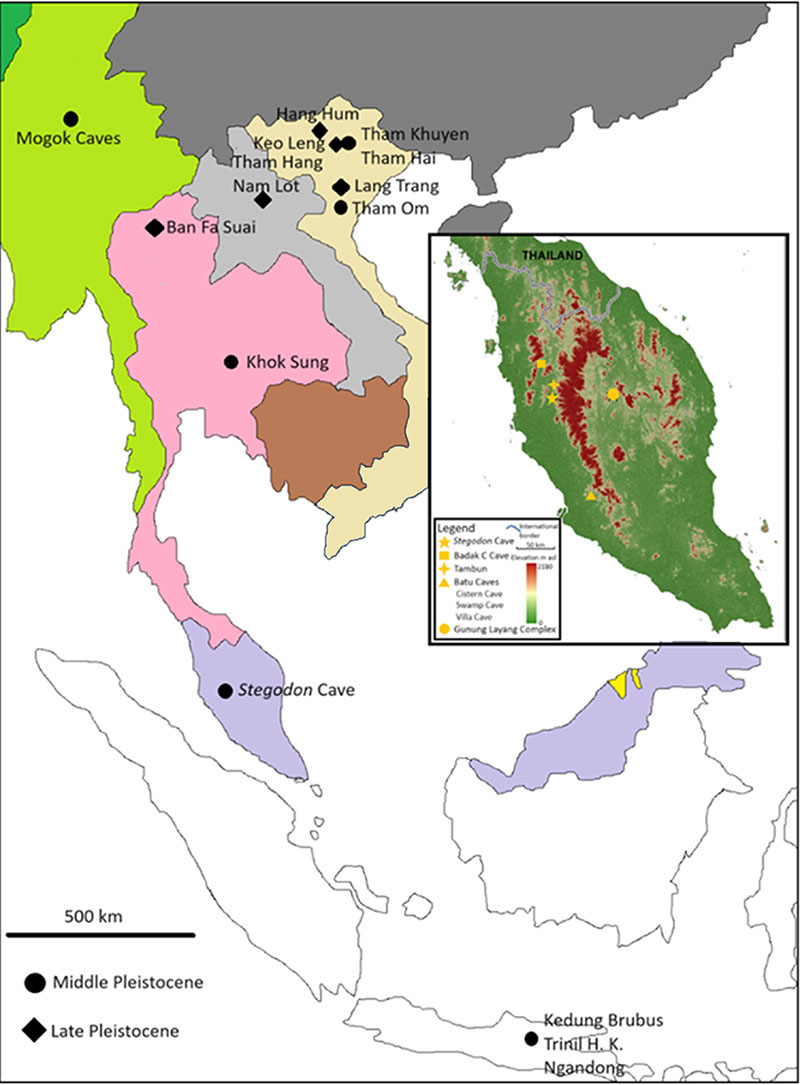
FIGURE 2. Cave map and cross-sections of Stegodon Cave along with locations of the Stegodon fossil (PRK_SC_P.01) and dating samples.
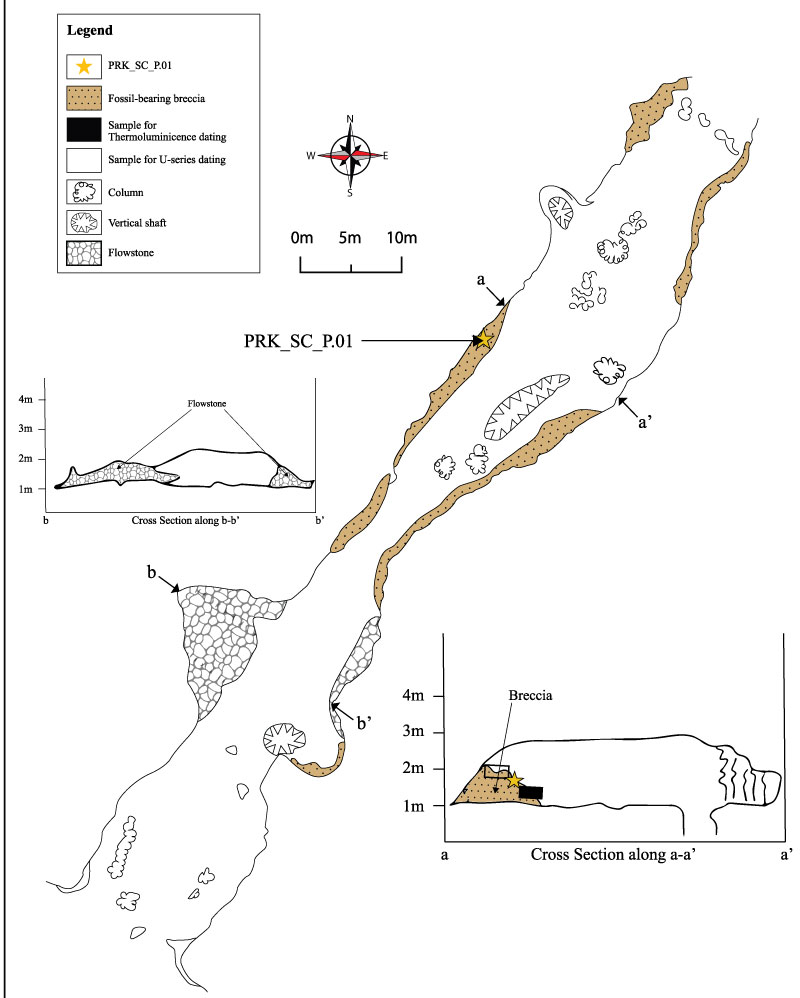
FIGURE 3. Field photos: A: northeastern entrance of the cave located about 6 m from the ground, B: showing the fossil (arrow), samples for U-Th dating (ovals) and luminescence dating (square), C: location of the fossil (arrow) about 70 cm from the cave floor, and 20 m from the northeastern entrance of the cave.
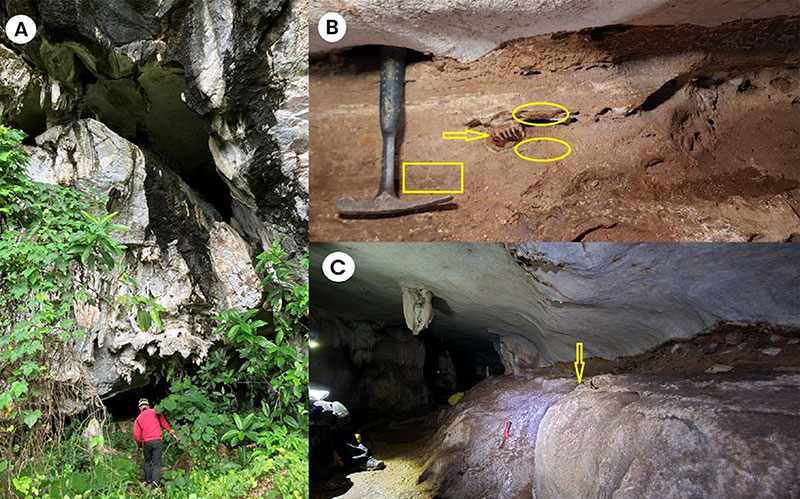
FIGURE 4. Terminology and biometric parameters used to describe Stegodon maxillary dp3 (occlusal view). ms = mesial, ds = distal, x1 = posterior cingulum, x2 = anterior cingulum, L = maximum length, W = maximum width, 1 = contact facet with preceding tooth, 2 = anterior plate, 3 = double median expansions of the enamel loop, 4 = enamel layer, 5 = enamel islands, 6 = conelet, 7 = complete enamel band with enamel wrinkles, 8 = inner enamel layer, 9 = outer enamel layer, 10 = dentine, 11 = transverse valley between plates, red dash line = median sulcus. Modified from van den Berg (1999).
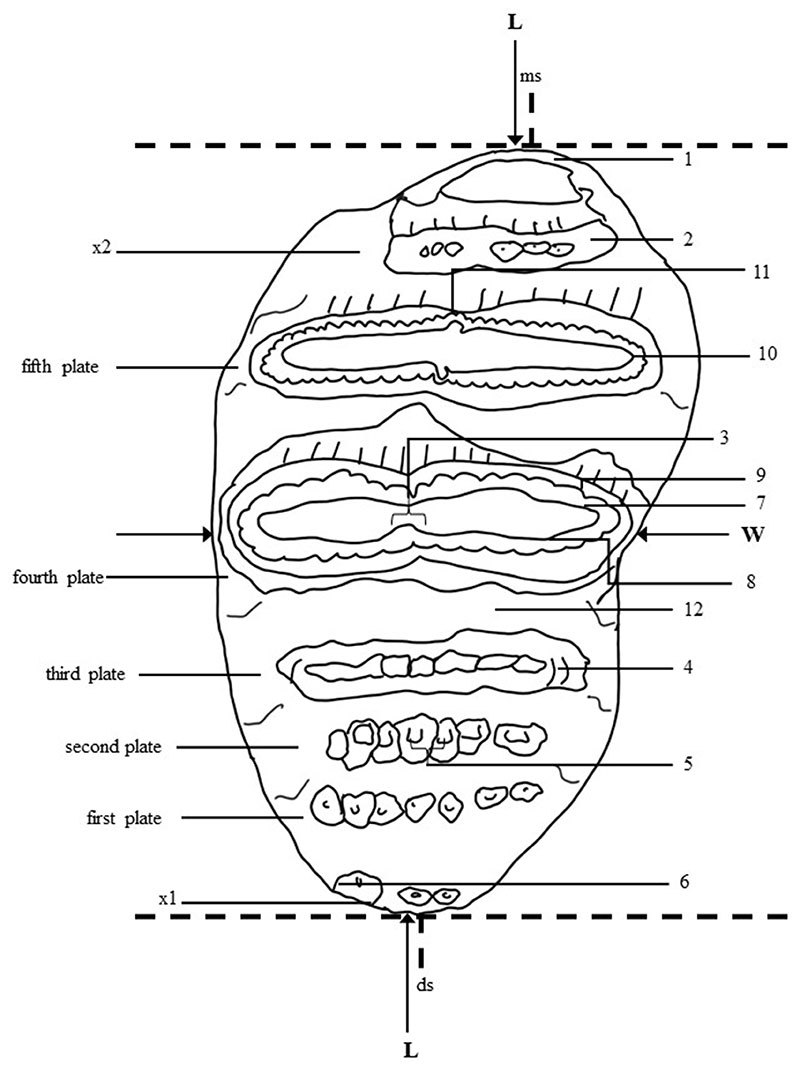
FIGURE 5. Fossil dp3 of Stegodon sp. from Gopeng, Perak (PRK_SC_P.01). A: Occlusal surface morphology based on μCT scanning. Key: ac, anterior cingulum; pc, posterior cingulum; meso, mesoconelet; pr1 and pr2, pretrite cusp of first and second plates from anterior end; po1 and po2, postrite cusp of first and second plates from mesial end; c, conelets; mc, mesial constriction; green dash line, median sulcus, B: measurement of lingual-buccal of each plate (in mm), C: occlusal view, and D: lingual view.
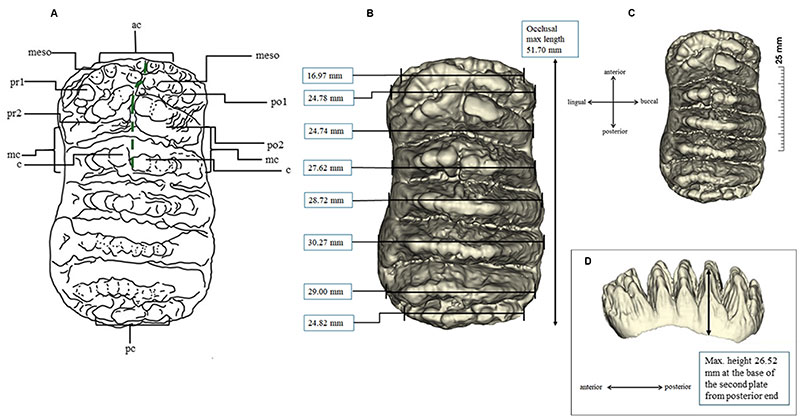
FIGURE 6. In situ and high-throughput μCT images of PRK_SC_P.01. A: lingual view, embedded in cave breccia before extraction. B: lingual view, after extraction but still embedded in matrix. C: the mesial end. D: lingual side in mirror image. E: the underneath view. F: buccal view in mirror image. G: occlusal view, and H: the distal end.
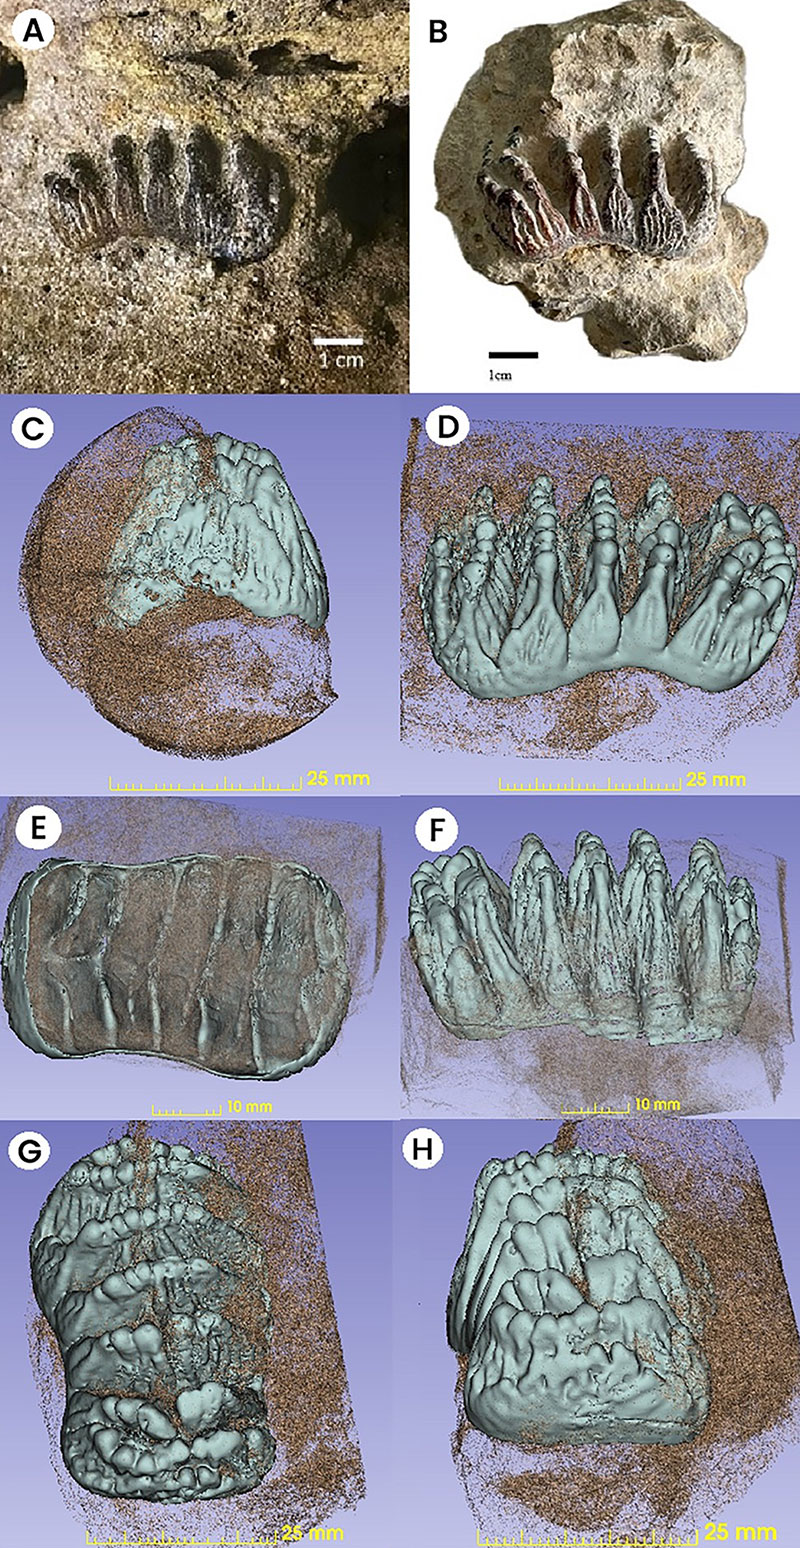
FIGURE 7. Fossil dp3 of Stegodon orientalis (KL DP3) from Keo Leng Cave in northern Vietnam. A: occlusal view, B: buccal view, and C: width measurement of lingual-buccal of each plate (in mm).
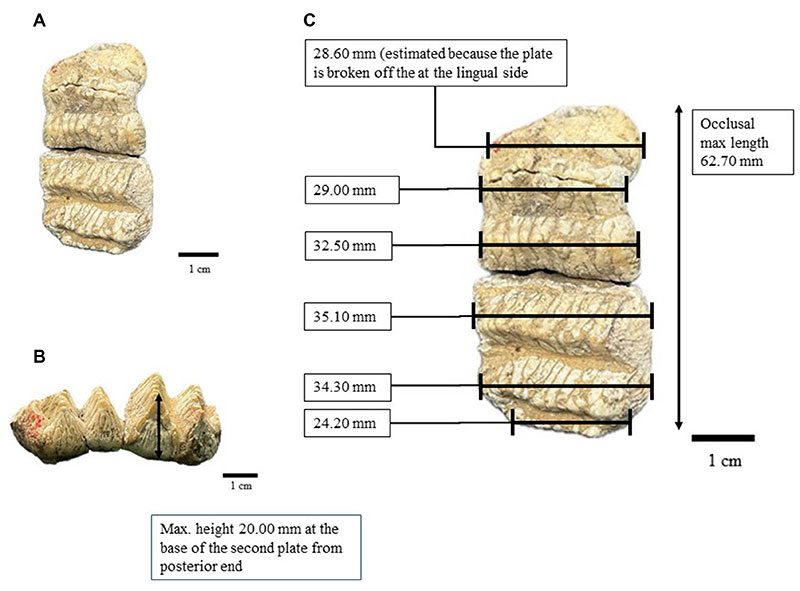
FIGURE 8. Fossil dp3 of Stegodon trigonocephalus (CD 11649) from Java, Indonesia: A: occlusal view, B: buccal view, and C: width measurement of lingual-buccal of each plate (in mm).
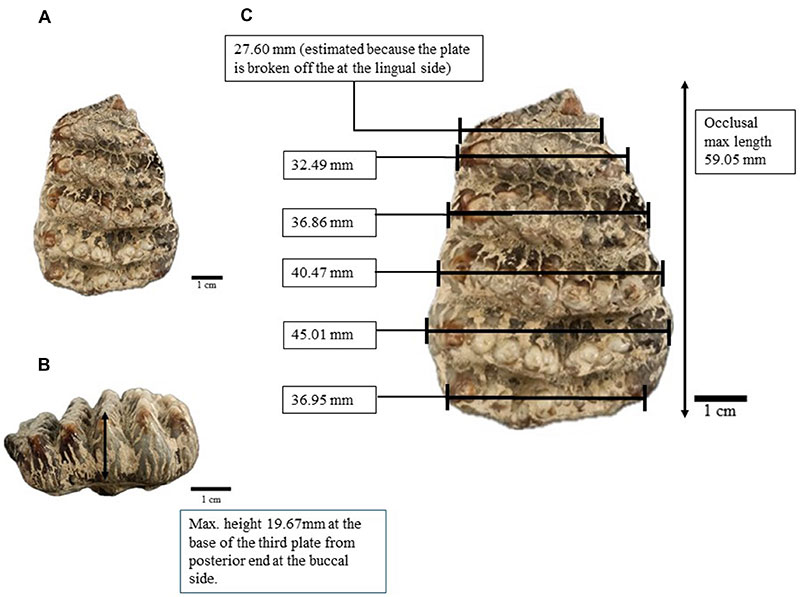
FIGURE 9. The resulting pIR-IRSL data from aliquots and grains of feldspars from the breccia matrix in the Stegodon Cave. A: shine down curve for single aliquot data including both the natural and regenerative dose, B: the dose response of the sample aliquot with a De of 675 ± 18 Gy, a recycling ratio of 1.04 ± 0.03 and a D0 of 1136 ± 139 Gy, C: the corresponding radial plot for this sample with an uncorrected CAM of 757 ± 34 Gy (n=12 aliquots), D: shine down curve for single grain data including both the natural and regenerative dose, E: the dose response of the single grain with a De of 422 ± 12 Gy, F: the corresponding radial plot for this sample with an uncorrected CAM of 679 ± 26 Gy (n=116 grains).
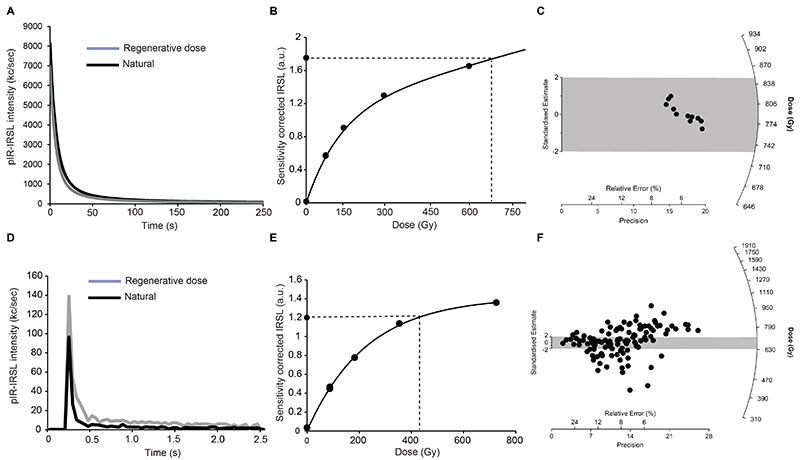
FIGURE 10. Illustration showing morphological differences between the dp3s. A: PRK_SC_P.01, B: S. orientalis, KL DP3, C: S. trigonocephalus, CD 11649.
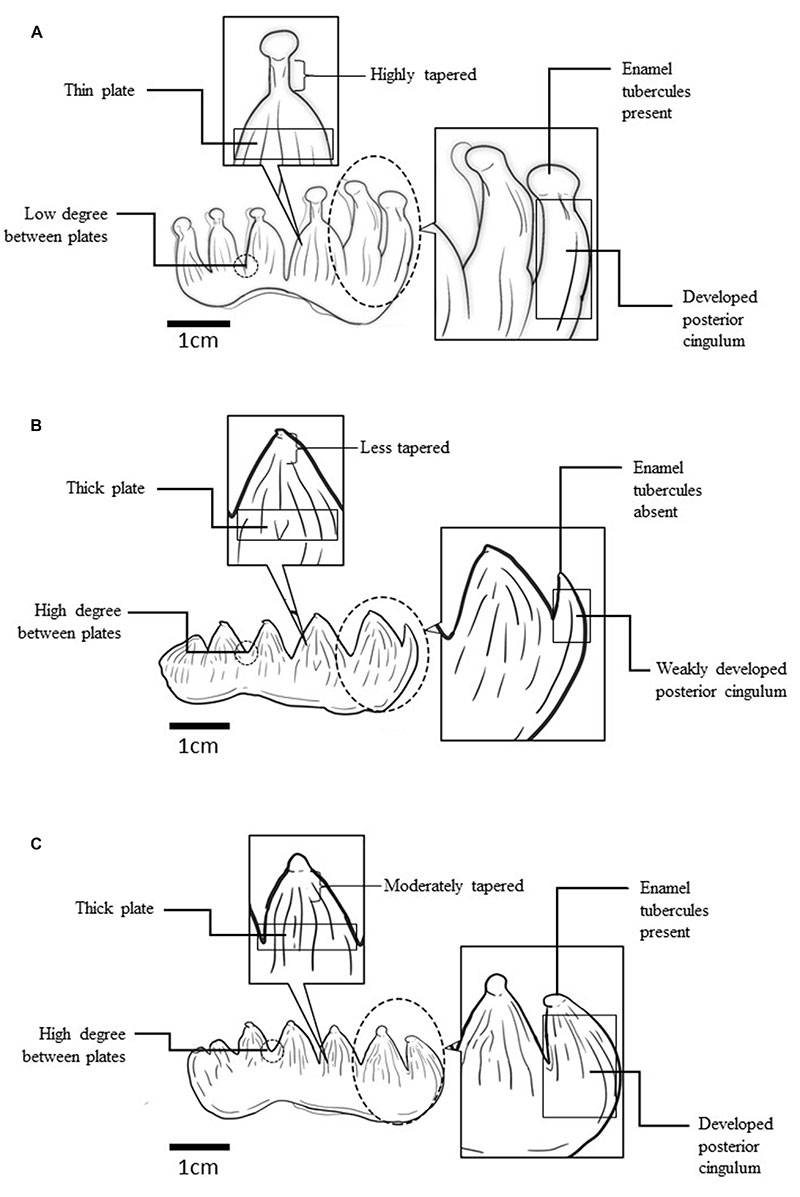
FIGURE 11. The lamellar frequency of dp3 from six different specimens. Four of the specimens from the genus Stegodon: PRK_SC_P.01 (Stegodon sp.); CD 11647a and CD 11647b from Java, Indonesia (S. trigonocephalus); KL DP3 from Keo Leng, Vietnam (S. orientalis). Values for the Asian elephant, Elephas maximus (ZRC 4.1669 LKCNHM) and Elephas hysudricus (CD 11702 from Java, Indonesia) was added for comparison. Source of data: CD 11647a and CD 11647b from Hooijer (1955).
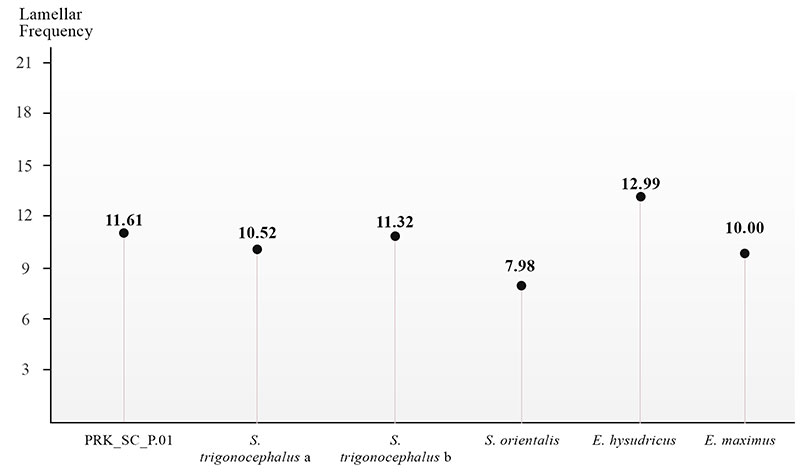
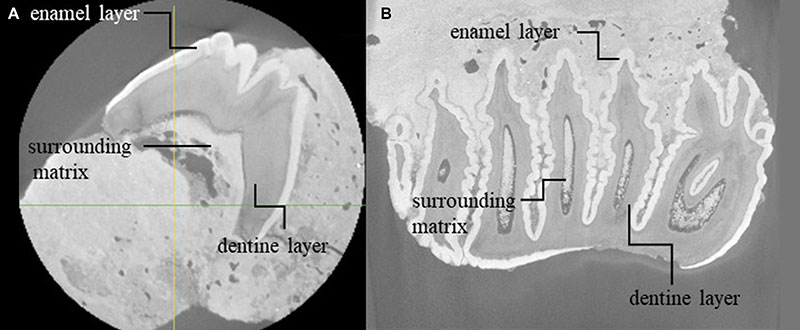
FIGURE 12. Cross-section μCT images of PRK_SC_P.01. A: mesial-distal view, B: occlusal-root view, showing the inner layers of the tooth and surrounding matrix.