FIGURE 1. Lower toothrows in lateral view of (A) extant dasyurid marsupial Sminthopsis, (B) extinct hyaenodont Hyaenodon crucians, (C) extinct canid Hesperocyon gregarious. Brackets mark molar teeth, red teeth mark potential carnassials. Modified after van Valkenburgh (2007).
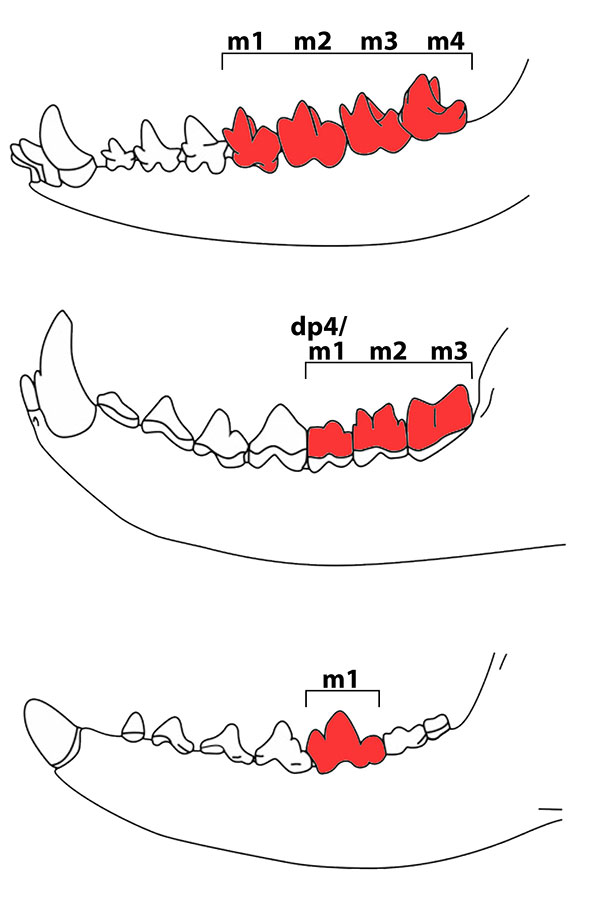
FIGURE 2. Occlusal view of sinistral upper dP4 and lower m1 of Lesmesodon edingeri (sinistral) with the most important structures marked. Nomenclature follows Rich (1981). Scale bar equals 1 mm.
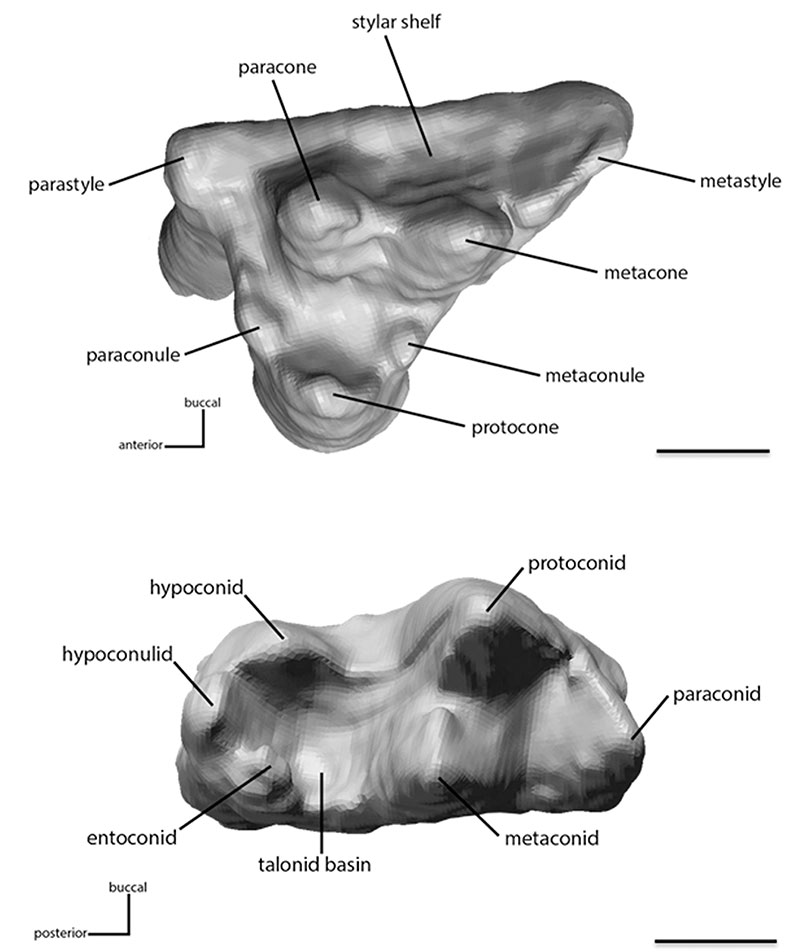
FIGURE 3. Exemplary representation of how the Cutting-Edge-Index (CEI) is calculated. Measurements are taken in PolyWorks during the chewing cycle, for the active (red line) and the complete (blue lines) edge of the paracristid. This length is then divided by the complete length of the respective tooth (yellow line). (A) anterobuccal view of the m1 of the paracone and protocone of Civettictis civetta, (B) Occlusal view of the m1 of C. civetta. Not to scale.
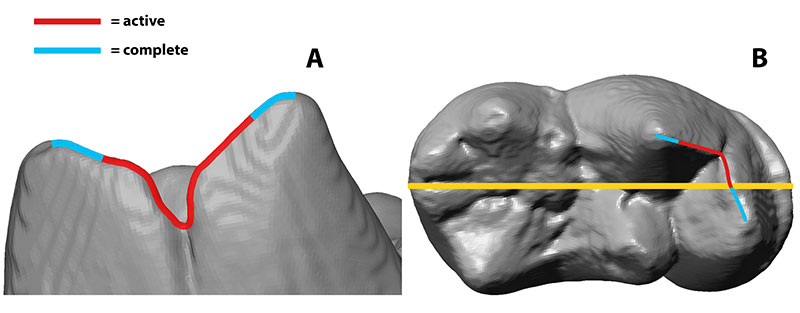
FIGURE 4. Chewing cycles of all compared species, calibrated to the point of maximum intercuspation. Lesmesodon edingeri and Proviverra typica show similar graphs and, including Dasyurus viverrinus, have their point maximum surface collision in the position of central occlusion. In every species phase I is noticeably longer than phase II.
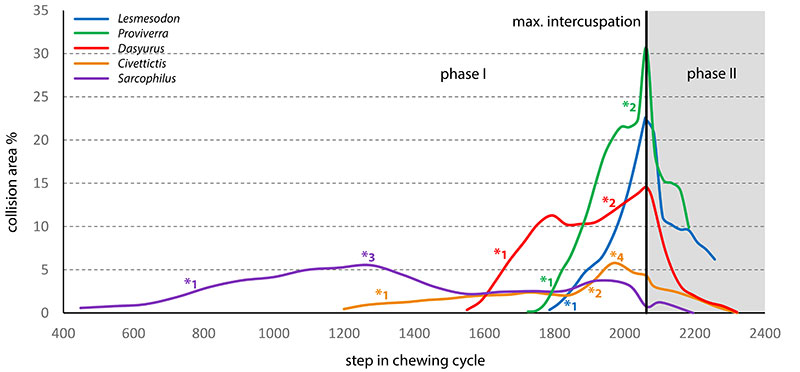
FIGURE 5. Collision areas (CA) of Lesmesodon edingeri (HLMD-Me 14590a) detected by the OFA - analysis for the three discussed main CAs 1 - 3 for the TP 1, TP2 complex. Lower molar is shown (from left to right) in anterobuccal view, occlusal view and posterolingual view. CA 1 shown in blue, CA 2 shown in orange and CA 3 shown in green. Scale bar equals 1 mm.
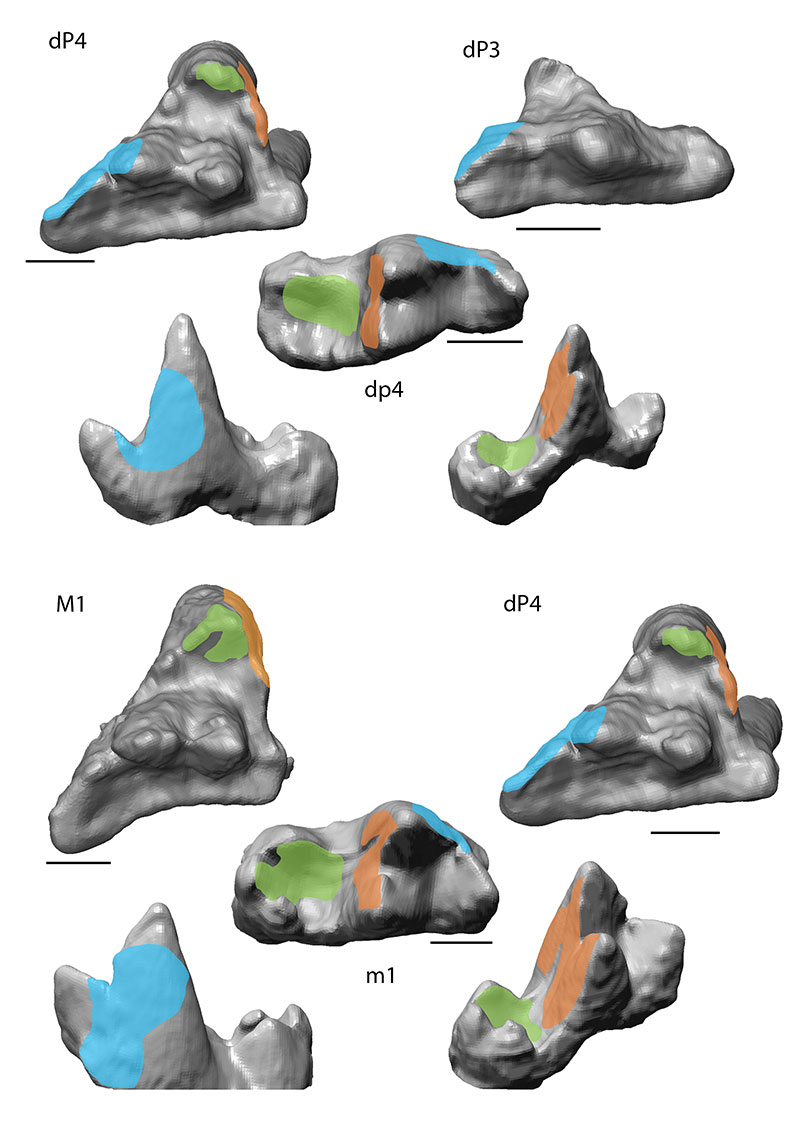
FIGURE 6. Collision areas (CA) of Proviverra typica (GMH LIX-49-1992) detected by the OFA - analysis for the three discussed main CAs 1 - 3 for the TP 1, TP2 complex. Lower molar is shown (from left to right) in anterobuccal view, occlusal view and posterolingual view. CA 1 shown in blue, CA 2 shown in orange and CA 3 shown in green. Scale bar equals 1 mm.
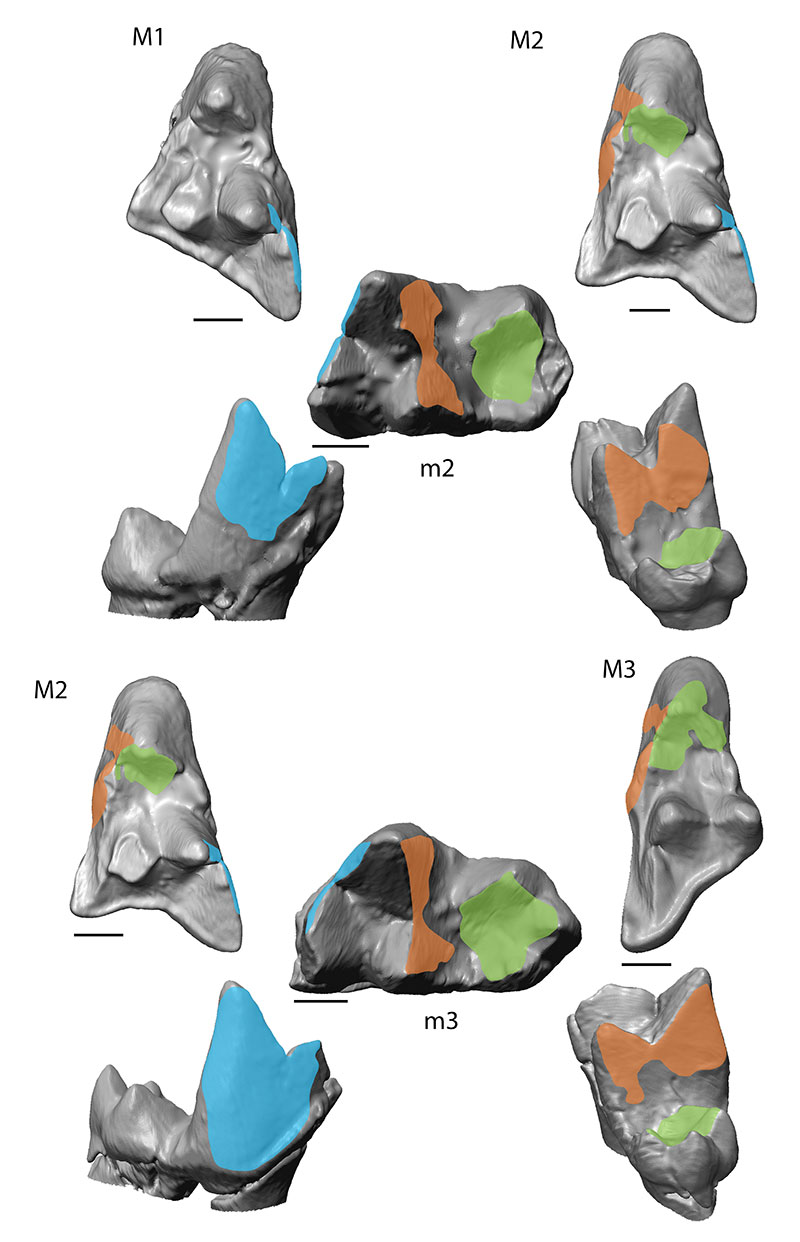
FIGURE 7. Collision areas (CA) of Dasyurus viverrinus (SMF_1480) detected by the OFA-analysis for the three discussed main CAs 1 - 3 for the TP 1, TP2 complex. Lower molar is shown (from left to right) in anterobuccal view, occlusal view and posterolingual view. CA 1 shown in blue, CA 2 shown in orange and CA 3 shown in green. Scale bar equals 1 mm.
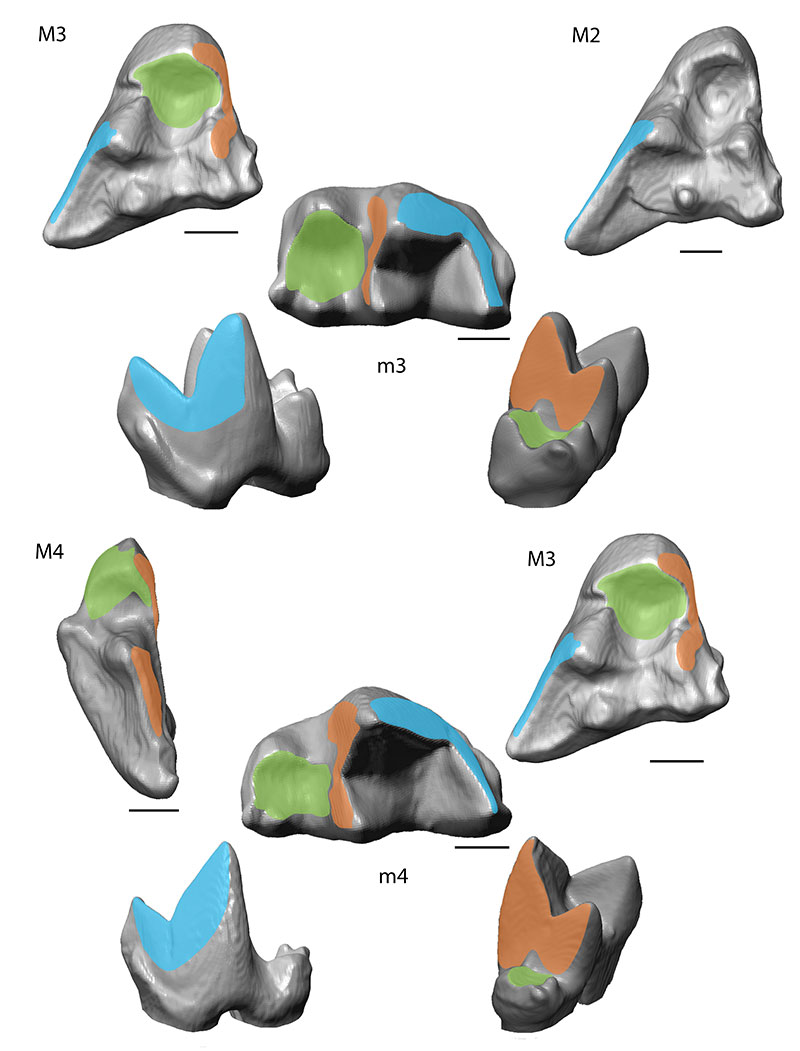
FIGURE 8. Collision areas (CA) of Sarcophilus harrisii (ZMB_Mam_002343) detected by the OFA - analysis for the three discussed main CAs 1 - 3 for the TP 1, TP2 complex. Lower molar is shown (from left to right) in anterobuccal view, occlusal view and posterolingual view. CA 1 shown in blue, CA 2 shown in orange and CA 3 shown in green. Scale bar equals 2 mm.
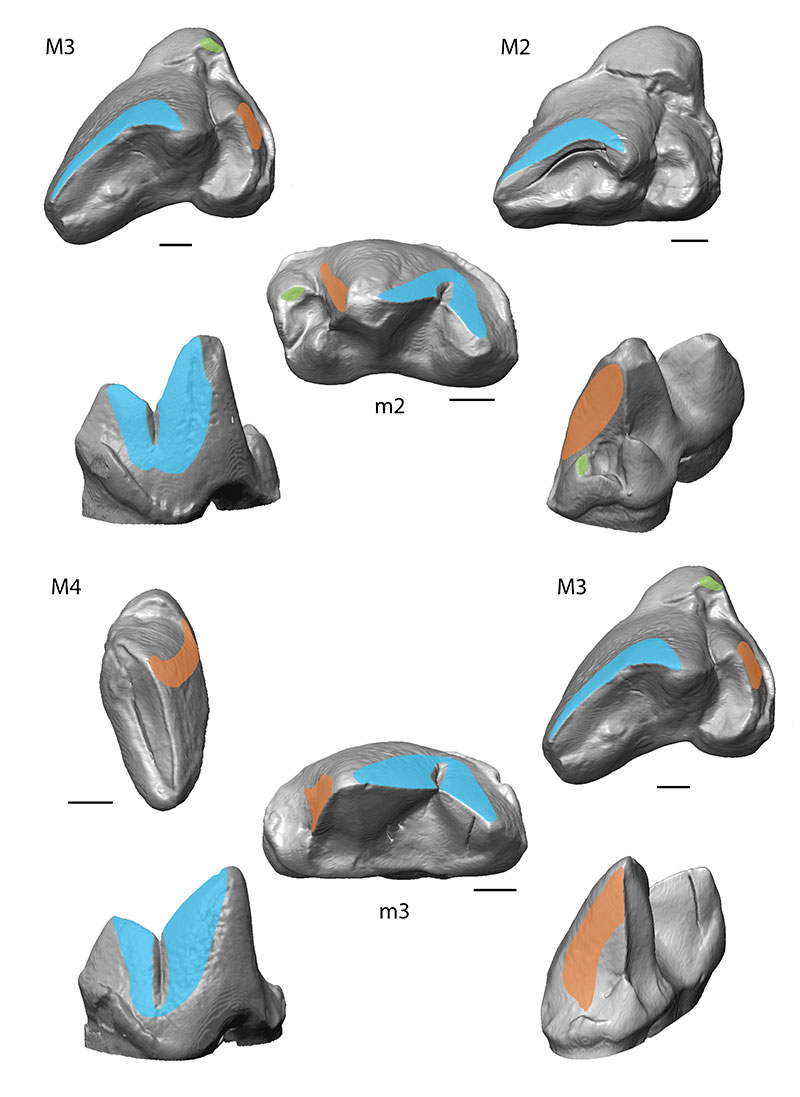
FIGURE 9. Collision areas (CA) of Civettictis civetta (ZFMK_1993_0705) detected by the OFA - analysis for the three discussed main CAs 1 - 3 for the TP 1, TP2 complex. Lower molar is shown (from left to right) in anterobuccal view, occlusal view and posterolingual view. CA 1 shown in blue, CA 2 shown in orange and CA 3 shown in green. Scale bar equals 2 mm.
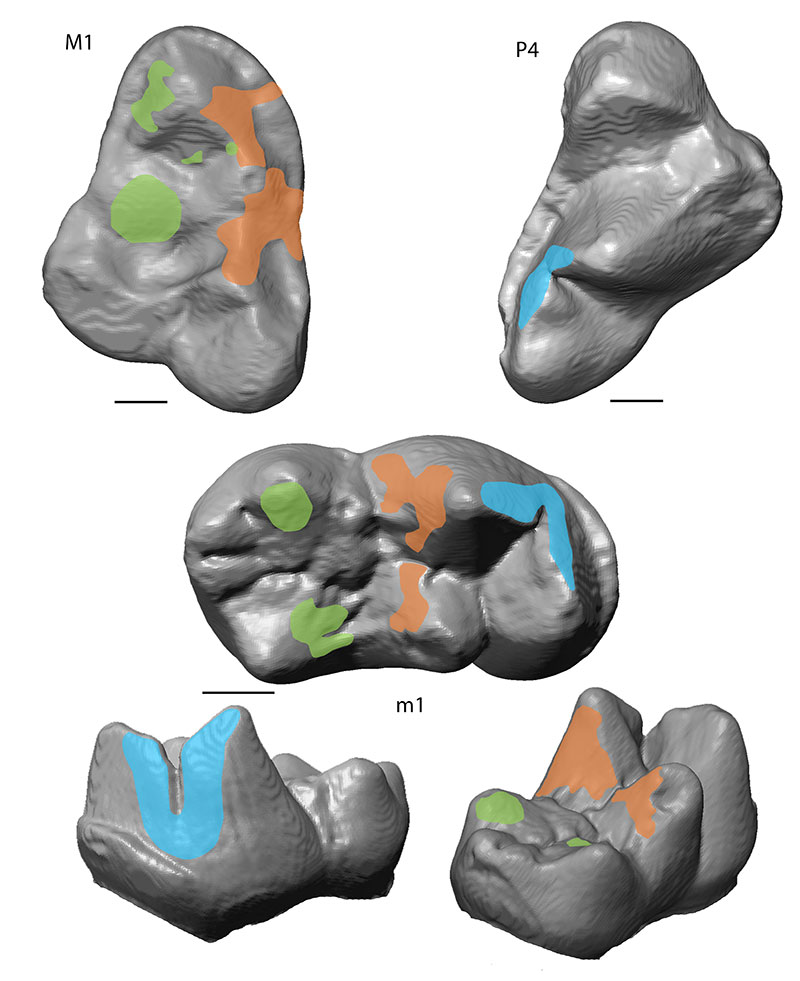
FIGURE 10. Single values for (A) Collision Area (CA) size and (B) Collision Area duration for each individual molar over the course of one single chewing cycle. The maximum CA size is in relation to the overall collision. TP 1 marks the first lower molar of each complex, TP 2 marks the second lower molar.
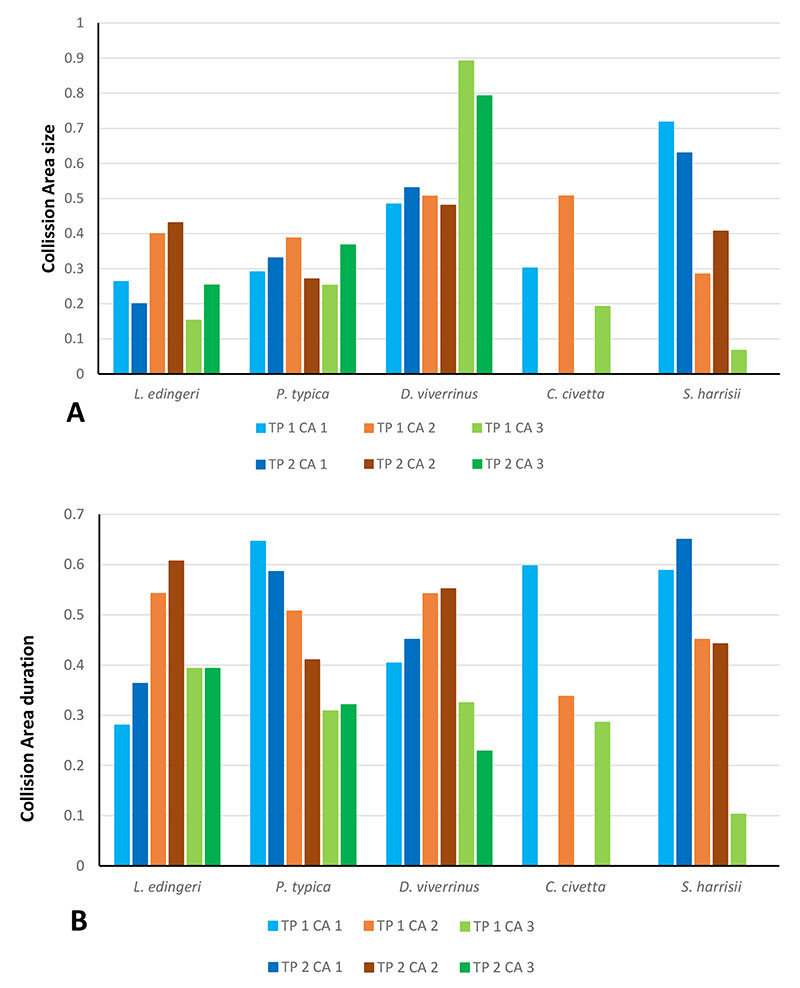
FIGURE 11. Combined percentage values for (A) Collision Area (CA) size and (B) CA duration over the course of one chewing cycle.
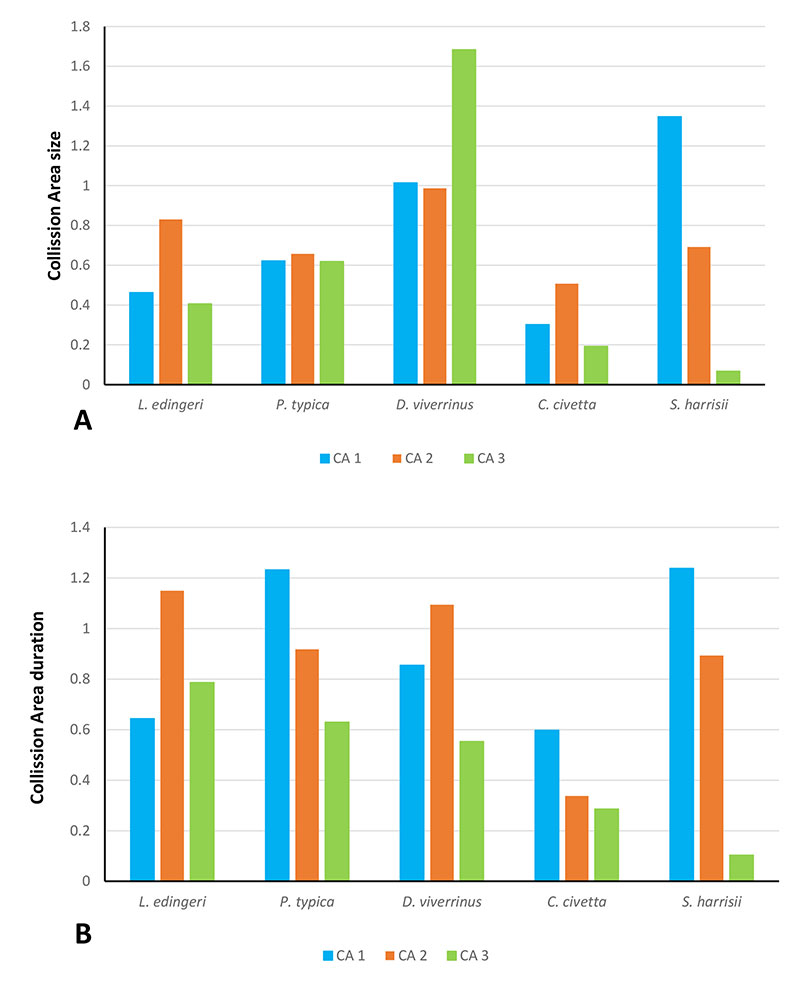
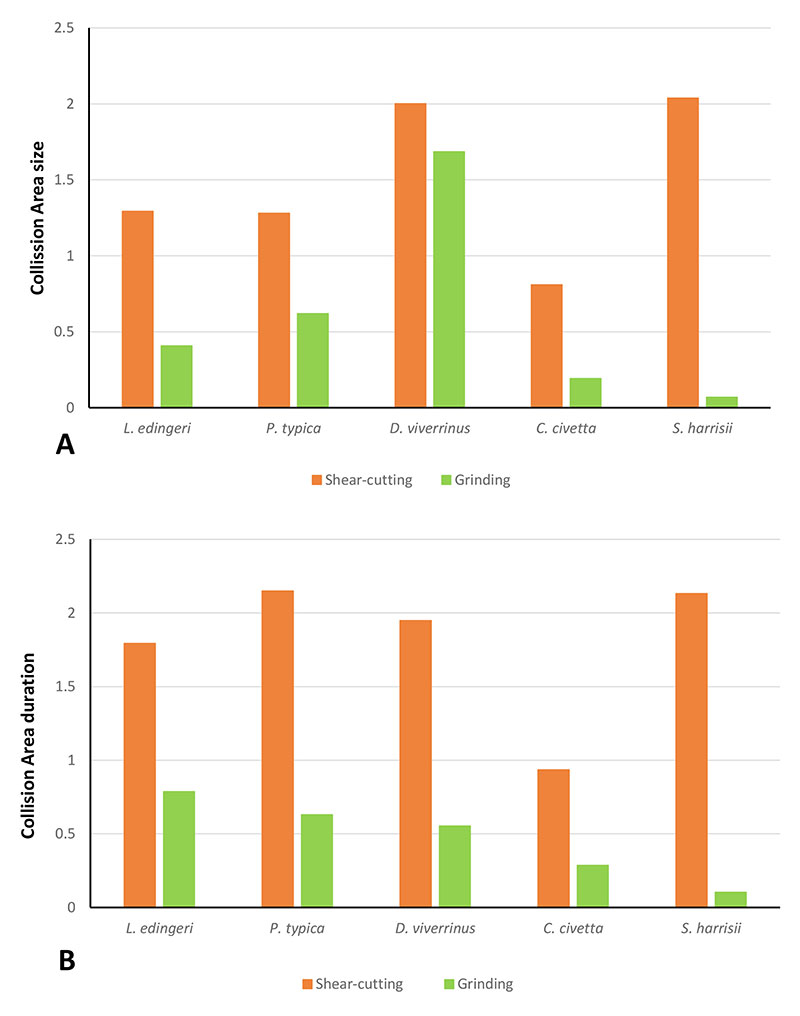
FIGURE 12. Combined values for single molar (A) Collision Area (CA) size and (B) Collision Area duration divided by their function. TP 1 marks the first lower molar in each complex, while TP 2 marks the second lower molar. Percentages for each Collision Area are added up and can therefore exceed the 100%.
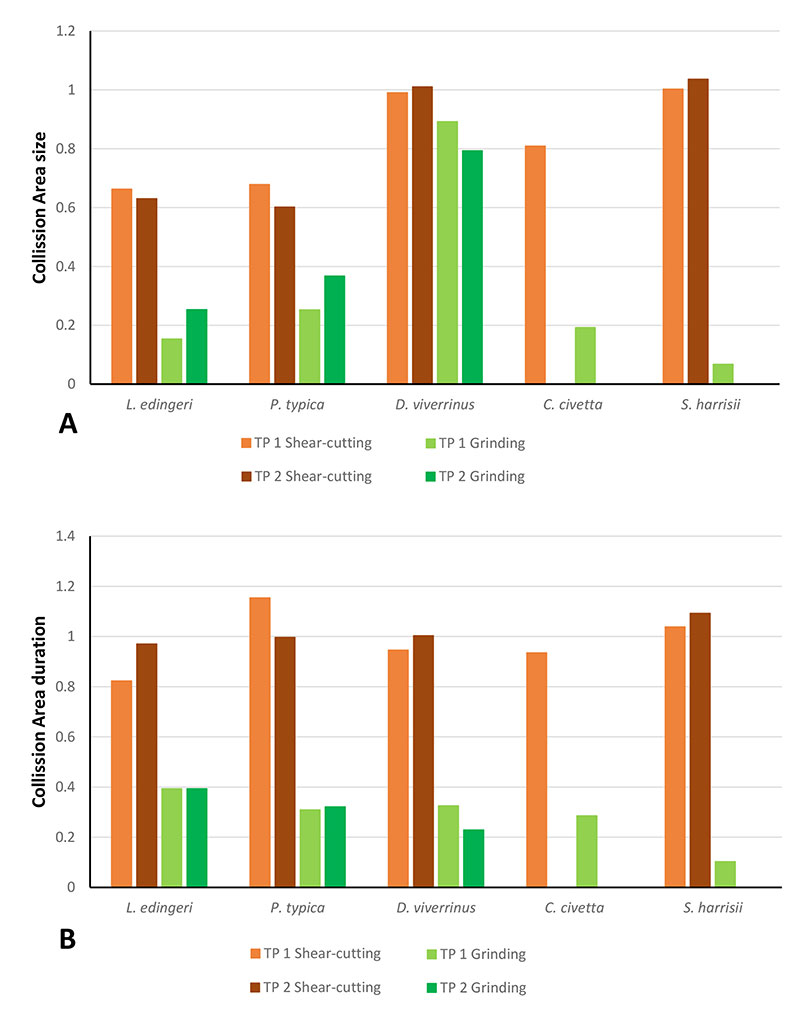
FIGURE 13. Combined values for both molars. Showing (A) Collision Area (CA) size and (B) Collision Area duration divided into their function. Percentages for each CA are combined and can therefore exceed 100%.