FIGURE 1. Oura megale n. gen n. sp. (YKLP 17237). A, photograph of ventral view. B, Fe map. C, composite line drawing. D, F1 map. E, P map. F, F1 map of head region. G, P map of head region. Abbreviations: l, left; r, right; A1, frontal appendage; ex.A6, exopod of 5th head limb on head segment 6; an, cephalic segment (n); as, anterior sclerite; cf, compactional fold; e, eye; es, eye stalk; exn, exopod (n); sn, sternite (n); Tn, thoracic exopod (n); tn, thoracic segment (n). Scale bars represent 20 mm.
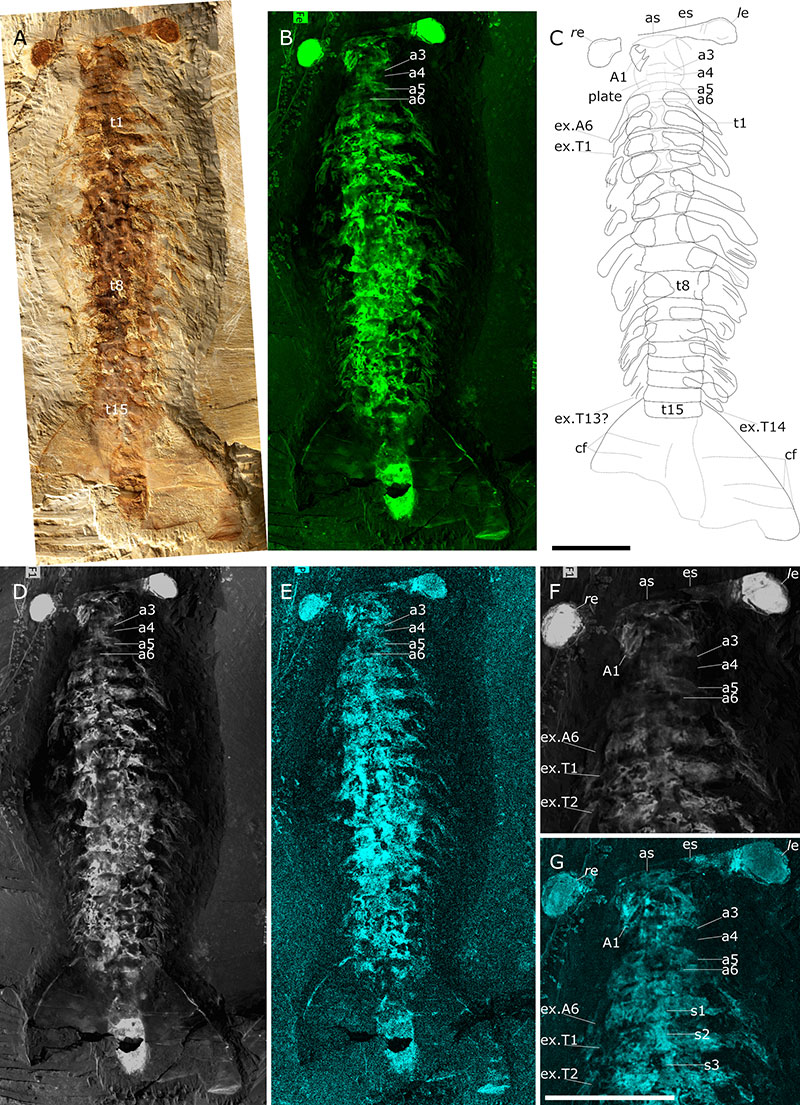
FIGURE 2. Oura megale n. gen n. sp. (YKLP 17237). A-G, Fe maps. B, head and anterior-most trunk region in A. C, head region in A. D, ex.T2 in A (see B for context). E-F, posterior thoracic region in A (right and left, respectively). G, posterior-most trunk region in A. Abbreviations: l, left; r, right; A1, frontal appendage; ex.A6, exopod of 5th head limb on head segment 6; an, cephalic segment (n); as, anterior sclerite; cf, compactional fold; e, eye; es, eye stalk; exn, exopod (n); la, lamella (of exopods); pn, podomere (n) (of A1); Tn, thoracic exopod (n); tn, thoracic segment (n). Scale bars represent 10 mm (A-C, E-G); 5 mm (D).
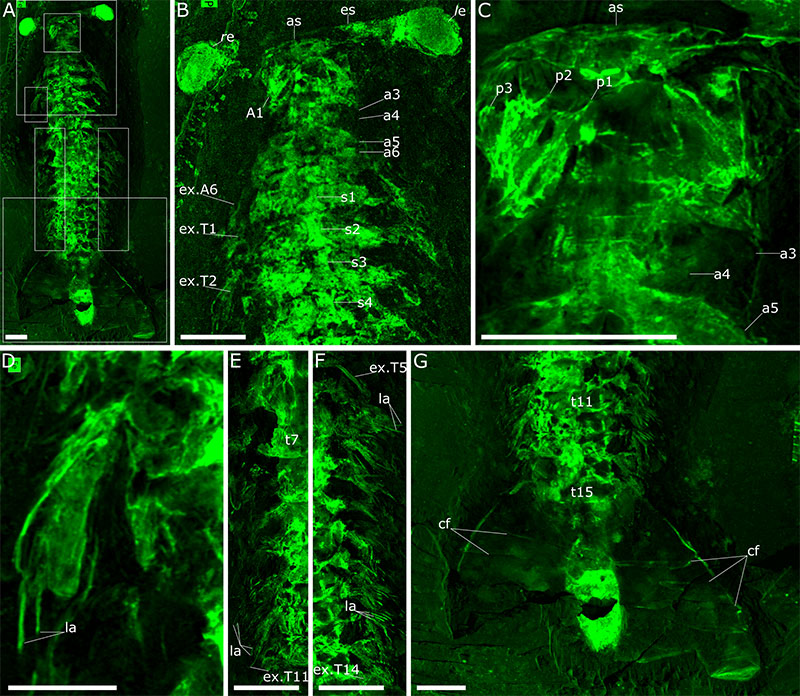
FIGURE 3. Tailpiece comparison. A, Anomalocaris canadensis Whiteaves 1892 based on Daley and Edgecombe (2014) and Sheppard et al. (2018). B, Oura megale n. gen. n. sp. C. Opabinia Budd, 1998 based on Legg and Vannier 2013. D, Kylinxia zhangi Zeng, Zhao and Huang in Zeng et al., 2020. E, Fengzhengia mamingae O’Flynn et al., 2022. F, Isoxys acutangulus Walcott, 1908 based on Legg and Vannier 2013. Scale bar represents 1 cm.
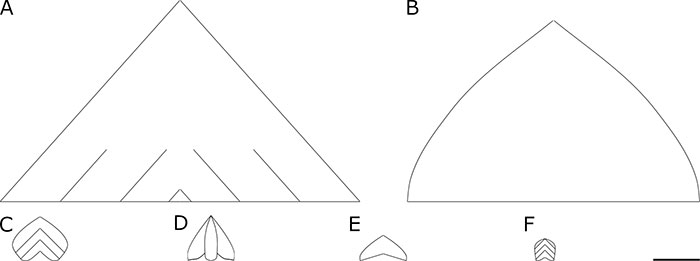
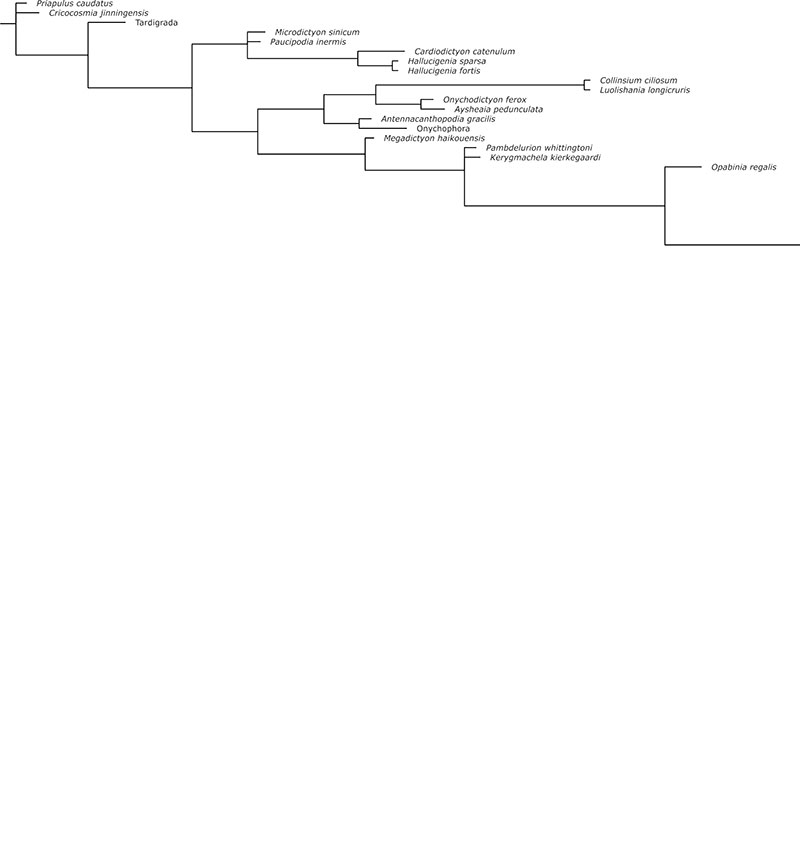
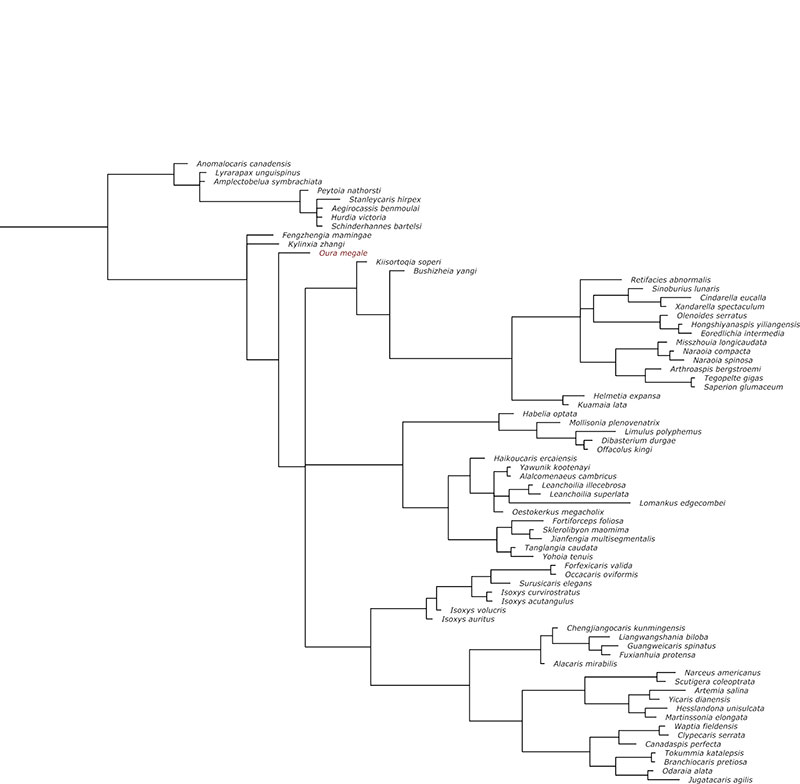
FIGURE 4. Consensus tree from phylogenetic analysis of panarthropod relationships based on a matrix of 283 characters and 88 taxa. Strict consensus of 368 most parsimonious trees with a score of 758 (consistency index = 0.45; retention index = 0.85) from analysis using equal weighting.
FIGURE 5. Consensus tree from phylogenetic analysis of panarthropod relationships based on a matrix of 283 characters and 88 taxa. Strict consensus of 3 most parsimonious trees with a score of 59.56497 (consistency index = 0.44; retention index = 0.84) from analysis using implied (concavity constant k = 3) weighting.
FIGURE 6. Consensus tree from phylogenetic analysis of panarthropod relationships based on matrix of 283 characters and 88 taxa. 50% majority-rule consensus tree from a Bayesian analysis.
This figure is extremely wide and has been cut vertically to make it easier to see. Click here to download an uncut version of the file.