FIGURE 1. Spatiotemporal distribution of fossil occurrences. Note that these records reflect only the fossil occurrences of Cyprideidae considered in this study, not the full set of known fossil records (i.e., occurrences with ambiguous identifications or from non-focal localities, such as East Asia, were excluded). The midpoint age of each fossil occurrence was used to assign it to a time bin. Maps were adopted from Kocsis and Scotese (2021).
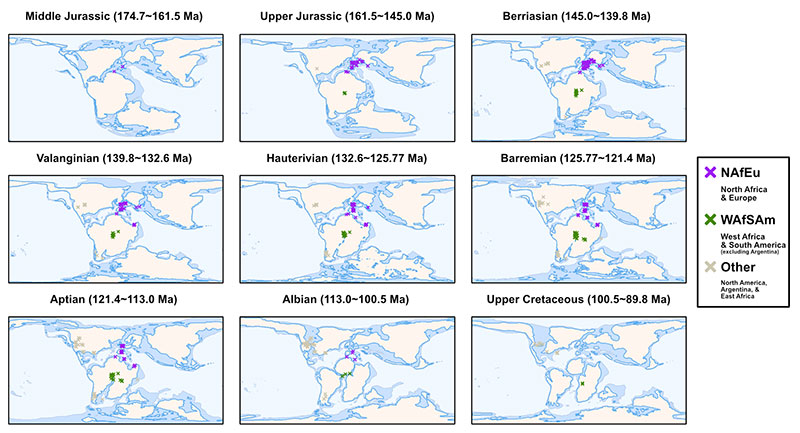
FIGURE 2. PyRate results for the a. spatially standardized and b. unstandardized NAfEu dataset. Blue and red lines represent speciation and extinction rates, respectively, with shaded areas indicating their 95% credible intervals. The bar plots in the background show the sampling frequencies for rate shifts over time. Two horizontal dashed lines indicate thresholds for positive evidence (log Bayes factor = 2) and strong evidence (log Bayes factor = 6) of a rate shift.
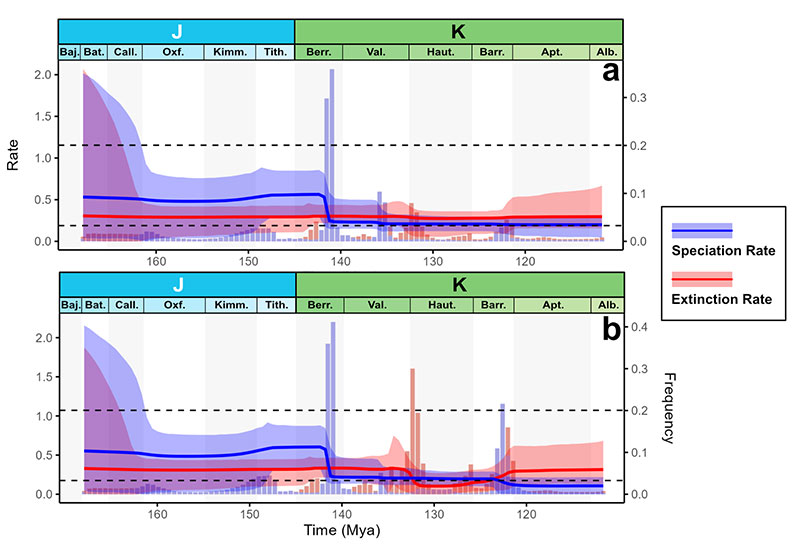
FIGURE 3. PyRate results for the a. spatially standardized and b. unstandardized WAfSAm dataset. Blue and red lines represent speciation and extinction rates, respectively, with shaded areas indicating their 95% credible intervals. The bar plots in the background show the sampling frequencies for rate shifts over time. Note that only one horizontal dashed line, corresponding to a log Bayes factor of 2, is shown in the plot.
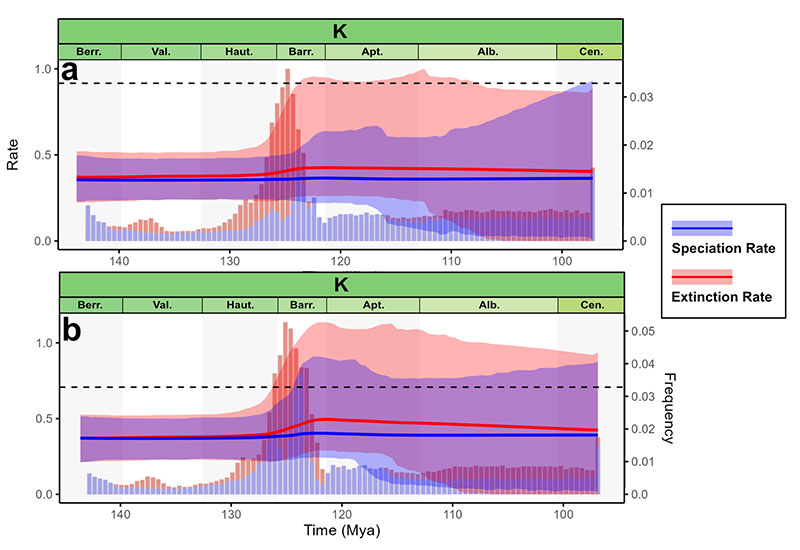
FIGURE 4. Diversification rates of the a. spatially standardized and b. unstandardized datasets. Purple: NAfEu, Green: WAfSAm. The y-axis range was restricted to -1.5 to 1.0 to improve visibility.
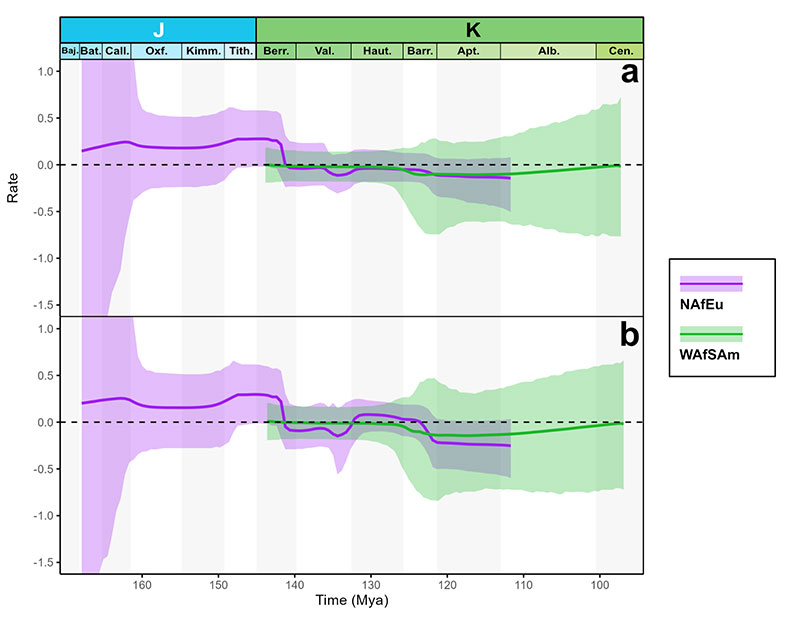
FIGURE 5. Results of the random synonymization analysis of the NAfEu dataset. Blue lines denote speciation rates and red lines denote extinction rates, with shaded areas indicating their 95% credible intervals.

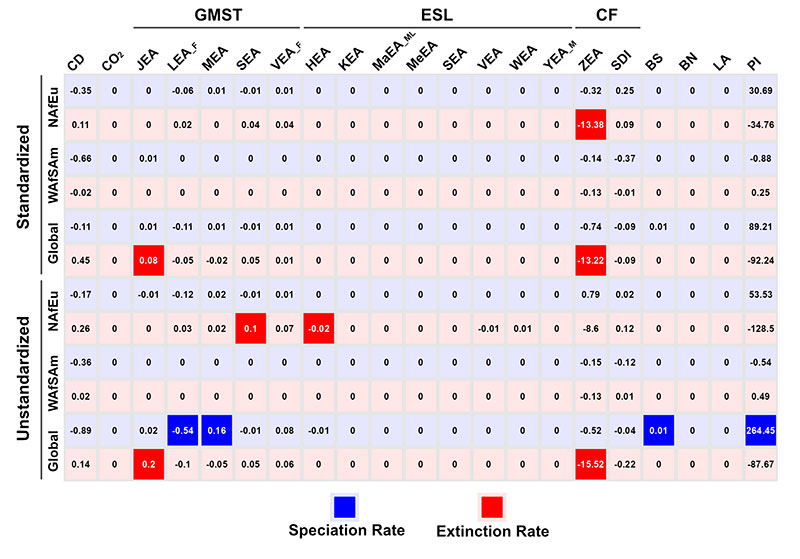
FIGURE 6. Results of the MBD analysis. Blue cells denote results for the speciation rates and red cells denote results for the extinction rates. Numbers within each cell represents correlation parameter. Cells with significant correlation (shrinkage weight) are highlighted. See Table 3 for explanation of the variable names.