

FIGURE S1. PyRate results for the a. spatially standardized and b. unstandardized Global dataset. Blue and red lines represent speciation and extinction rates, respectively, with shaded areas indicating their 95% credible intervals. The bar plots in the background show the sampling frequencies for rate shifts over time. Two horizontal dashed lines indicate thresholds for positive evidence (log Bayes factor = 2) and strong evidence (log Bayes factor = 6) of a rate shift.
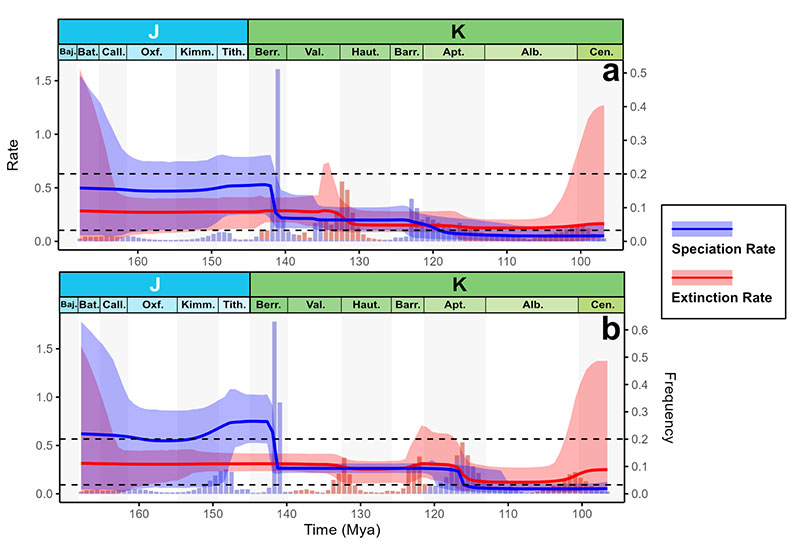
FIGURE S2. Results for the random synonymization analysis of the Global dataset. Blue lines denote speciation rates and red lines denote extinction rates, with shaded areas indicating their 95% credible intervals.

FIGURE S3. Results for the random synonymization analysis of the WAfSAm dataset. Blue lines denote speciation rates and red lines denote extinction rates, with shaded areas indicating their 95% credible intervals.

FIGURE S4. Pairwise Pearson correlation of the environmental variables considered in the current study.
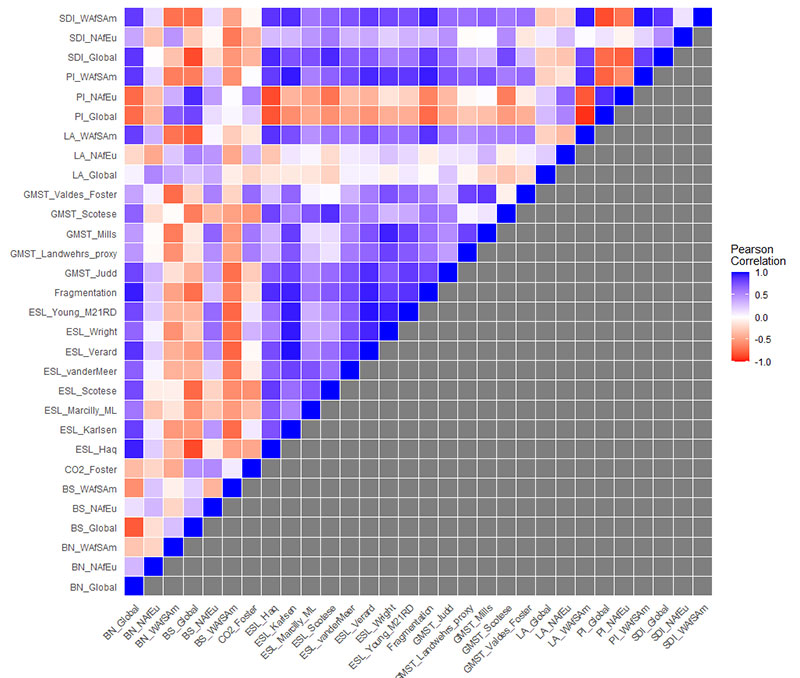
TABLE S1. A list of fossil occurrences, including their locality, paleocoordinates, and age (provided in a separate XLSX file). (Supplied as a downloadable spreadsheet.)
TABLE S2. Pearson and Spearman correlations and associated p -values between the shareholder quorum subsampling (SQS) curve and minimum spanning tree (MST) length, latitudinal and longitudinal range for the spatially standardized datasets.
| Pearson | Spearman | ||||
| Correlation | P-value | Correlation | P-value | ||
| Global | MST length | 0.363 | 0.189 | 0.524 | 0.098 |
| Latitudinal range | 0.175 | 0.339 | 0.192 | 0.325 | |
| Longitudinal range | 0.788 | 0.01 | 0.833 | 0.008 | |
| NAfEu | MST length | -0.102 | 0.576 | 0.232 | 0.329 |
| Latitudinal range | -0.233 | 0.671 | -0.143 | 0.643 | |
| Longitudinal range | 0.307 | 0.277 | 0.232 | 0.329 | |
| WAfSAm | MST length | 0.226 | 0.358 | -0.2 | 0.658 |
| Latitudinal range | 0.121 | 0.423 | 0.2 | 0.392 | |
| Longitudinal range | -0.17 | 0.608 | -0.308 | 0.693 | |
TABLE S3. Pearson and Spearman correlations and associated p -values between the shareholder quorum subsampling (SQS) curve and minimum spanning tree (MST) length, latitudinal and longitudinal range for the unstandardized datasets.
| Pearson | Spearman | ||||
| Correlation | P-value | Correlation | P-value | ||
| Global | MST length | 0.87 | 0.003 | 0.905 | 0.002 |
| Latitudinal range | 0.546 | 0.081 | 0.527 | 0.09 | |
| Longitudinal range | 0.78 | 0.011 | 0.81 | 0.011 | |
| NAfEu | MST length | 0.371 | 0.234 | 0.314 | 0.282 |
| Latitudinal range | 0.087 | 0.435 | -0.143 | 0.643 | |
| Longitudinal range | 0.186 | 0.362 | 0.232 | 0.329 | |
| WAfSAm | MST length | -0.205 | 0.63 | -0.3 | 0.742 |
| Latitudinal range | 0.295 | 0.315 | 0.41 | 0.246 | |
| Longitudinal range | -0.089 | 0.557 | -0.205 | 0.63 | |
