FIGURE ST2- 1. Power regression of coastline length by land area.
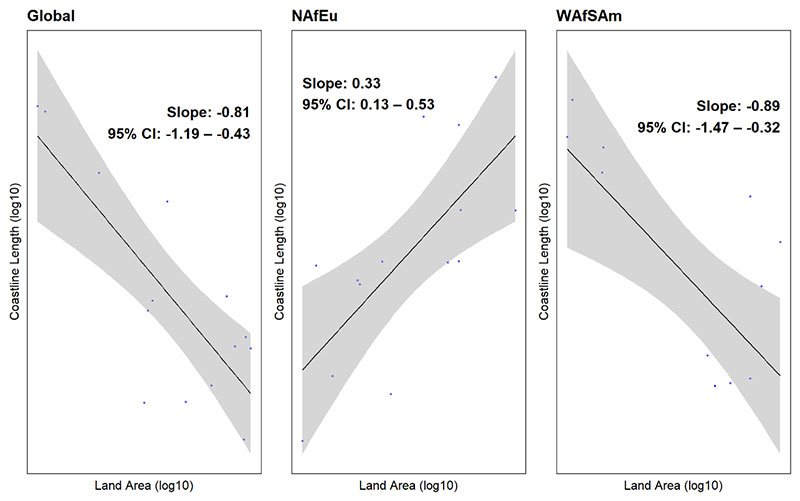
FIGURE ST3-1. Heatmap of the mean size of the largest connected component.
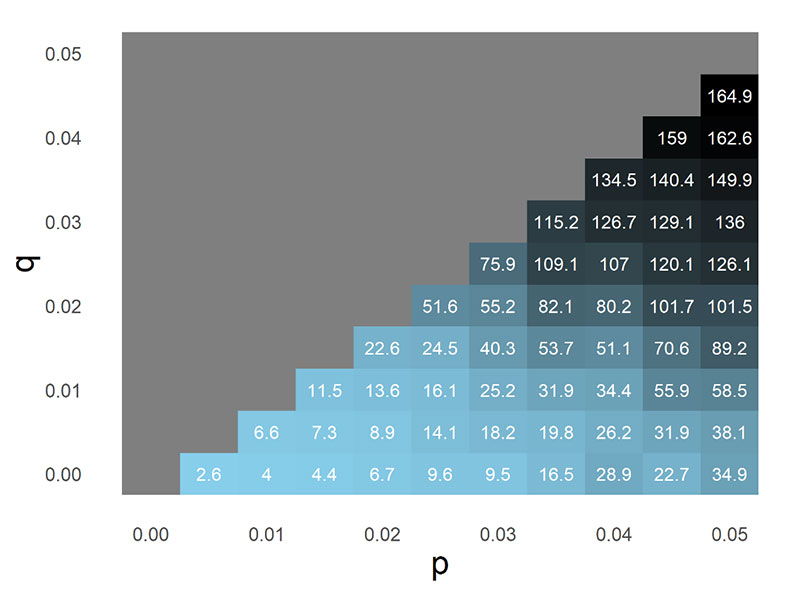
FIGURE ST3-2. Heatmap of the mean number of species.
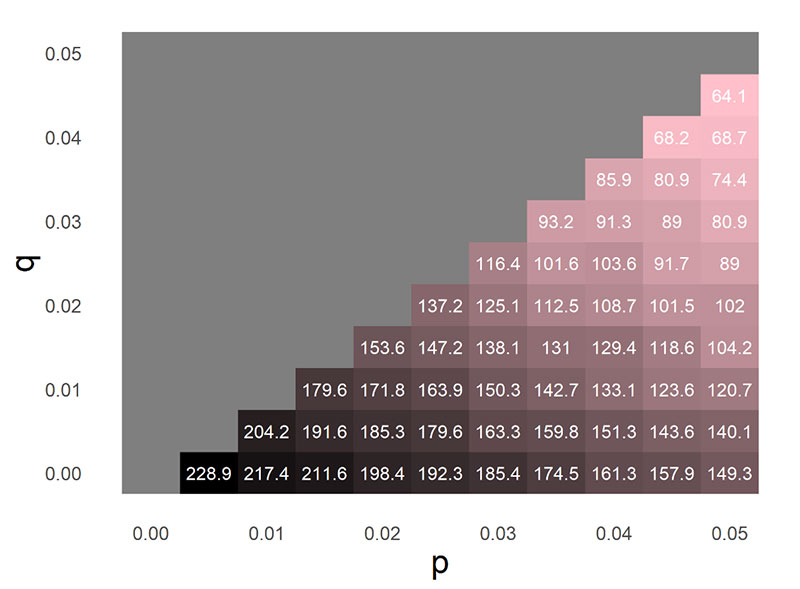
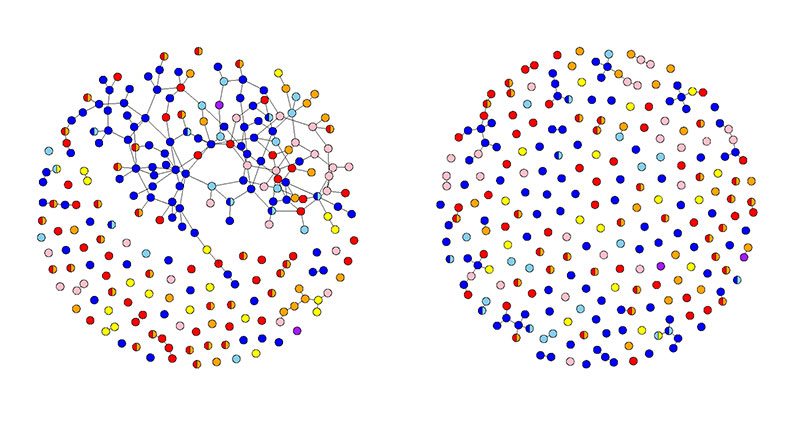
FIGURE ST3-3. Synonymizing scenarios under p = 0.05, q = 0.025 (left) and p = 0.02, q = 0.01 (right). Each vertex represents a species, and color represents its geographic distribution.