FIGURE 1. Box and whisker plots summarize how scan quality, measured using the contrast-to-noise ratio (CNR; Eq. 3), varies with (A) the exposure time, (B) the number of X-ray radiographs averaged per view, and (C) the overall scan time. There is no significant change in CNR with increased exposure time or number of X-ray radiographs averaged per view, however, CNR is significantly higher in scans of 50 minutes and longer than in scans of 49 minutes and shorter.
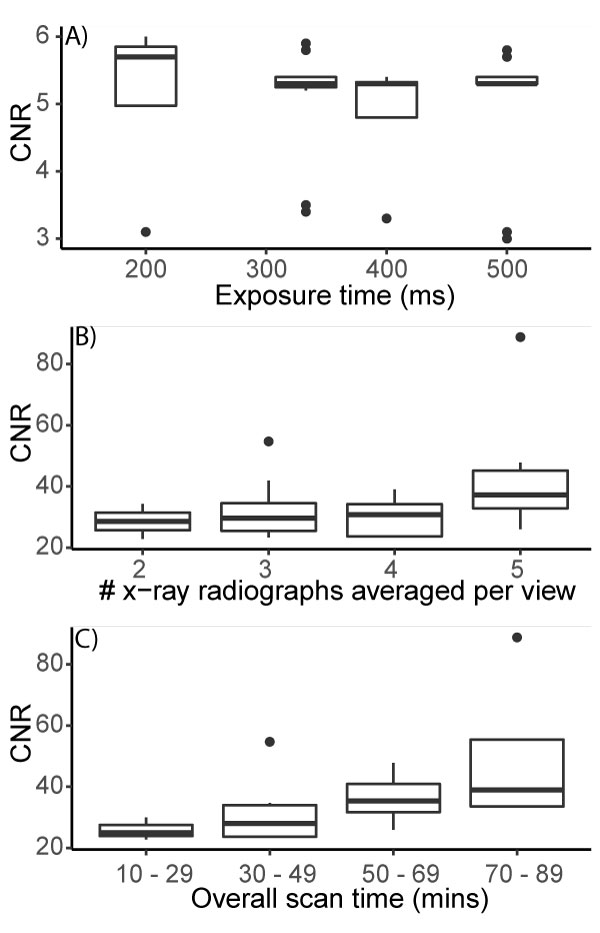
FIGURE 2. Stacked graphs from the scan parameter and repeatability experiments showing how calculated shell volume varied in the different scan trials (see Table 1 for details). Data points are coded by color for exposure time and by shape for the number of x-ray radiographs averaged per view. In both experiments, the calculated shell volume increases, and the variability decreases, as scan time increases (Table 2). Note, because the shell from the scan parameter broke during handing, two different shells were used for the two experiments, hence the difference in shell volumes.
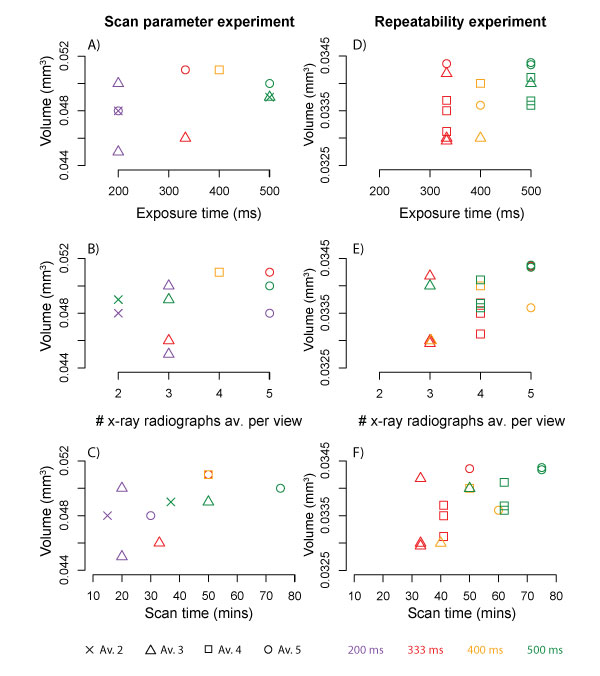
FIGURE 3. A schematic diagram of CT data (A) and slices of CT data collected as part of the scan parameter experiment (B-E). The presented data are sections through the central whorl of a shell of the pteropod Limacina retroversa. The green line in part 1 represents the boundaries of the shell material. The yellow box represents the same region on each scan. The white material is shell, the dark grey material is organic matter, and the black material is air. The difference among the three materials is clearer at the longer scan times (D and E) than the shorter scan times (B and C), making it easier to separate digitally and quantify the different materials.
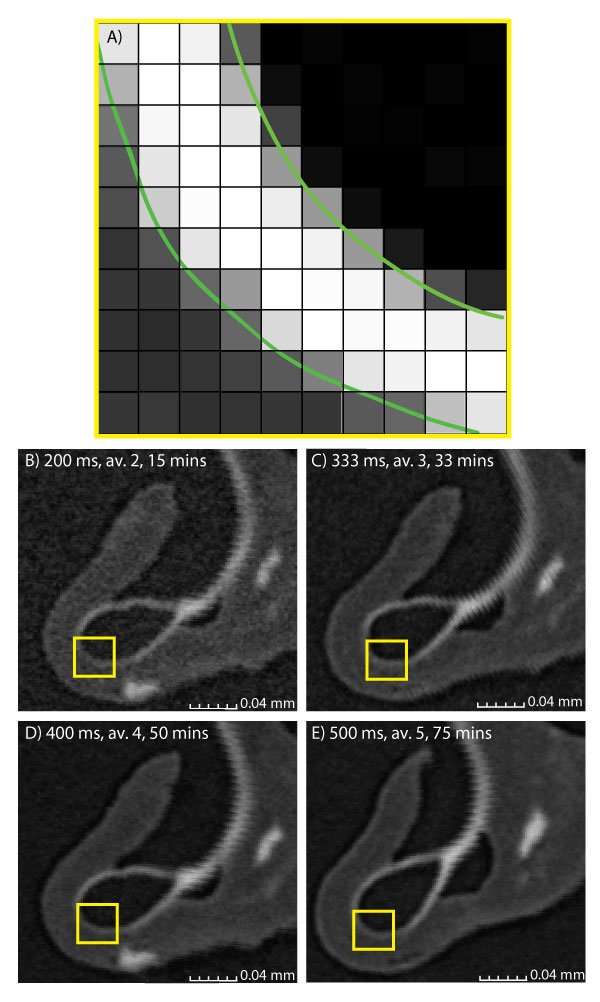
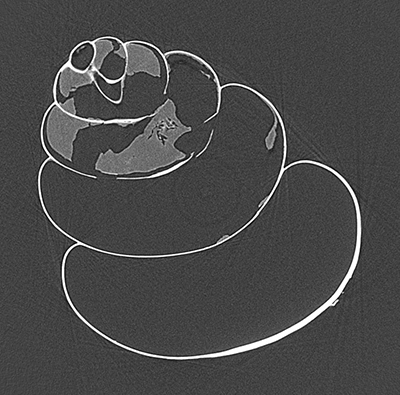
FIGURE 4. A video moving through slices of a pteropods shell scanned at 500 ms exposure time, with five x-ray radiographs averaged per view and an overall scan time of 75 minutes. There are streak artefacts perpendicular to the shell edge that are likely caused by beam hardening or shell movement during the scan. Click on image to run or download animation.