FIGURE 1. Geographic distribution and phylogenetic position of phytosaurs. 1A–Global distribution of phytosaur specimens from Middle and Late Triassic modified from Stocker and Butler (2013). Palaeomap from C. Scotese built into the Paleobiology Database for the Late Triassic (220 Ma) 1B–General cladogram of archosauromorphs that have been sampled for EM with the two possible positions of Phytosauria marked in red. Based on Heckert and Miller-Camp (2012) 1C–Locality map of specimens used in this study. North Carolina not to the same scale as western states. Locality numbers from NMMNH (western states) or NCSM (North Carolina).
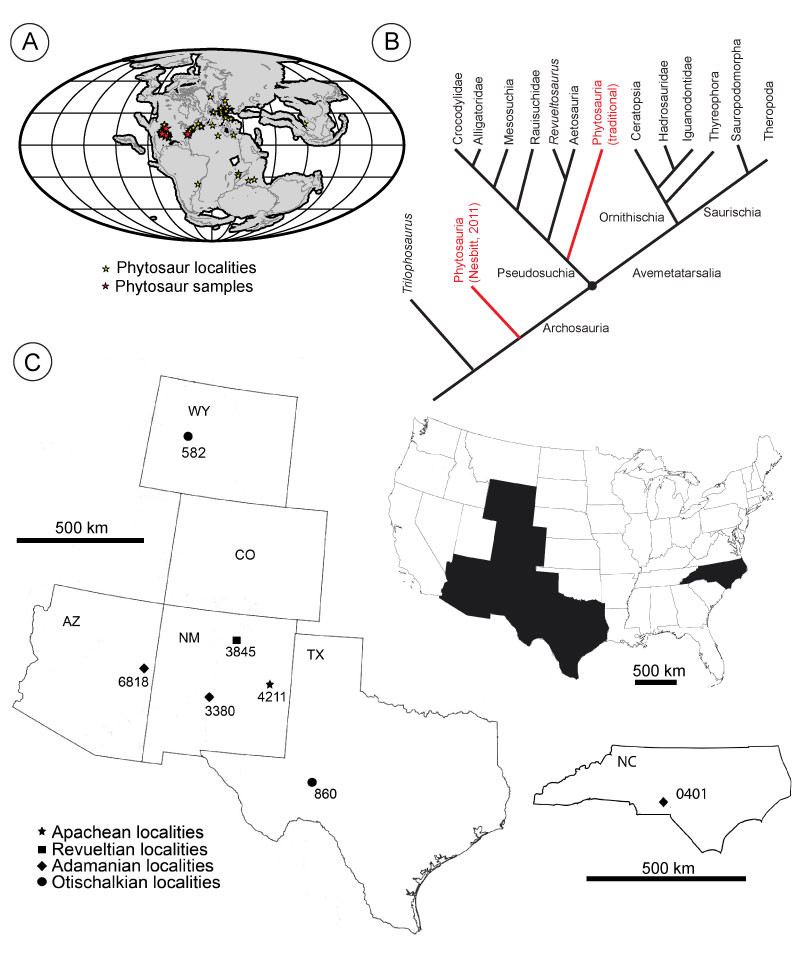
FIGURE 2. Classification and measurement of the teeth sampled here. 2A–Idealized drawings of heterodont phytosaur teeth following Hunt (1989; type C, U, I, B), Hungerbühler (2001; tip-of-snout, premaxillary, maxillary), and Datta et al. (2021; morphotypes IA, IB, IC, ID). 2B–Schematic of macro-morphological measurements taken on phytosaur teeth as preservation allowed. Measurements following the protocols of Smith (2005) with purple labels: CH–crown height, CBL–crown base length, AL–apical length, CA–crown angle (angle GAB), MA–mesial apical, MC–mesial mid-crown, and MB–mesial basal denticle densities, DA–distal apical, DC–distal mid-crown, and DB–distal basal denticle densities, with measurements new to this study in green: LAH–labial height, LIH–lingual height, and LLA–labio-lingual angle.
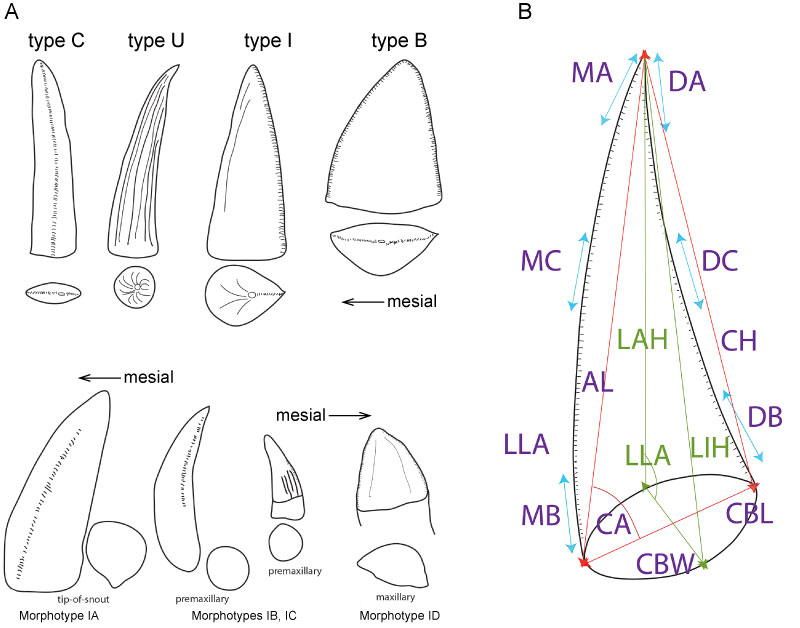
FIGURE 3. Generalized stratigraphic distribution of the phytosaur teeth sampled here (L-3380, L-3845, L-4211, L-6818, NCPALEO1902) and by Sander (1999; IPB E-2011, 2007I-III) compared to stratigraphic distribution of heterodont phytosaurs, North American biostratigraphy, and the standard global chronostratigraphic scale (SGCS). See text for details of the stratigraphy of each locality. Numerical age estimates draw on a variety of sources, including Heckert et al., 2009; Irmis et al., 2011; Ramezani et al., 2011; Whiteside et al., 2011. FAD = First appearance datum; L- = locality numbers for New Mexico Museum of Natural History and Science; LVF = Land-vertebrate faunachron (= “holochron”); NCPaleo = Locality for North Carolina Museum of Natural Sciences.
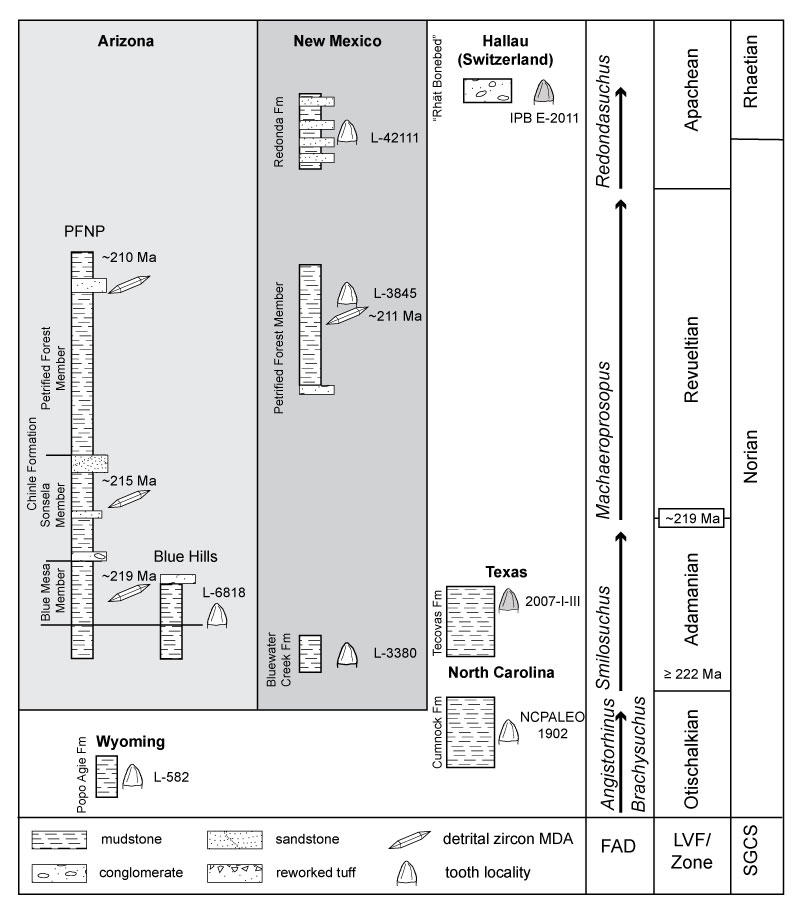
FIGURE 4. SEM captures of Angistorhinus teeth from the Popo Agie Formation of Wyoming. 4A–NMMNH P-36190 type I tooth, transverse section across a denticle; 4B–NMMNH P-36190 type I tooth tangential view of enamel, polygonal columnar enamel packages evident on lower half of image; 4C–NMMNH P-36190 type I tooth enamel from labial margin of tooth; 4D–NMMNH P-36190 type I tooth enamel from lingual margin of tooth; 4E–NMMNH P-36192 type B tooth enamel preserves thin columnar packages; 4F–NMMNH P-36191 type B tooth with a few faint LIGs near OES. All scale bars equal 50 µm.
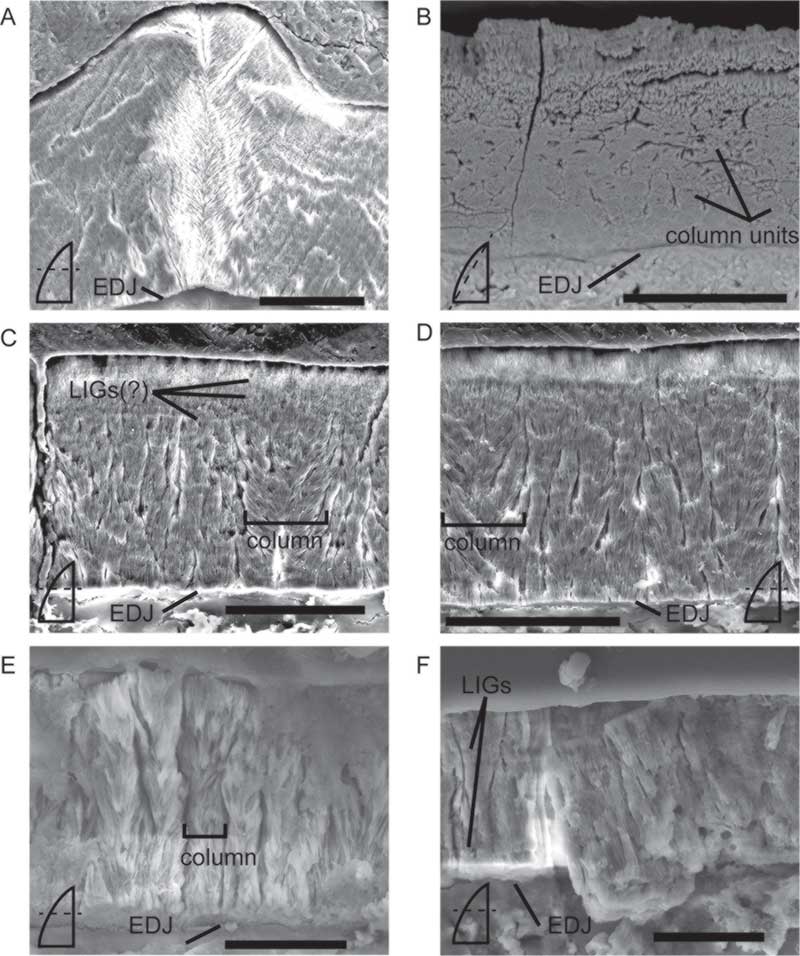
FIGURE 5. SEM captures of Smilosuchus teeth from the lower Chinle of New Mexico (4.1-2) and Arizona (4.3-6). 5A–NMMNH P-36146 type U tooth with well-developed columns; 5B–NMMNH P-36148 type B tooth in longitudinal view along the carina with faint LIGs in the inner half of the enamel; 5C–NMMNH 59648 type U tooth overview of transverse section showing the contributions of enamel and dentine to the fluting; 5D–NMMNH P-59648 type U tooth fluting along lingual surface; 5E–NMMNH P-59650 type B tooth along labial margin of enamel with well-developed columns; 5F–NMMNH P-59650 type B tooth along lingual margin of enamel. Scale bars for 5.1, 5.4-6 equal 50 µm, 5.2 scale bar equals 100 µm and 5.3 scale bar equals 2 mm.
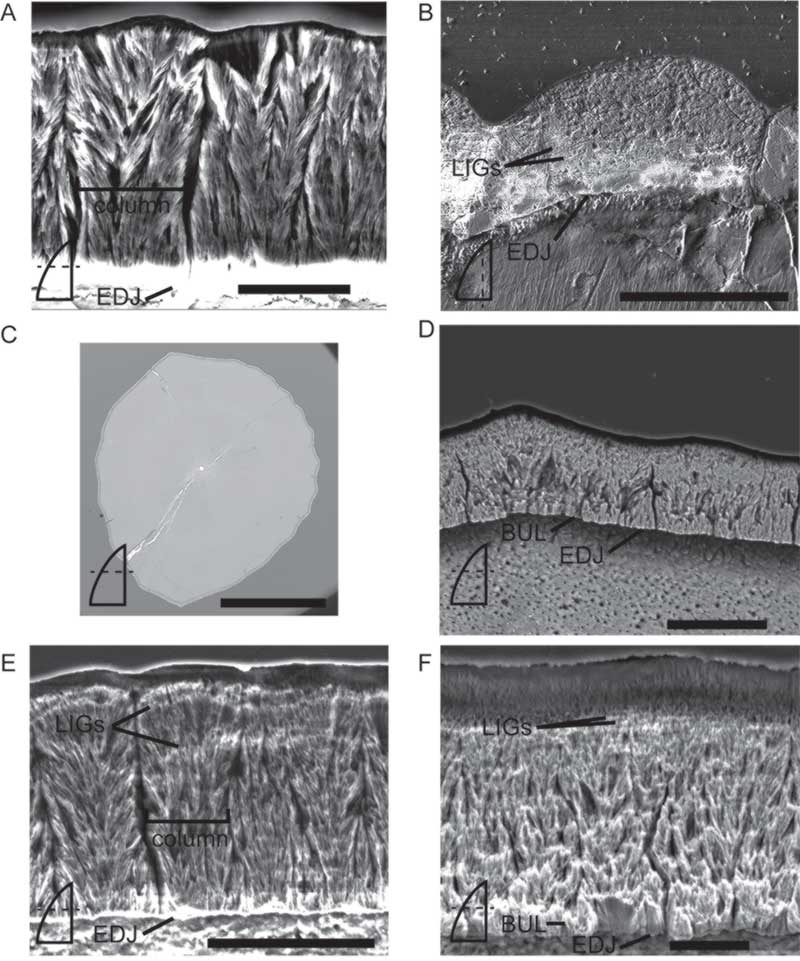
FIGURE 6. SEM captures of “Rutiodon” teeth. 6A–NCSM 23303 type B tooth in transverse section with well-developed columns along lingual margin and abundant LIGs; 6B–NCSM 23303 type B tooth in transverse section with well-developed columns along labial margin and abundant LIGs; 6C–NCSM 24322A type U tooth in tangential section showing polygonal columnar packages ~10 µm above EDJ with abundant LIGs; 6D– NCSM 24322B type U tooth in longitudinal section showing minimum thickness of enamel along posterior margin just above tooth base with abundant LIGs; 6E–NCSM 25043 type C? tooth in transverse section with thin (~10 µm wide) well-developed columnar enamel with abundant LIGs in outer half of enamel; 6F–NCSM 25075 type I tooth in transverse section of well-developed columnar enamel with abundant LIGs. All scale bars equal 50 µm.
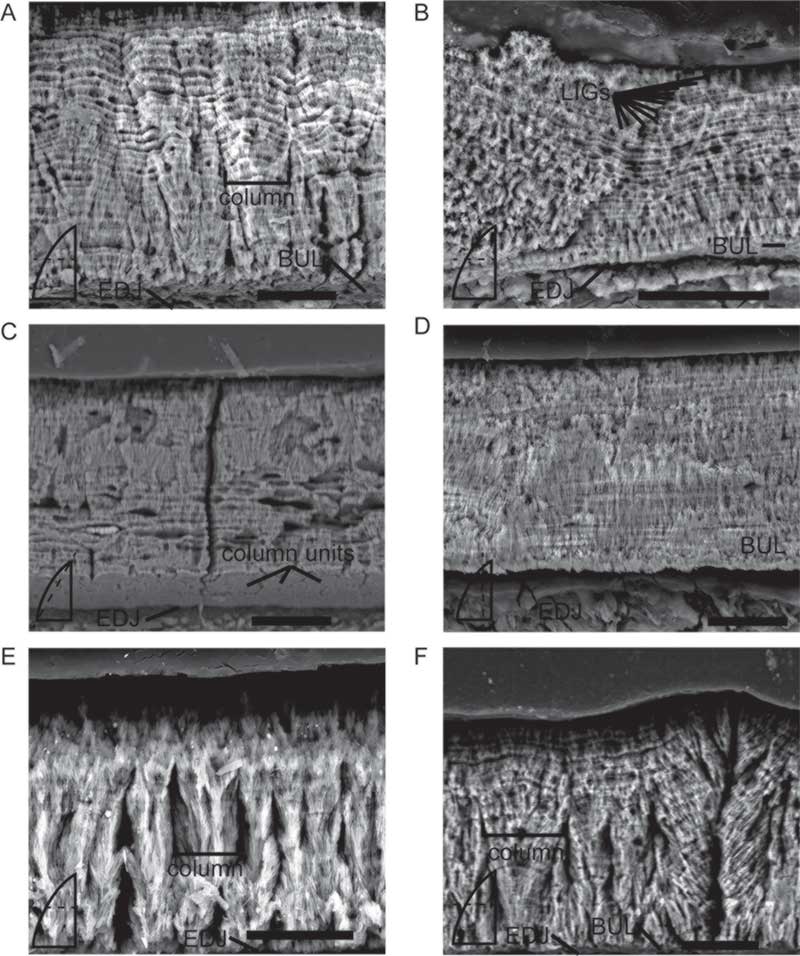
FIGURE 7. SEM captures of Machaeroprosopus teeth from the Petrified Forest Formation of New Mexico. 7A–NMMNH P-33103 type U tooth, overview of transverse cross-section; 7B–NMMNH P-33103 type U tooth with well-developed columns; 7C–NMMNH P-33103 type U tooth fluting with contribution solely from the enamel; 7D–NMMNH P-33105 type I tooth, overview of transverse cross-section; 7E–NMMNH P-33105 type I tooth denticle and maximum enamel thickness; 7F–NMMNH P-33105 type I tooth with well-developed columns. Both overview scale bars equal 2 mm. Enamel image scale bars equal 50 µm.
FIGURE 8. SEM captures of Redondasaurus teeth from the Redonda Formation of New Mexico. 8A–NMMNH P-36184 type I tooth in transverse section with poorly-developed LIGs near OES as well as a few more near the center; 8B–NMMNH P-36185 type I tooth in transverse section with well-developed columns along lingual margin; 8C–NMMNH P-36186 type B tooth in transverse section along labial margin; 8D–NMMNH P-36186 type B tooth in transverse section along lingual margin; 8E–NMMNH P-36186 type B tooth in transverse section with well-developed columns; 8F–NMMNH P-36186 type B tooth in tangential section with ~50 µm at bottom of enamel, just above enamel-dentine junction (EDJ) showing polygonal columnar packages. All scale bars equal 50 µm.
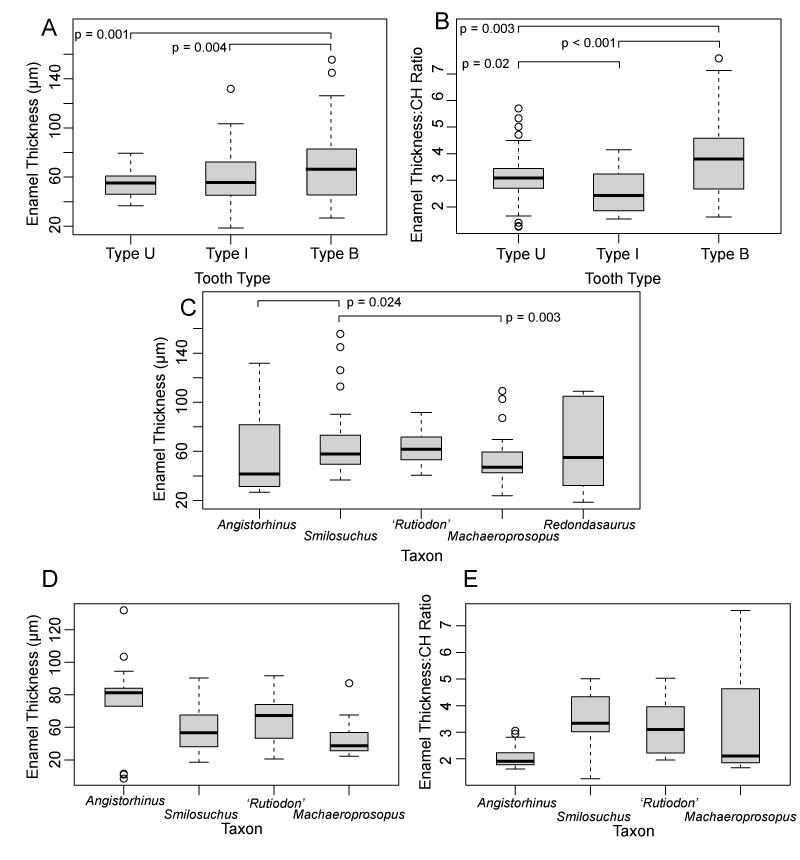
FIGURE 9. Boxplots of overall enamel thickness and enamel thickness to crown height ratio. Circles around boxplots represent outliers. 9A–Enamel thickness (μm) by tooth type. Type B teeth have the thickest enamel on average; 9B–Enamel thickness (μm) over crown height (mm) by tooth type. We included this ratio as a way to account for the overall size of teeth. Type B teeth have the thickest enamel on average, followed by type U; 9C–Enamel thickness (μm) of transverse sections by taxonomic assignment with stratigraphically oldest on the left of the plot,showing variation in enamel thickness but no chronological trend; 9D–Enamel thickness (μm) of transverse sections of type I teeth. When only considering type I teeth enamel thickness thins through time; 9E–Enamel thickness (μm) over crown height (mm) of transverse sections of type I teeth. When overall tooth size is accounted for, the opposite of Figure 9E is seen with typical enamel per mm height increasing through time.