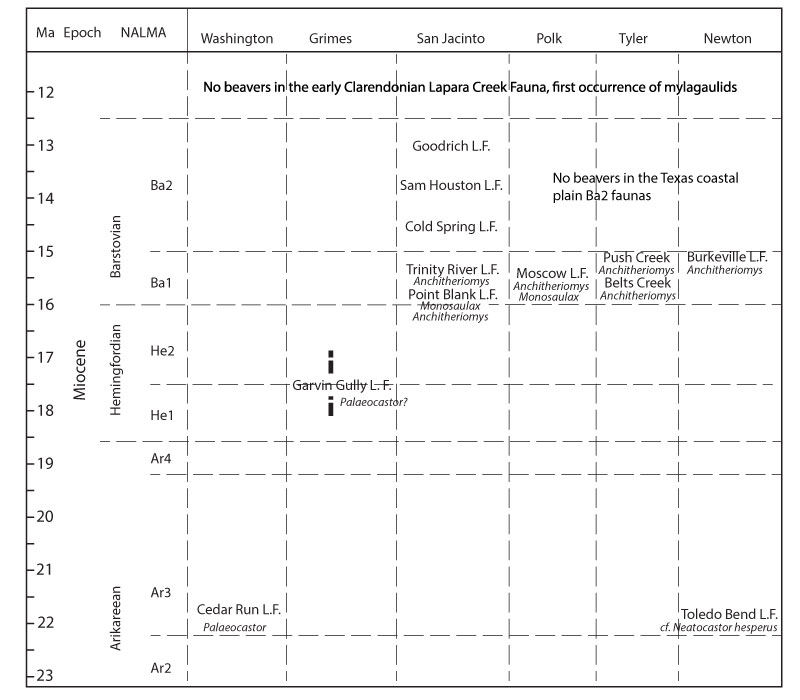
FIGURE 1. Miocene stratigraphy and temporal distribution of vertebrate faunas. Stratigraphy primarily based on Galloway et al. (1986) and reflects marine biostratigraphic control in down-dip locations. Symbol in the Catahoula Formation identifies approximate age of multiple Ar/Ar radiometric dates (Jordan et al., 2019). Blue bar highlights the Ba1 North American Land Mammal Age (NALMA). Time scale from Hilgren et al. (2012); Raffi, Wade and Pälike (2020). O = Orellan, W = Whitneyan, Ar = Arikareean, He = Hemingfordian, Ba = Barstovian, CL = Clarendonian, H = Hemphillian. Names shown for the vertebrate assemblages are local fauna names except for Lapara Creek Fauna (composed of multiple local faunas), and Belts Creek (single locality with three known taxa).
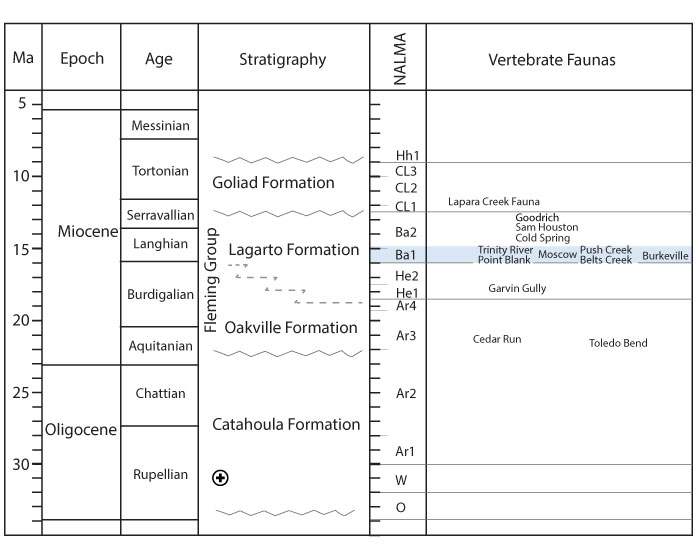
FIGURE 2. Distribution of selected vertebrate localities in the Fleming Group. See Table 1 for locality names, numbers, and associated faunal names.
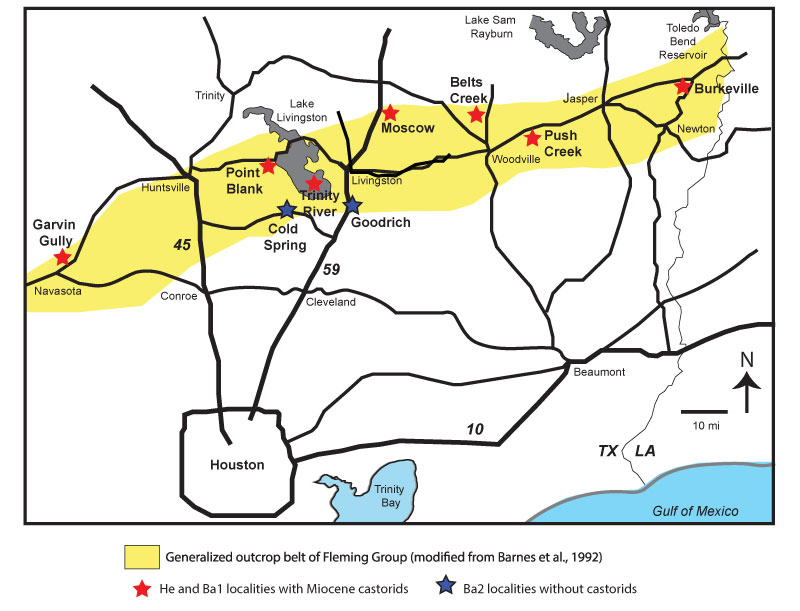
FIGURE 3. TMM 40068-24, left m1, cf. Palaeocastor. A - line drawing occlusal view, B - labial view.
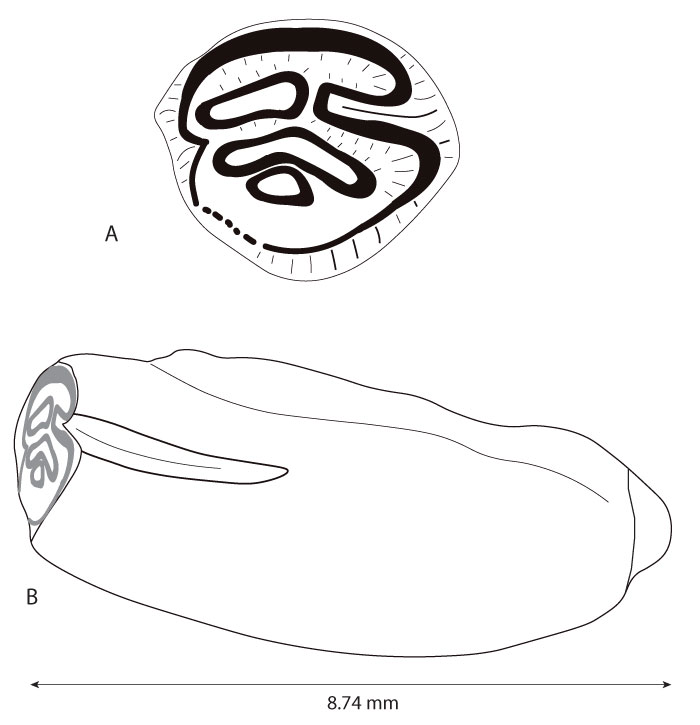
FIGURE 4. Distribution of local faunas and castorids in the Miocene strata of the Texas Coastal Plain. Texas counties displayed roughly west to east, left to right. Time scale from Hilgren et al. (2012); Raffi, Wade and Pälike (2020)
.
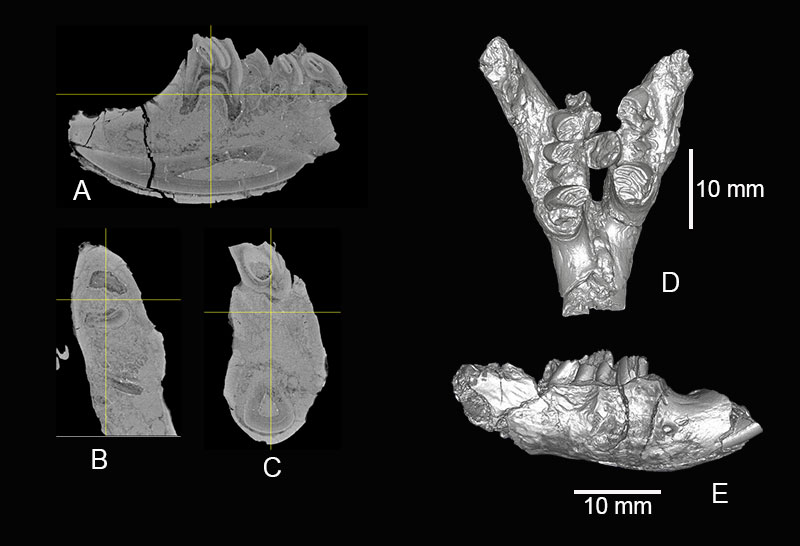
FIGURE 5. TMM 40197-2665. Anchitheriomys buceei (holotype), A - right side (anterior to right), B - dorsal view, C - left side (anterior to left), D - ventral view. Photographs in normal light.
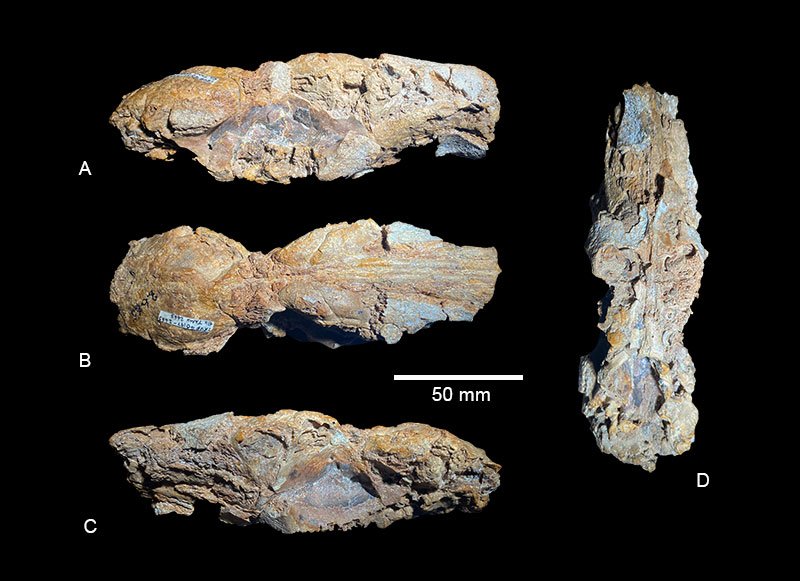
FIGURE 6. TMM 40197-2665. Anchitheriomys buceei (holotype), A - right side (anterior to right), B - dorsal view (anterior to right), C - left side (anterior to left), D - ventral view (anterior to top). Images rendered from CT data volume.
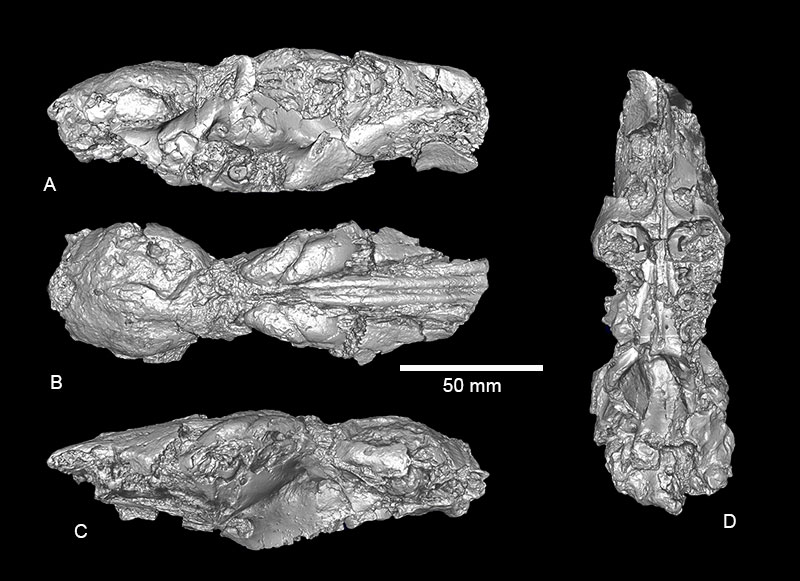
FIGURE 7. TMM 40197-2665. Anchitheriomys buceei (holotype), ventral view of skull, isosurface rendered from CT volume, anterior to left, illustrating roots of the upper cheek teeth, palatine grooves and foramina, posterior geometry of palatine.
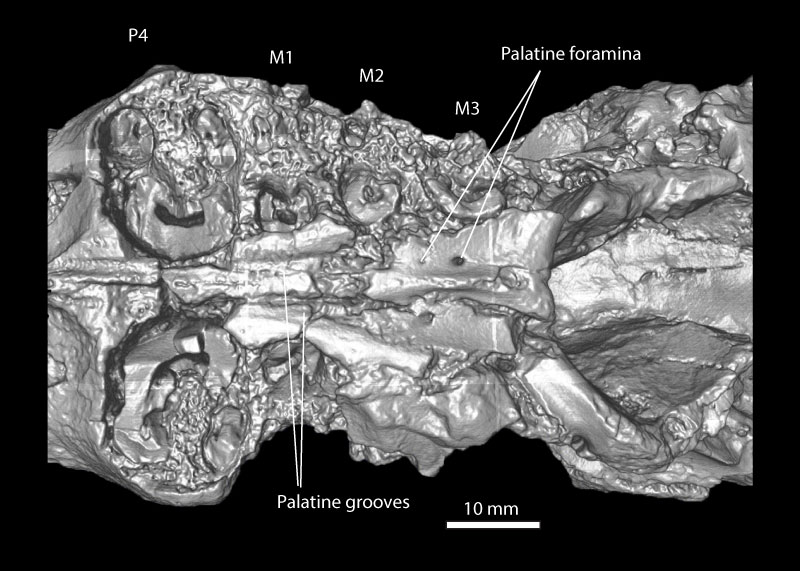
FIGURE 8. A - TMM 1465-1.1. Anchitheriomys nanus, isosurface rendering of CT data showing the ventral view of the skull. Bones of the palate and associated facial features are rendered in gold, anterior to the left. B - dorsal view of the skull. C - details of the palatine morphology, anterior to the left. The right pterygoid process has been restored to near its original position in the image. Grooves in the palatine are clear as is the foramen at the posterior terminus of the groove. The two teeth are right and left P4.
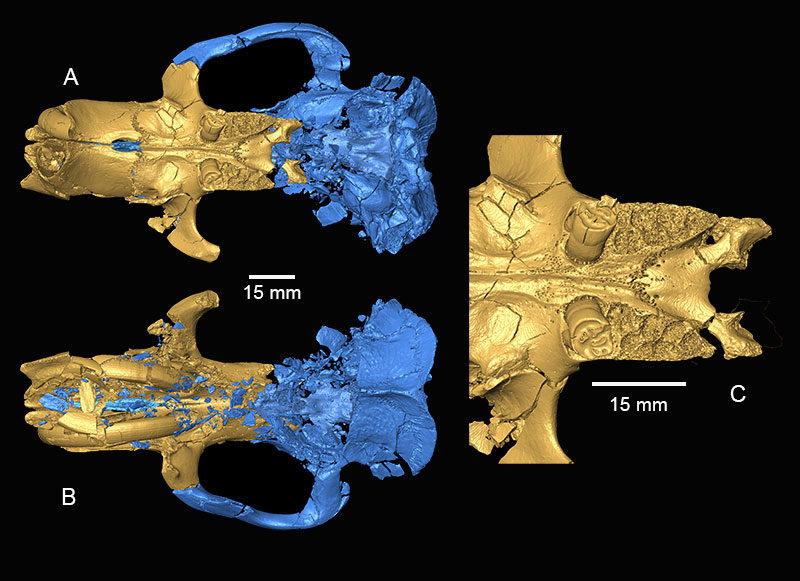
FIGURE 9. TMM 40197-2665. Anchitheriomys buceei (holotype), dorsal view of skull, isosurface from CT volume, anterior to the right, nc - nasal cavity, fs - frontal sinus.
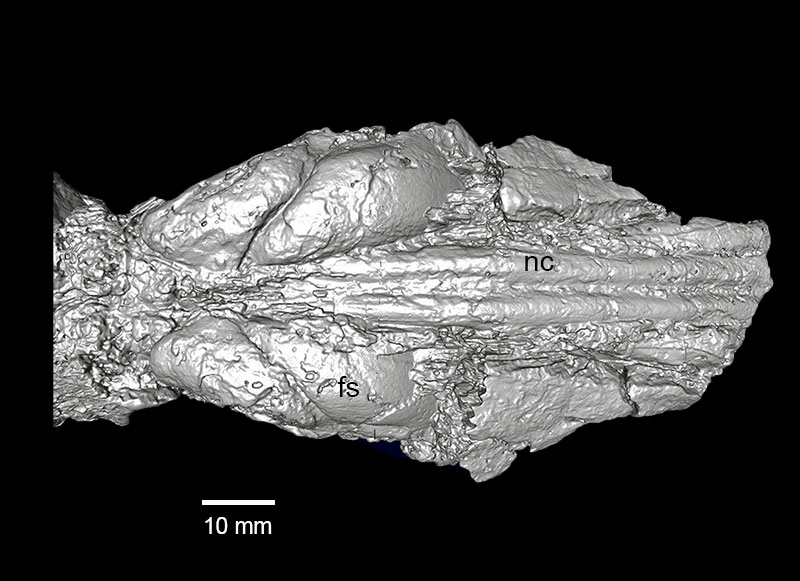
FIGURE 10. TMM 40197-2665. Anchitheriomys buceei (holotype), right oblique view of skull illustrating endocast of brain, frontal sinus, nasal cavity, infraorbital canal, and endocast of I1 alveolus, isosurface rendered from CT volume, anterior to right.
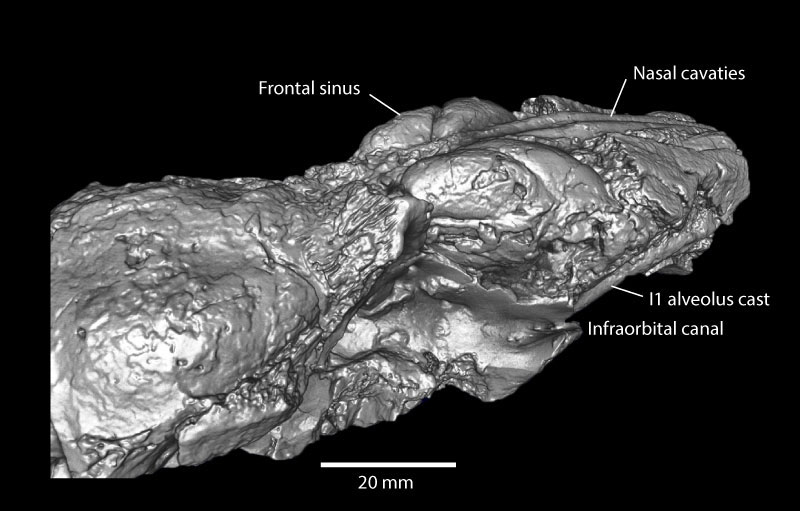
FIGURE 11. TMM 40197-2665. Anchitheriomys buceei (holotype), lateral views (different angles) of left orbital illustrating orbital foramina from CT volume. n - nasolacrimal, s - sphenopalatine, e - ethmoidal, o - optic, dp - dorsal palatine, ito - interorbital, anterior to the left. Isosurface rendered from CT volume.
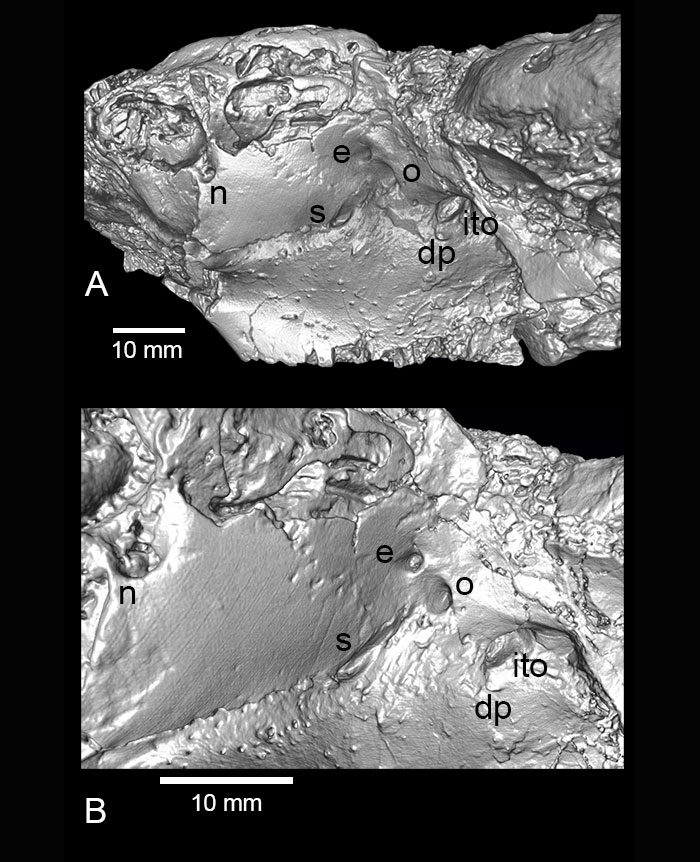
FIGURE 12. TMM 40623-12. Anchitheriomys buceei, partial left dentary, A - labial view anterior to the left, B - lingual view anterior to the right, C - oblique anterior view showing well developed ridges on i1 and symphyseal flange, D - ventral view showing posterior continuation of i1.
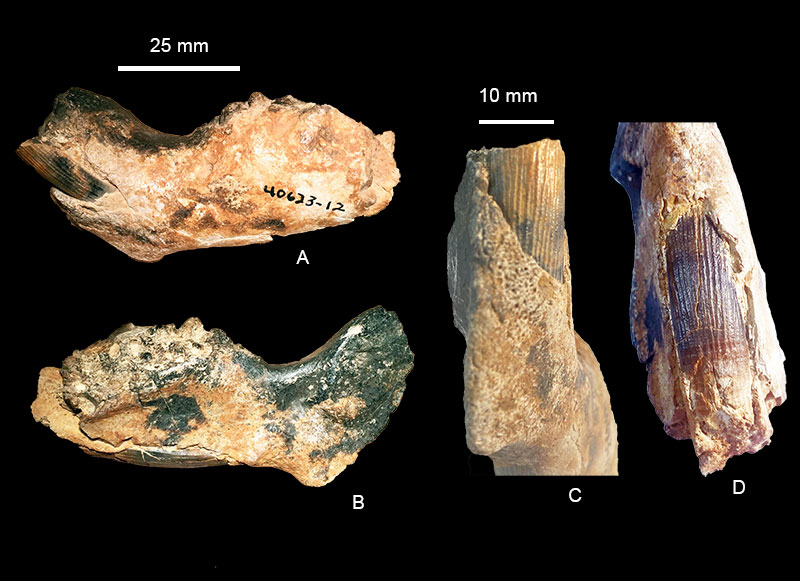
FIGURE 13. TMM 40623-12, Anchitheriomys buceei, line drawing showing cross section of i1 at natural break near alveolus with general location of well-defined ridges along the anterior face.
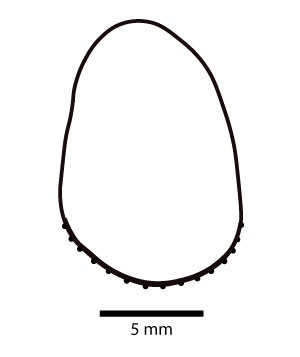
FIGURE 14. TMM 40623-12, Anchitheriomys buceei, oblique view of i1 showing corrugations on ridges of incisor.
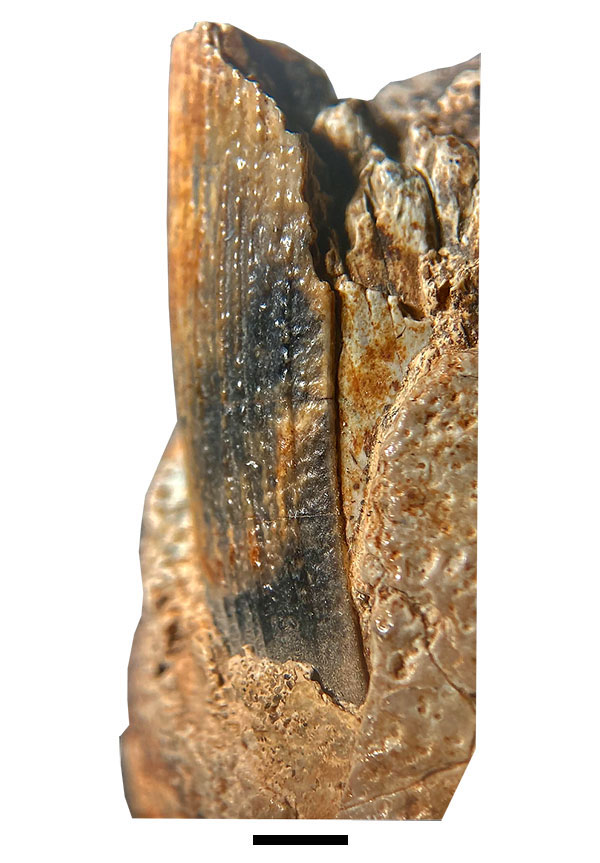
FIGURE 15. Anchitheriomys buceei, isolated upper cheek teeth (all measurements are L x W, anterior up). A - TMM 40197-2665 R M3, molar associated with holotype skull 7.9 mm x 8.2 mm; B - TMM 31057-141 R M3, 7.1 mm x 7.5 mm; C - TMM 31057-7 L M2, 7.33 mm x 7.38 mm; D - TMM 40622-13 L P4, 9.4 mm x 10.3 mm; E - 2666 L P4 very worn, 14.5 mm x 12.8 mm, occlusal view above, posterior view below with large blade-like root on the lingual side of the tooth; F - TMM 71-2669 R M2, 8.9 mm x 9.6 mm.
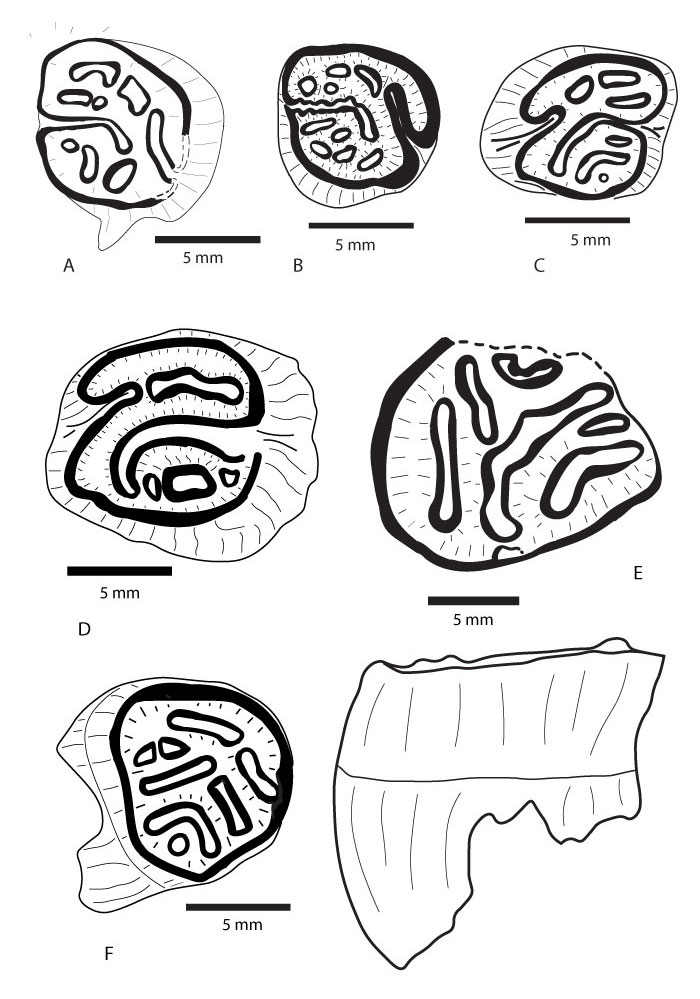
FIGURE 16. Anchitheriomys buceei, isolated lower cheek teeth (all measurements are L x W, anterior up). A - TMM 31057-185 L m1, 8.8 mm x 9.2 mm; B - TMM 31057-163 L m1, 7.4 mm x 9.6 mm, very worn; C - TMM 31057-59 R m2, 8.0 mm x 7.5 mm, D - TMM 71-2667 R p4, 10.6 mm x 10.8 (broken along dashed line).
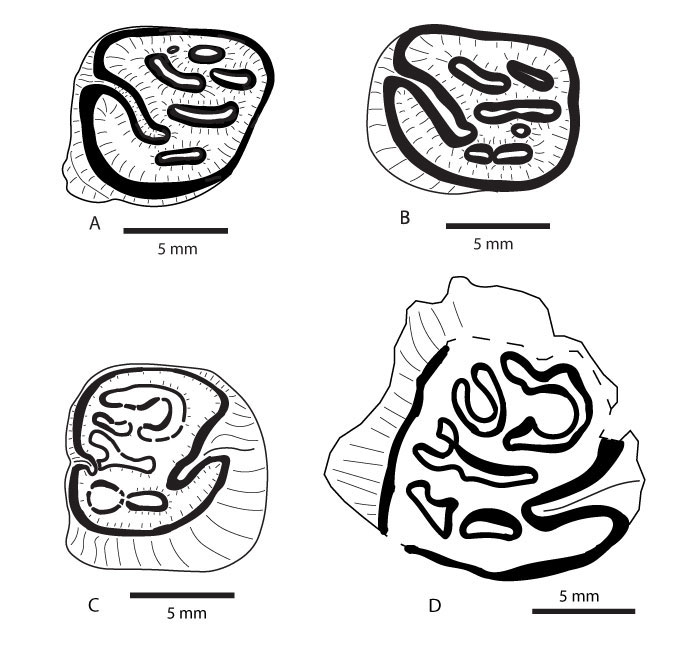
FIGURE 17. Anchitheriomys buceei, A, B - TMM 71-2666, proximal right ulna. C, D - TMM 71-2666 distal right humerus.
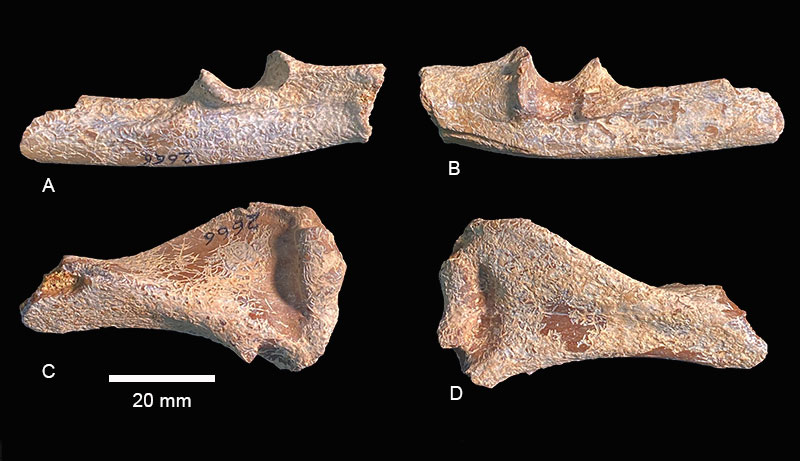
FIGURE 18. Monosaulax sp. A, TMM 31244-6 mandible dorsal view. B, TMM 31244-6 mandible ventral view showing occlusal surface of P4-M2 between left and right dentaries. C, TMM 31244-6 mandible ventro-lateral view showing smooth nature of anterior face of lower incisors. D, TMM 31057-300, maxillary fragment with P4-M3, occlusal view, anterior towards top.
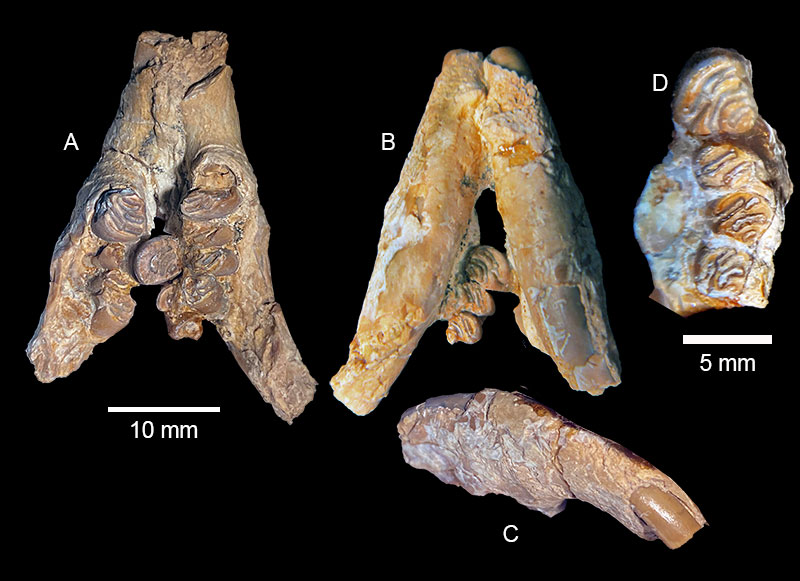
FIGURE 19. Monosaulax sp. A - TMM 31244-6, left and right i1, cross-section drawn at natural break. B - TMM 31244-6, L p4 occlusal view. C - TMM 31057-300, maxillary fragment with P4-M3 occlusal view, anterior towards top. D - TMM 31244-6, P4-M2 associated with mandible.
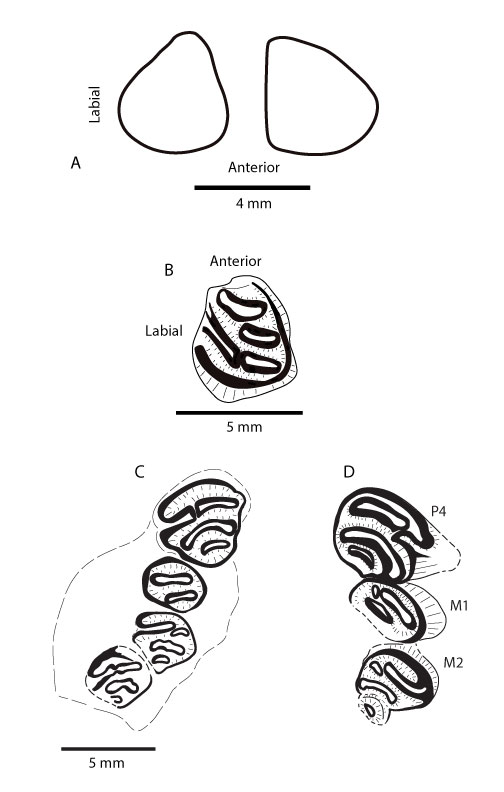
FIGURE 20. Monosaulax sp. TMM 31244-6 CT data. A - vertical longitudinal slice through anterior part of left dentary showing two roots on left p4 and oblique view of incisor, anterior to the left. B - horizontal slice through anterior part of left dentary showing two roots on left p4, anterior to the top. C - vertical transverse slice of left dentary between roots of p4 and showing cross-sectional view of incisor. D - dorsal view of mandible as isosurface rendering. E - labial view of right dentary as isosurface rendering, anterior to the right.