FIGURE 1. Background information. A, Conceptualized current understanding of family-level phylogeny of Lamniformes along with nine other neoselachian shark orders discussed in this study (ten orders are in bold; the family †Otodontidae that includes †Otodus megalodon is highlighted in gray box; category with an asterisk [*] includes several genera of uncertain familial placements, such as †Priscusurus and †Trigonotodus: see Cappetta, 2012; sources of information: Klug, 2010; Cappetta, 2012; Vullo et al., 2016, 2021, 2024; Landemaine et al., 2018; Shimada and Everhart, 2019; Jambura et al., 2019, 2023; Stone and Shimada, 2019; Sternes et al., 2023, 2024; Silva et al., 2023; note that, although neoselachians, the monophyly and composition of †Synechodontiformes are questionable: see Maisey, 2012; the lamniform attribution of †Palaeocarcharias stromeri is tentative: see Villalobos-Segura et al., 2023; Guinot et al., 2025). B, Silhouette of reconstructed vertebral column of †Otodus megalodon based on associated vertebral set from the Miocene of Belgium (IRSNB P 9893) and its total measured length by Cooper et al. (2022), where the total length (TL) of the shark is unknown because its neurocranial length (NL) and caudal fin length (CL) are unknown (asterisk [*] indicates the vertebral column length used in this study: see text). C, Schematic illustration using extant Pseudocarcharias kamoharai as an example showing that Step 1 of this study investigates the neurocranial proportion (NP), trunk proportion (TP), and caudal fin proportion (CP) in relation to TL, whereas Step 2 shows that the “adjusted neurocranial proportion” (aNP) and “adjusted caudal fin proportion” (aCP) are determined by considering TP as 100% (or “adjusted trunk proportion” [aTP]) (line drawing based on Ebert et al., 2021, p. 307; neurocranial image based on CT scan rendering of FMNH 117474). D, Example of silhouettes of a shark in lateral (top) and dorsoventral (bottom) views for body weight (body mass) estimation (see E–G; this example depicts Negaprion brevirostris [lemon shark] based largely on Ebert et al., 2021, p. 561: see text). E, Example silhouette in lateral (top) and dorsoventral (bottom) views with non-caudal fins as well as non-muscular portions of the caudal fin removed (after D) for body weight (body mass) estimation (see F). F, Serial superelliptical sections generated based on example silhouettes in E. G, 3D mesh combining all superelliptical slices as in F. H, One of the largest vertebrae (“centrum #1”) of †Otodus megalodon in IRSNB P 9893 (see B; scale bar equals 10 cm; photograph courtesy of IRSNB). I, Computed tomographic image showing a sagittal cross-sectional view of vertebra depicted in H (scale bar equals 5 cm; after Shimada et al., 2021b, figure 1b). J, Computed tomographic image of a sagittal cross-sectional view of the largest vertebrae (“centrum #4”) in IRSNB P 9893 showing incremental growth bands presumably formed annually based on Shimada et al. (2021b, figure 1b) (scale bar equals 1 cm; * = center of vertebra; bent line = “angle of change”: see Shimada et al., 2021b).
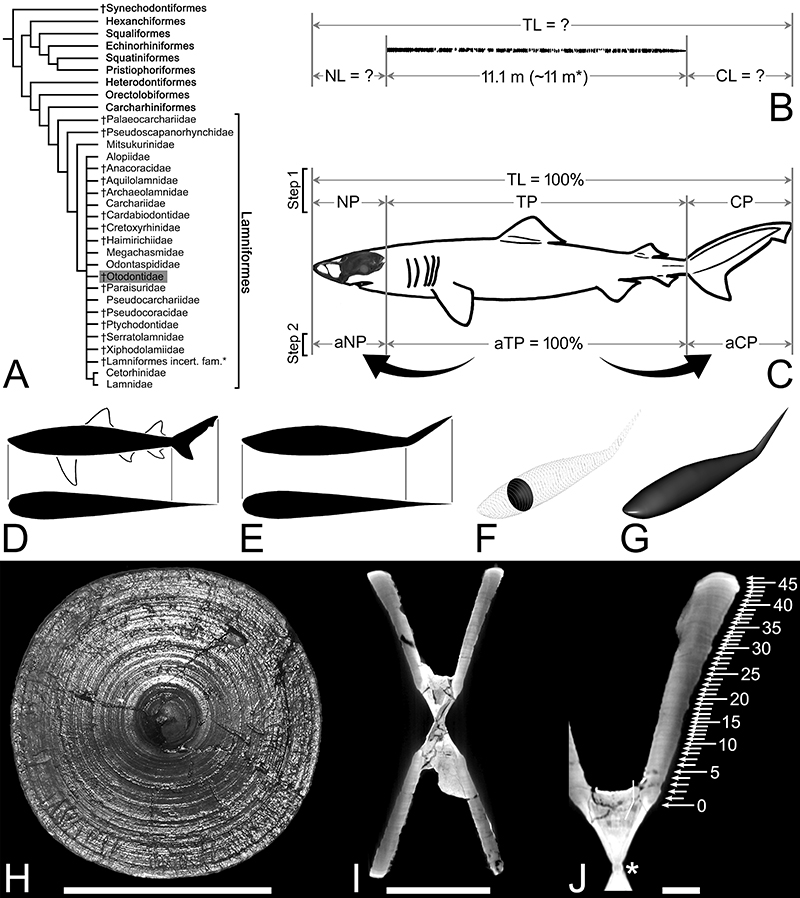
FIGURE 2. Euclidean distance dendrogram (cluster analysis) depicting the degree of difference in the relationship among the neurocranial, trunk, and caudal fin proportions across all examined taxa (NP, TP, and CP in Appendix 3), where lamniform taxa are pointed by triangle arrows and †Otodus megalodon is further highlighted in gray box (the cluster tree to the right is a subset of the larger tree to the left connected at the asterisk [*]). Some specific branches discussed in the text: a, alopiid lamniforms and zebra shark (Orectolobiformes: Stegostomatidae) with an exceptionally elongated caudal fin; b, pristiophoriforms with an exceptionally elongated spinous rostrum (sawsharks); c, mitsukurinid lamniforms with an exceptionally elongated non-spinous rostrum; d, selected clustering of taxa that includes †O. megalodon.
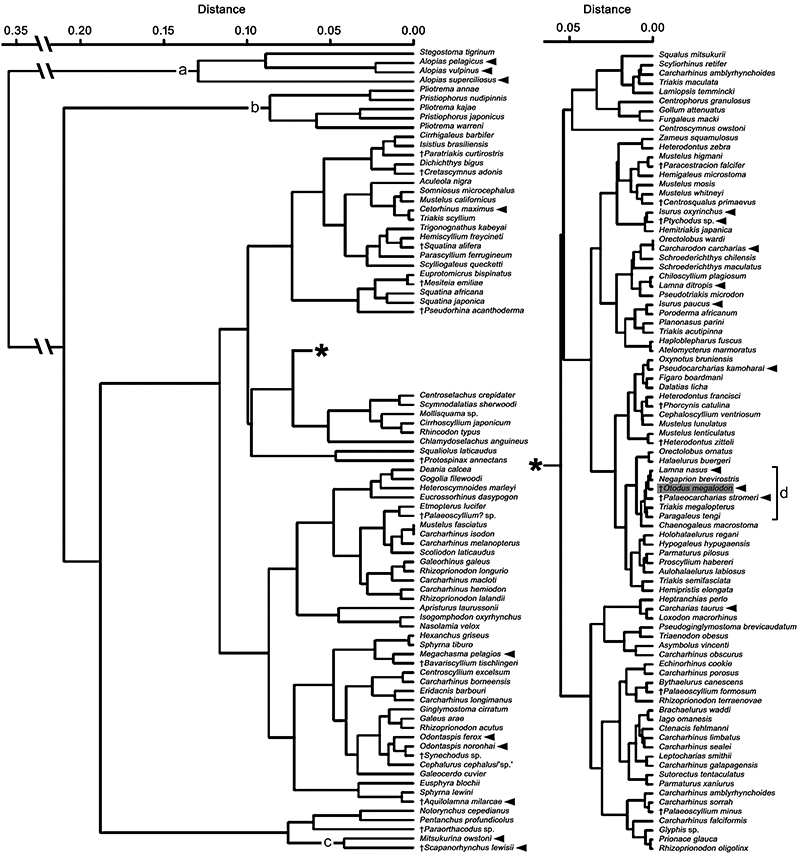
FIGURE 3. Comparisons of size estimates for each vertebra (green plots, each representing the predicted value of each centrum along with 95% prediction intervals) of IRSNB P 9893 based on the relationship between the total length (TL) and vertebral diameter in two extant lamnid sharks with the actual vertebral column length of IRSNB P 9893 reported by Cooper et al. (2022) (black horizontal line; see Figure 1B) and estimated TL of IRSNB P 9893 made by Gottfried et al. (1996) (red horizontal line). A, estimates based on extant white shark (Carcharodon carcharias) using vertebral data from Wintner and Cliff (1999; n = 111; y = 1.94 + 0.87x). B, estimates based on extant porbeagle shark (Lamna nasus) using vertebral data from Natanson et al. (2002; n = 575; y = 1.96 + 0.88x). Note that the use of these extant lamnids to extrapolate the TL of IRSNB P 9893 results in severe underestimations, including Gottfried et al.’s (1996) study.
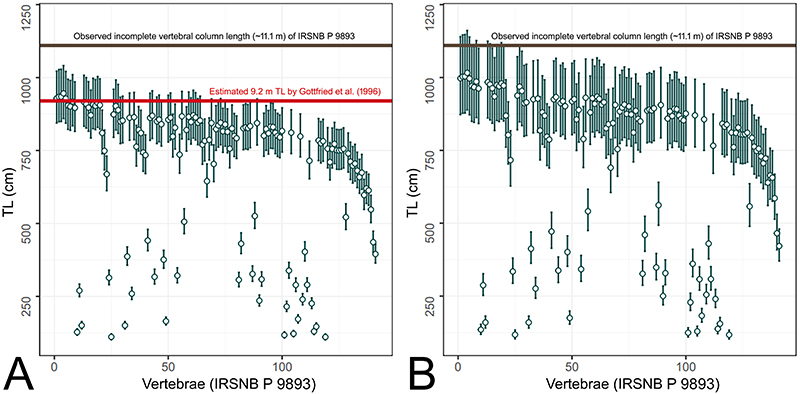
FIGURE 4. Effects of allometry (A), and comparisons of log-transformed relationship between body length and fineness ratios of cetaceans (B) and sharks of interest (C). A, Conceptualized effects of negative allometry in Negaprion brevirostris and positive allometry in Carcharodon carcharias (white shark) and Lamna nasus (porbeagle shark) if each taxon hypothetically grew to 24.3 m TL based on their species-specific relationship between body length and body weight (topmost body images based on Ebert, 2014, p. 47, 53; Ebert et al., 2021, p. 561). B, Body fineness ratio plotted against body length for 39 individuals of whales (numbers) based on Ahlborn et al.’s (2009, table 1) data plus two additional cetacean taxa (stars) and the region of hydrodynamic disadvantages (gray zone) (see below for species codes; narrower bands represent 95% confidence interval of the regression of the samples and wider bands 95% prediction interval for the same). C, Essentially same as B but with mean growth trajectories expected for the three examined extant sharks (A) (with extrapolations up to the expected body lengths of †Otodus megalodon: solid line, body length range known for respective species; dashed lines, extrapolated parts) as well as plots of four large extant shark taxa (solid triangles; based on Ebert et al., 2021) and three previously reconstructed †O. megalodon (open triangles) superimposed (see below for species and reference codes). Cetacean species codes in B: 1, Balaenoptera acutorostrata (common minke whale); 2, B. borealis (sei whale); 3, B. musculus (blue whale); 4, B. physalus (fin whale); 5, Berardius arnuxii (Arnoux's beaked whale); 6, B. bairdii (Baird’s beaked whale); 7, Delphinapterus leucas (beluga whale); 8, Eschrichtius robustus (gray whale); 9, Mesoplodon bidens (Sowerby’s beaked whale); 10, M. bowdoini (Andrew’s beaked whale); 11, M. densirostris (Blainville’s beaked whale); 12, M. ginkgodens (ginkgo-toothed beaked whale); 13, M. peruvianus (pygmy beaked whale); 14, M. stejnegeri (Stejneger’s beaked whale); 15, Orcinus orca (orca); 16, Physeter macrocephalus (sperm whale); 17, Pseudorca crassidens (false killer whale); 18, Ziphius cavirostris (Cuvier's beaked whale); Eg, Eubalaena glacialis (North Atlantic right whale); Mn, Megaptera novaeangliae (humpback whale). Extant shark species codes and †O. megalodon reference codes in C: Cm, Cetorhinus maximus (basking shark); Mp, Megachasma pelagios (megamouth shark); Rt, Rhincodon typus (whale shark); Sm, Somniosus microcephalus (Greenland shark); C20, †O. megalodon at 16 m TL by Cooper et al. (2020, figure 2d); C22, †O. megalodon at 15.9 m TL by Cooper et al. (2022, figure 1N); G96, †O. megalodon at 11 m TL by Gottfried et al. (1996, figure 7).
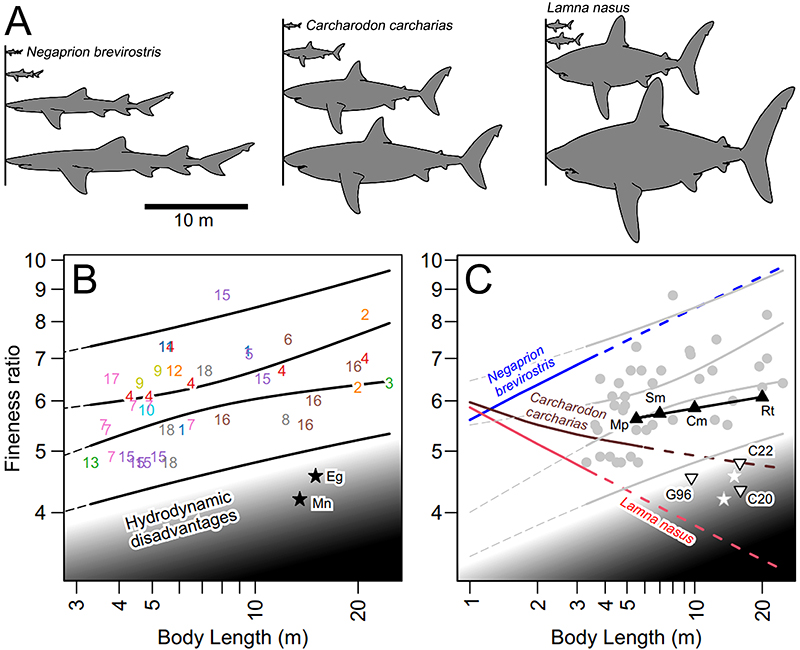
FIGURE 5. Silhouettes (not to scale) of Negaprion brevirostris (lemon shark), Carcharodon carcharias (white shark) and Lamna nasus (porbeagle shark) in lateral (gray) and dorsoventral (black) views (A), their hypothetically manipulated shapes (B), and highly tentative, conceptualized reconstruction of †Otodus megalodon (C). A, original morphology based on Ebert (2014, p. 47, 53) and Ebert et al. (2021, p. 561; see also text). B, hypothetical morphology of each shark in A after forcefully applying fineness ratio of 6.15, which is the mean fineness ratio obtained from the regression line for the four large extant sharks (solid triangles) in Figure 5G. C, Highly tentative reconstruction of †O. megalodon with a fineness ratio of approximately 6.08 onto which a silhouette of the reconstructed vertebral column of †O. megalodon by Cooper et al. (2022) (IRSNB P 9893: Figure 1B) has been superimposed with slight curvatures added. Two silhouettes of Homo sapiens (swimmers; from Jambura and Kriwet, 2020, figure 4) of different sizes illustrate the relative length of the reconstructed †O. megalodon at 16.4 m TL (top swimmer) and 24.3 m TL (bottom swimmer) for comparisons, but it must be emphasized that H. sapiens and †O. megalodon never coexisted. Tildes (~) denote inferred proportions that remain to be tested through the discovery of a well-preserved complete skeleton; also note that the size and shape of all the fins, including the caudal fin, remain highly hypothetical (see text for detail).
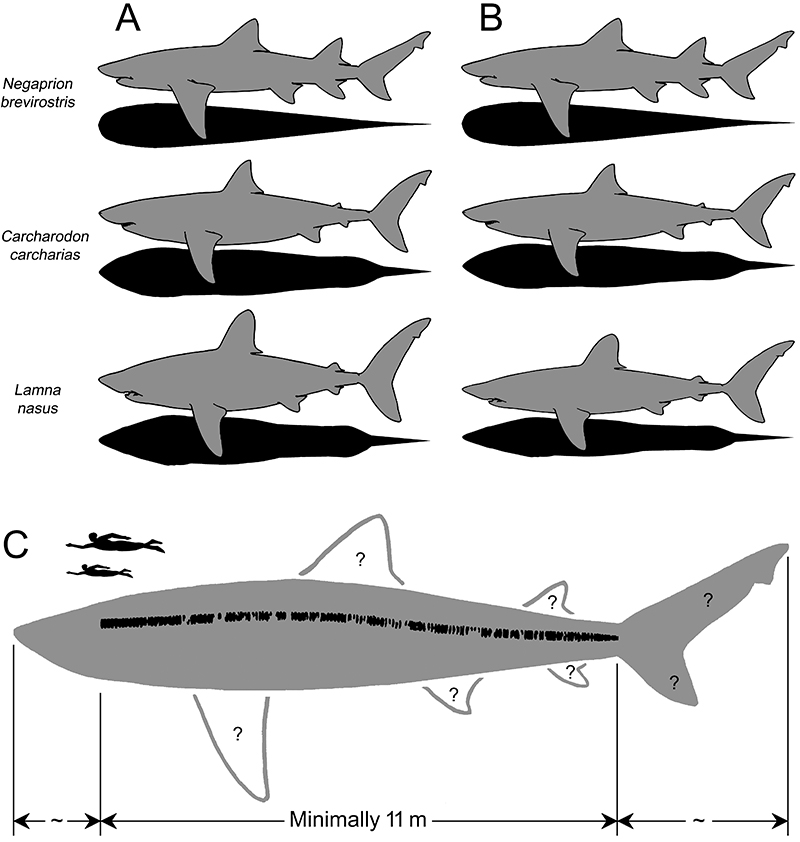
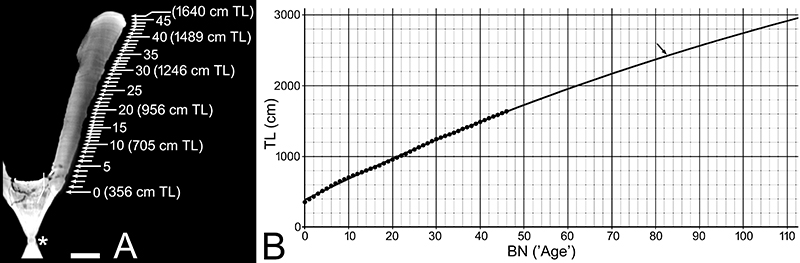
FIGURE 6. Ontogenetic growth analysis of †Otodus megalodon based on IRSNB P 9893 (see text for detail). A, Computed tomographic image of a sagittal cross-sectional view of the largest vertebrae (“centrum #4”) in IRSNB P 9893 showing incremental growth bands presumably formed annually along with estimated total length (TL) shown at every 10 growth band (cf. Figure 1J; scale bar equals 1 cm; * = center of vertebra; bent line = “angle of change”: see Shimada et al., 2021b). B, von Bertalanffy growth function (VBGF) fitted to data points (Table 4) that shows the relationship between growth band numbers (BN, or “age” of the individual in years) and TL (circles indicate plots based on IRSNB P 9893; arrow points the position on the VBGF curve at 24.3 m TL, which is the maximum size inferred for †O. megalodon in this study).