FIGURE 1. Map of humerus-bearing fossil localities from this study. Localities span the Lancian biozone (yellow circles), and early and late Puercan biozones (Pu1 and Pu3, in blue stars and green triangles, respectively), as well as the temporally mixed Lancian-Pu1 localities of the Bug Creek Anthills (red squares). Most localities are in Garfield and McCone counties; Fallon and Carter counties in Montana and Niobrara County in eastern Wyoming (not pictured) each have one locality. Locality names and details are given in Appendix 1. Modified from Wilson et al. 2014.
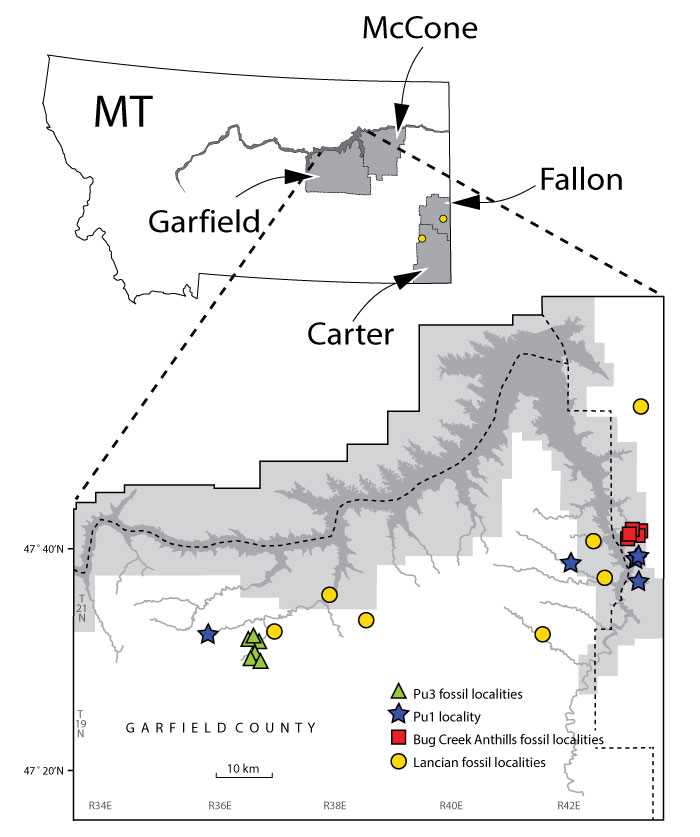
FIGURE 2. Schematic of humerus measurements used in this study. Multituberculate specimen (UCMP 153039; left) in ventral (1), dorsal (2), and distal (3) views; eutherian specimen (UCMP 151964; right, reversed to appear as left) in anterior (4), posterior (5), and distal (6) views. See Table 1 for measurement descriptions. Abbreviations: AW, articular width; C, capitulum; CL, capitulum length; CD, capitulum depth; CW, capitulum width; EC, ectepicondyle; LC, lateral epicondyle (ectepicondyle); MC, medial epicondyle (entepicondyle); NC, entepicondyle; NCW, entepicondylar width; RC, radial condyle; RCL, radial condyle length; RCD, radial condyle depth; RCW, radial condyle width; TDW, total distal width; TL, trochlear length; TD, trochlear depth; TLW, total lateral width; TW; trochlear width; UC, ulnar condyle; UCL, ulnar condyle length; UCD, ulnar condyle depth; UCW, ulnar condyle width; UT, ulnar trochlea.
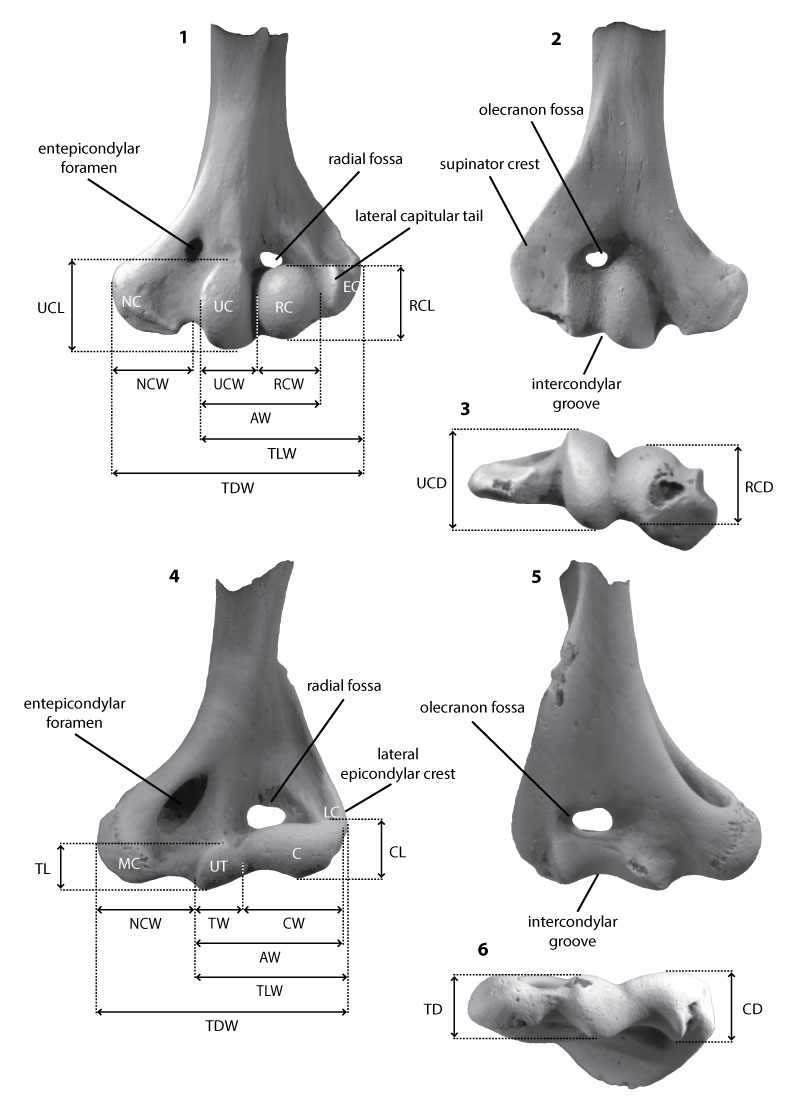
FIGURE 3. Geometric morphometric scheme and method for placement of landmarks (LMs), curves, and semilandmarks (SLMs) on therian left distal humerus (UWBM 20646, Sciurus carolinensis). All specimens were oriented with anterior up and medial to the left; right specimens were reflected to appear as lefts. (1) LMs 1-6 were plotted (see Table 5 for landmark descriptions). (2) Curves were traced along the anterior, posterior, and medial borders of the articular surface. (3) Curves were re-sampled for equivalent lengths between points, with 11, nine, and five points describing the anterior, posterior, and medial borders of the articular surface, respectively. All resampled points and LMs were used for Procrustes superimposition, with sliders (gray) allowed to slide between helper points (white; see Methods). (4) Helpers were deleted, and all remaining LMs (black) and SLMs (white) were used in PCA analyses.
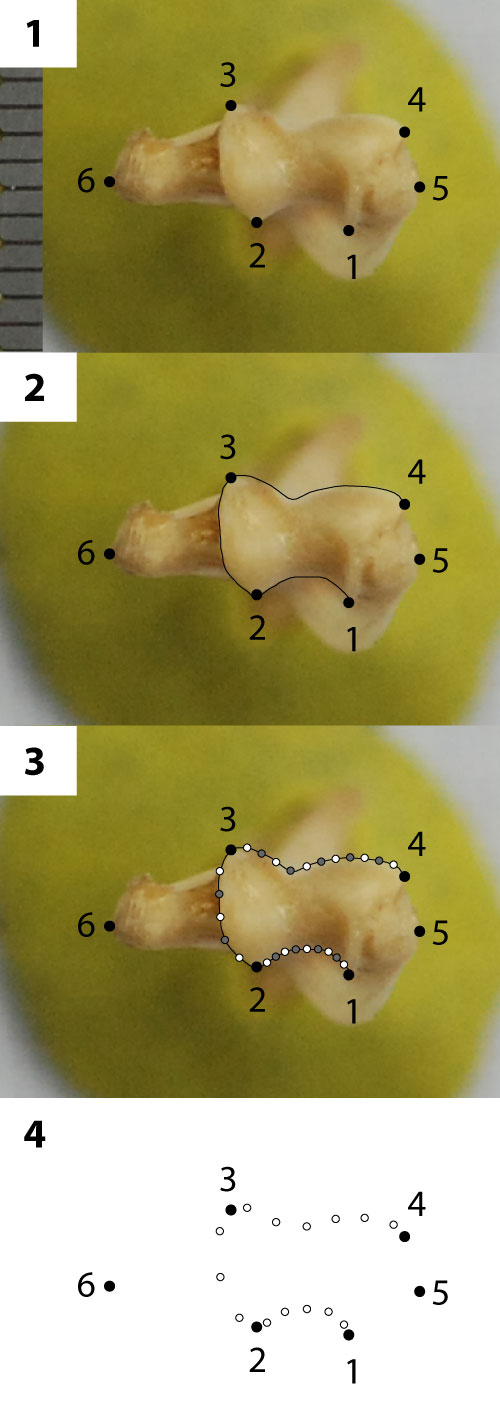
FIGURE 4. Multituberculate morphotype MuA (UCMP specimen 122045, from locality V70201; right), in ventral (1) and dorsal (2) stereopair views, and in lateral (3), medial (4), and distal (5) views.
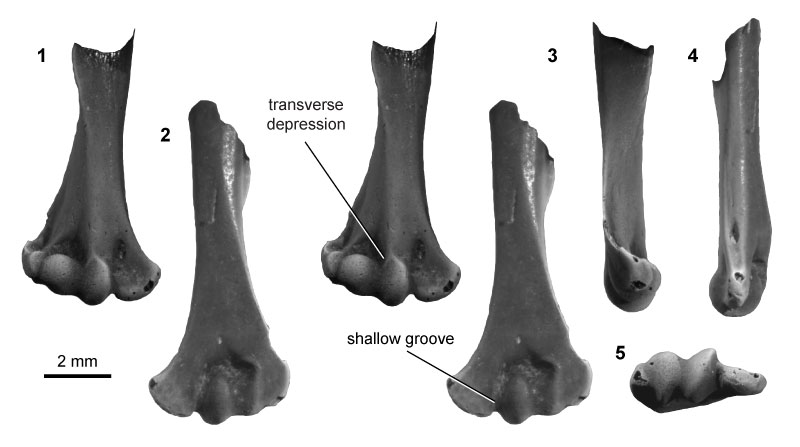
FIGURE 5. Multituberculate morphotype MuB (UCMP specimen 195933, from locality V99438; left), in ventral (1) and dorsal (2) stereopair views, and in distal (3), medial (4), and lateral (5) views.
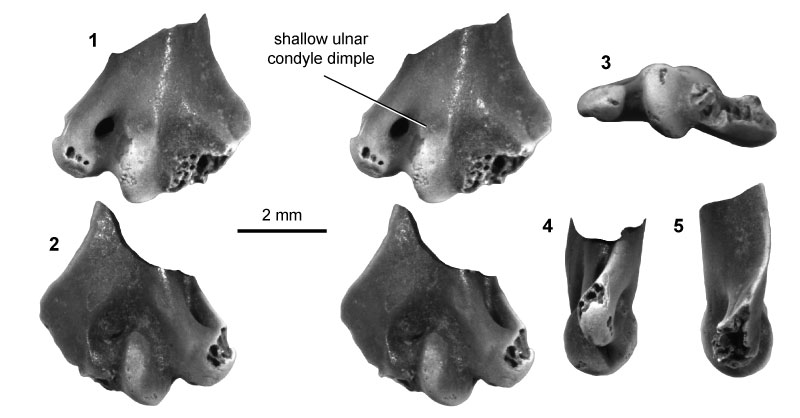
FIGURE 6. Multituberculate morphotype MuC (UCMP specimen 153039, from locality V84193; left), in ventral (1) and dorsal (2) stereopair views, and in lateral (3), medial (4), and distal (5) views.
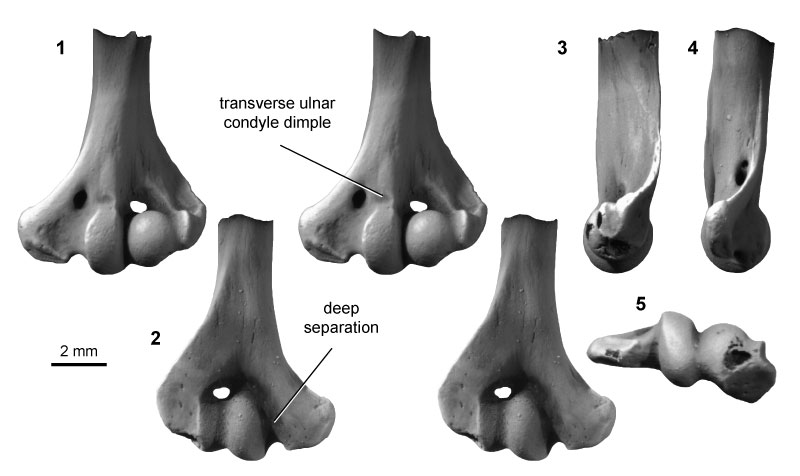
FIGURE 7. Multituberculate morphotype MuD (UCMP specimen 195990, from locality V5620; left), in ventral (1) and dorsal (2) stereopair views, and in medial (3), lateral (4), and distal (5) views.
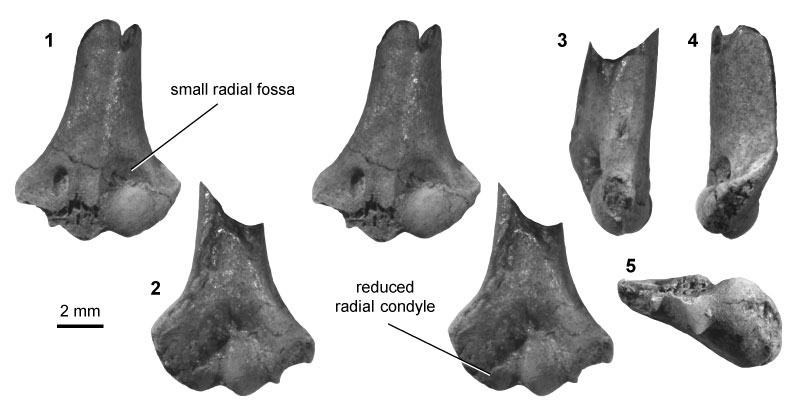
FIGURE 8. Multituberculate morphotype MuE (UWBM specimen 97031, from locality C1845; right), in ventral (1) and dorsal (2) stereopair views, and in lateral (3), medial (4), and distal (5) views.
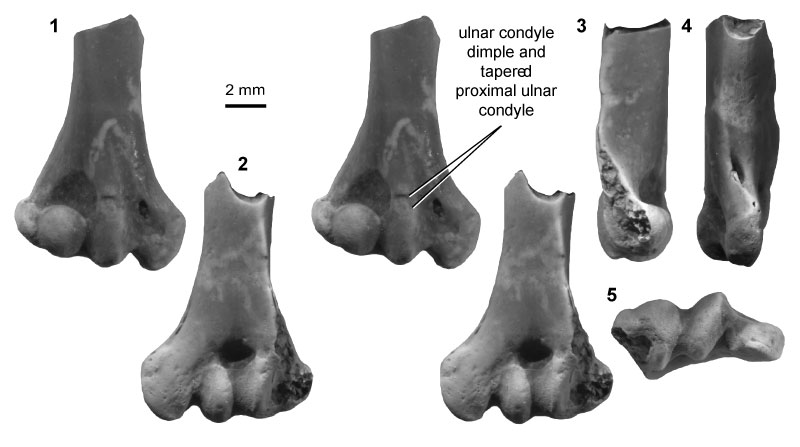
FIGURE 9. Multituberculate morphotype MuF (UCMP specimen 127384, from locality V87001; left), in ventral (1) and dorsal (2) stereopair views, and in lateral (3), medial (4), and distal (5) views.
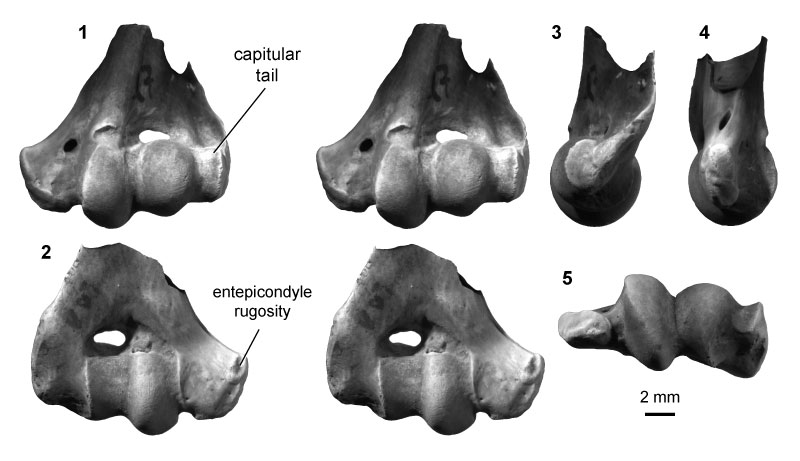
FIGURE 10. Therian morphotype ThA (UCMP specimen 127391, from locality V88007; left) in anterior (1) and posterior (2) stereopair views, and in medial (3) view.
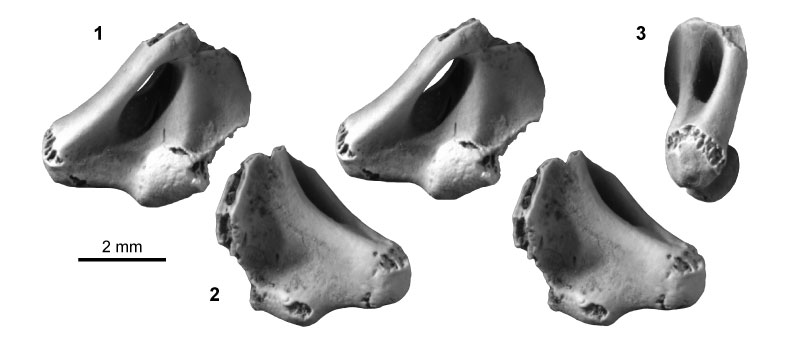
FIGURE 11. Metatherian morphotype MeA (UCMP specimen 152394, from locality V93169; left) in anterior (1) and posterior (2) stereopair views, and in lateral (3), medial (4), and distal (5) views.
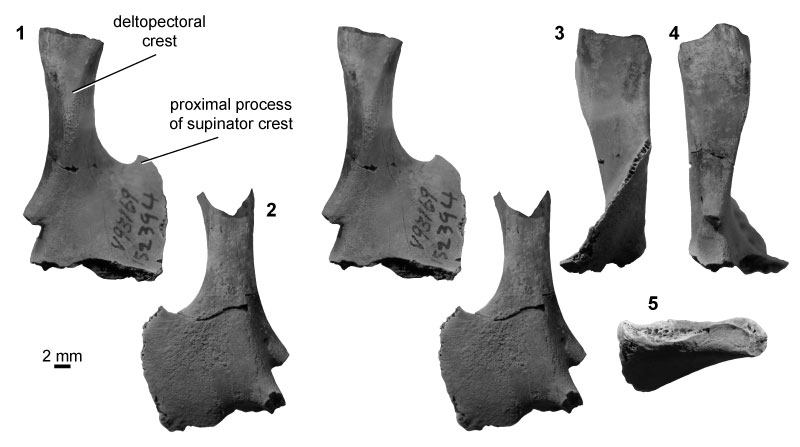
FIGURE 12. Eutherian morphotype EuA (UCMP specimen 153100, from locality V99438; left) in anterior (1) and posterior (2) stereopair views, and in lateral (3), medial (4), and distal (5) views. Specimen images are CT scan views, not photographs; see Methods for details. Rough patches inside the shaft and within the entepicondylar foramen are the result of sediment infilling, whereas other rough areas (i.e., supinator crest, medial entepicondyle, posterior articular surfaces) indicate specimen breakage.
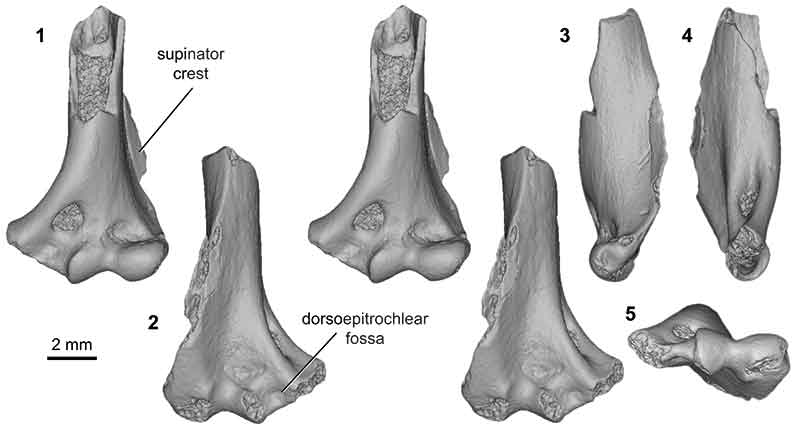
FIGURE 13. Eutherian morphotype EuB (UWBM specimen 97114, from locality C1115; left) in anterior (1) and posterior (2) stereopair views, and in distal (3), lateral (4), and medial (5) views.
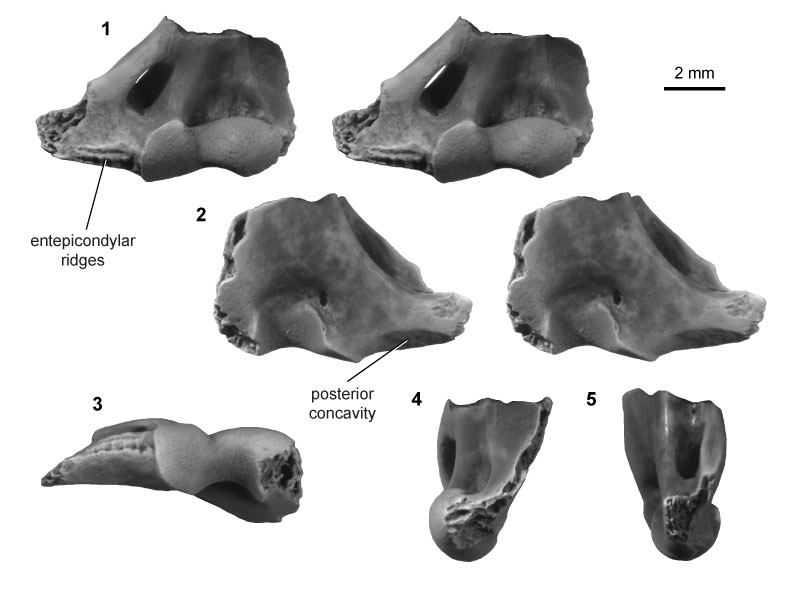
FIGURE 14. Eutherian morphotype EuC (UCMP specimen 151991, from locality V71203; right) in anterior (1) and posterior (2) stereopair views, and in lateral (3), medial (4), and distal (5) views.
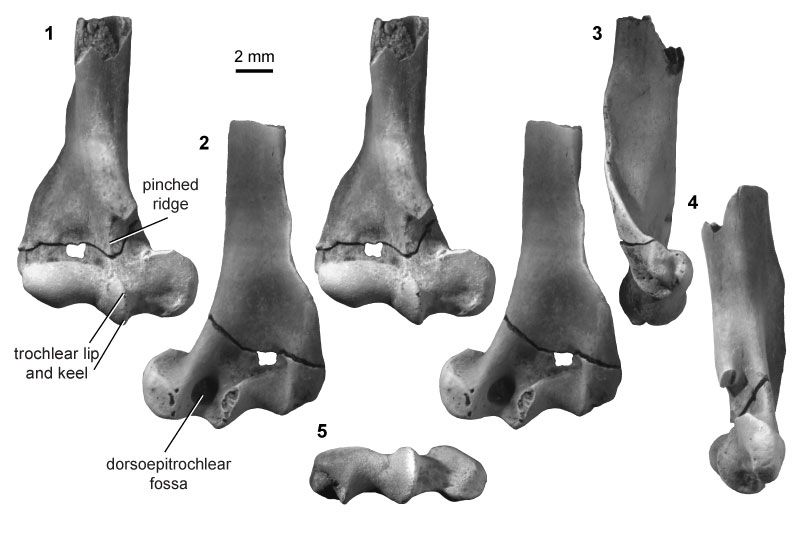
FIGURE 15. Eutherian morphotype EuD (UCMP specimen 151964, from locality V65127; right) in anterior (1) and posterior (2) stereopair views, and in lateral (3), medial (4), and distal (5) views.
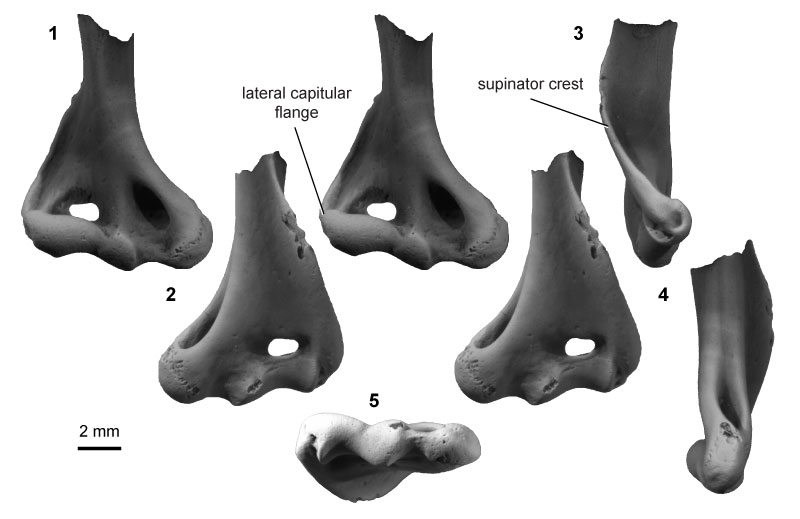
FIGURE 16. Eutherian morphotype EuE (UCMP specimen 218901, from locality V91065; right) in anterior (1) and posterior (2) stereopair views, and in lateral (3), medial (4), and distal (5) views.
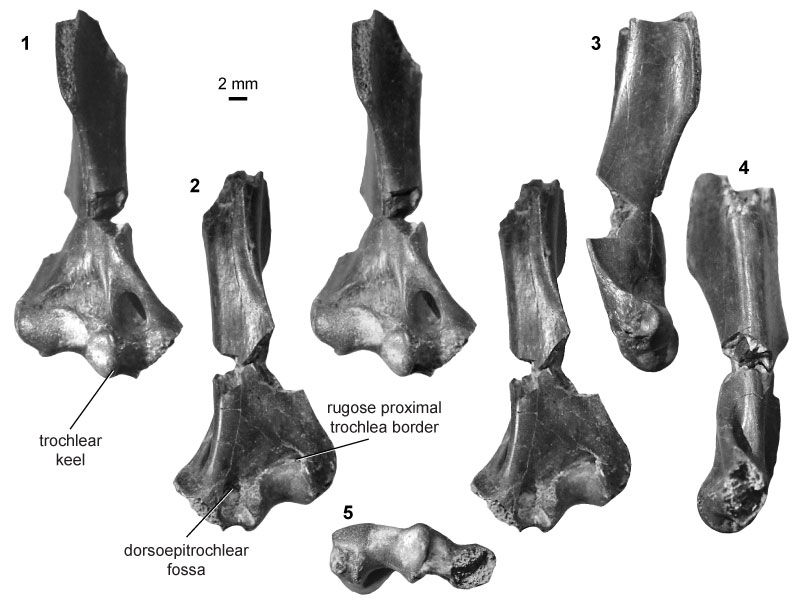
FIGURE 17. Eutherian morphotype EuF (UCMP specimen 92928, from locality V72129; right) in anterior (1) and posterior (2) stereopair views, and in lateral (3), medial (4), and distal (5) views.
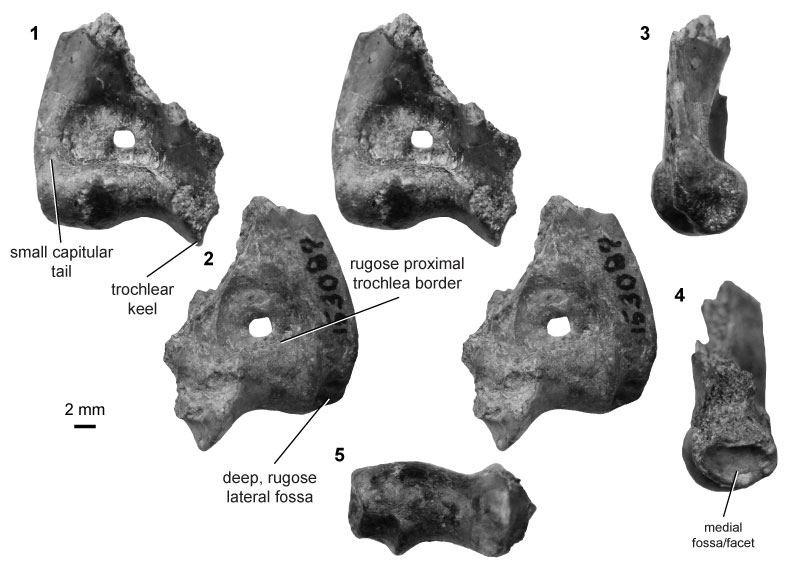
FIGURE 18. Eutherian morphotype EuG (UCMP specimen 192678, from locality V74124; left) in anterior (1) and posterior (2) stereopair views, and in medial (3) and distal (4) views.
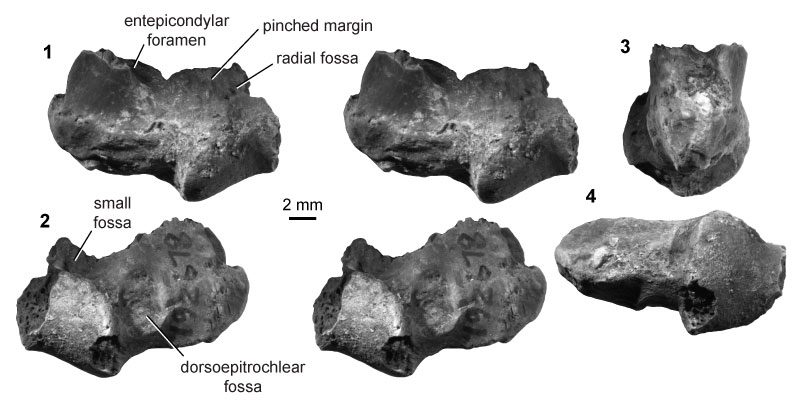
FIGURE 19. Summary of humerus morphotypes and relative sizes in our study area in the Hell Creek and Tullock formations of eastern Montana. Multituberculate morphotypes are shown as black bars, metatherians as gray bars, and eutherians as white bars. Numbers within the bars indicate the sample size for each temporal bin. Morphotypes are arranged left to right according to increasing size (see text for specimen numbers, localities, and details; Appendix 7-Appendix 8 for morphotype mean sizes). Gradients for MuF, EuC, and EuD indicate morphotypes were present in the time-averaged Bug Creek Anthills assemblages, and the morphotype range may extend into the Pu1 and/or the Lancian. Pu2 assemblages are not known from our study area (hashmarks indicate resultant uncertainty of range-through morphotypes; Clemens 2015). The age model is based on previous geochronological work in this study area (Swisher et al., 1993; Renne et al., 2011, 2013; Wilson, 2014; Sprain et al. 2014); note the temporal axis is not to scale. Modified from Sprain et al. (2014). Abbreviations: Fm, Formation; NALMA, North American Land Mammal “age”; Pu1, early Puercan; Pu3, middle/late Puercan; queries (?) indicate specimens that are only tentatively attributed to that morphotype, see Methods.
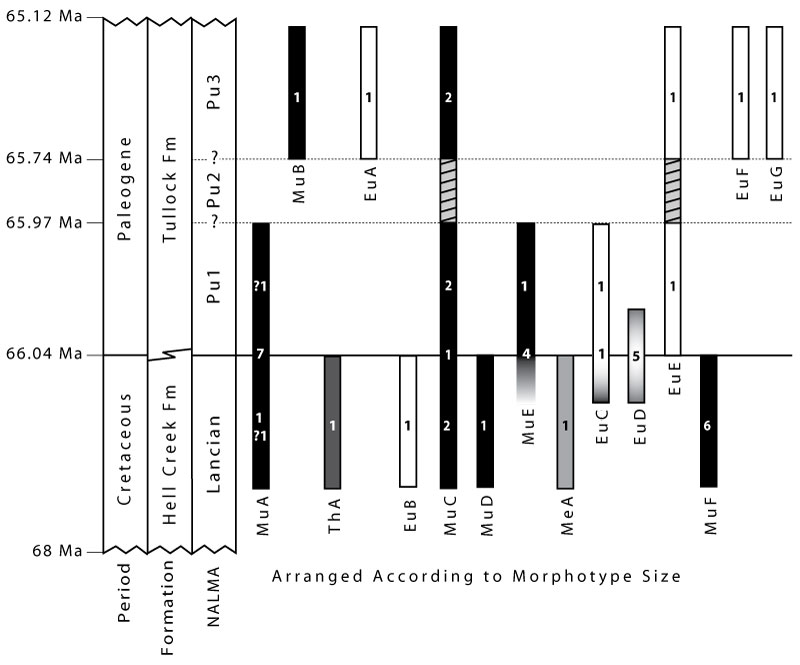
FIGURE 20. Plots of Principal Component Analysis (PCA) of full dataset, color-coded for taxon (top) and locomotor group (bottom), with fossils (open circles) projected into the morphospace. (1) PC1 vs. PC2 and (2) PC2 vs. PC3 for all taxa (legend top right), and the same data for locomotor group (3-4; legend bottom right). Also included are the deformation grids for the extreme ends of PC1 and PC2 on right humerus in distal view (identical to Appendix 32-Appendix 33).
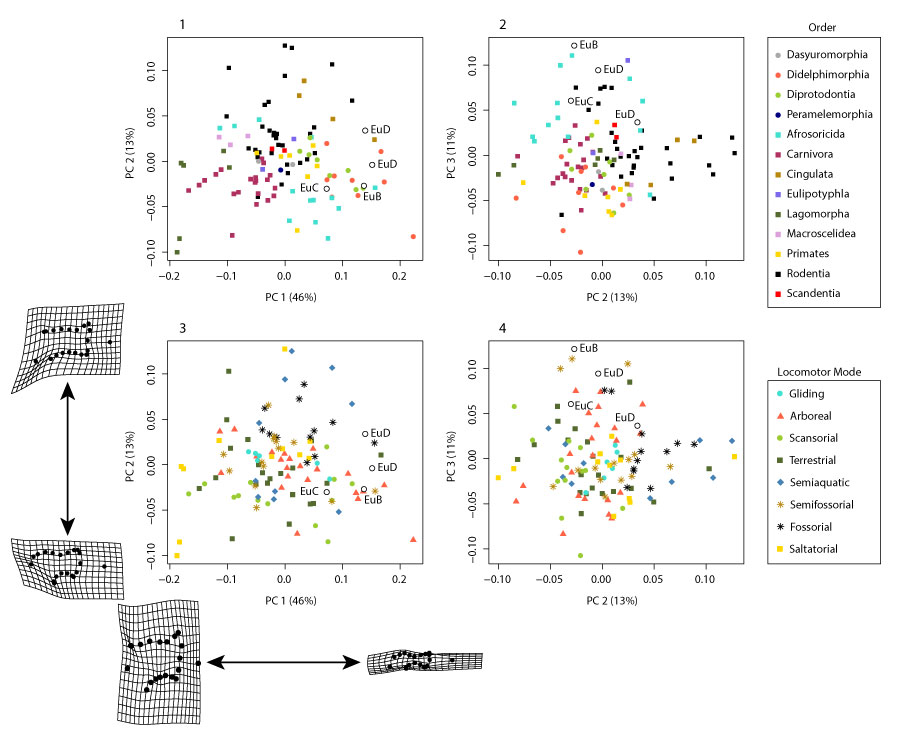
FIGURE 21. Plots of PCA of pruned dataset, color-coded for taxon (top) and locomotor group (bottom), with fossils (open circles) projected into the morphospace. (1) PC1 vs. PC2 and (2) PC2 vs. PC3 for all taxa (legend top right), and the same data for locomotor group (3-4; legend bottom right). Also included are the deformation grids for the extreme ends of PC1 and PC2.
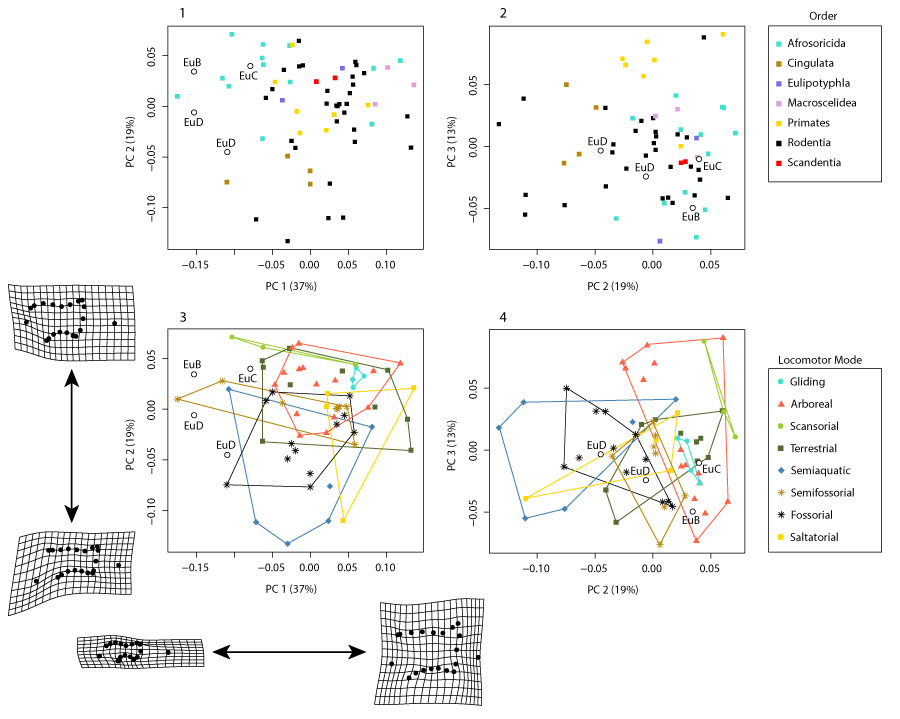
FIGURE 22. Plot of PC1 vs. PC2 for the pruned dataset with (1-8) each locomotor group plotted separately (data, legend, and fossil placement identical to Figure 21.3).
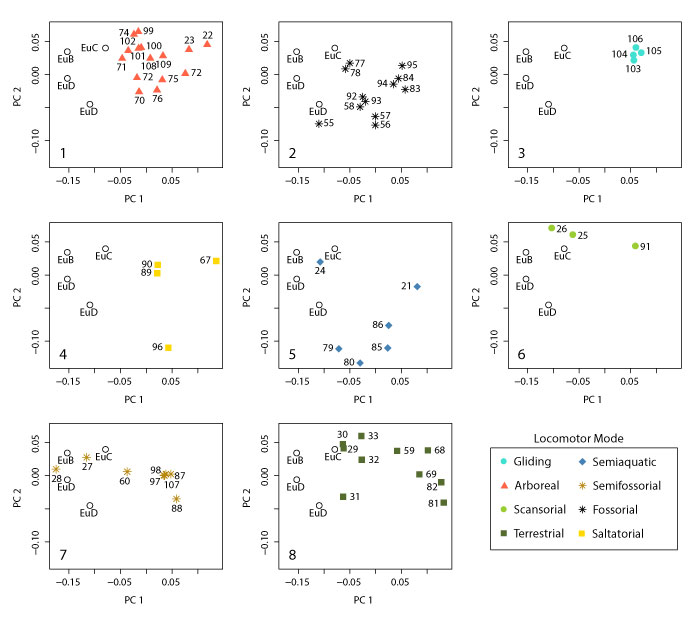
FIGURE 23. Plot of PC2 vs. PC3 for the pruned dataset with (1-8) each locomotor group plotted separately (data, legend, and fossil placement identical to Figure 21.4).
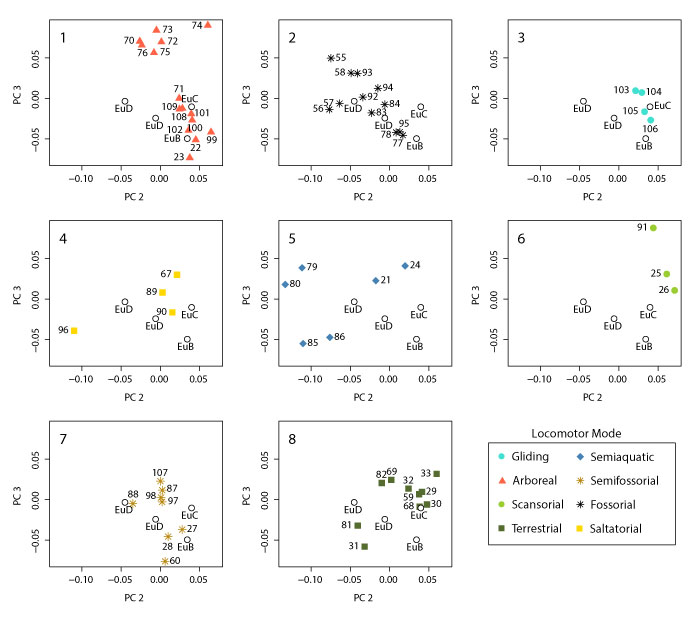
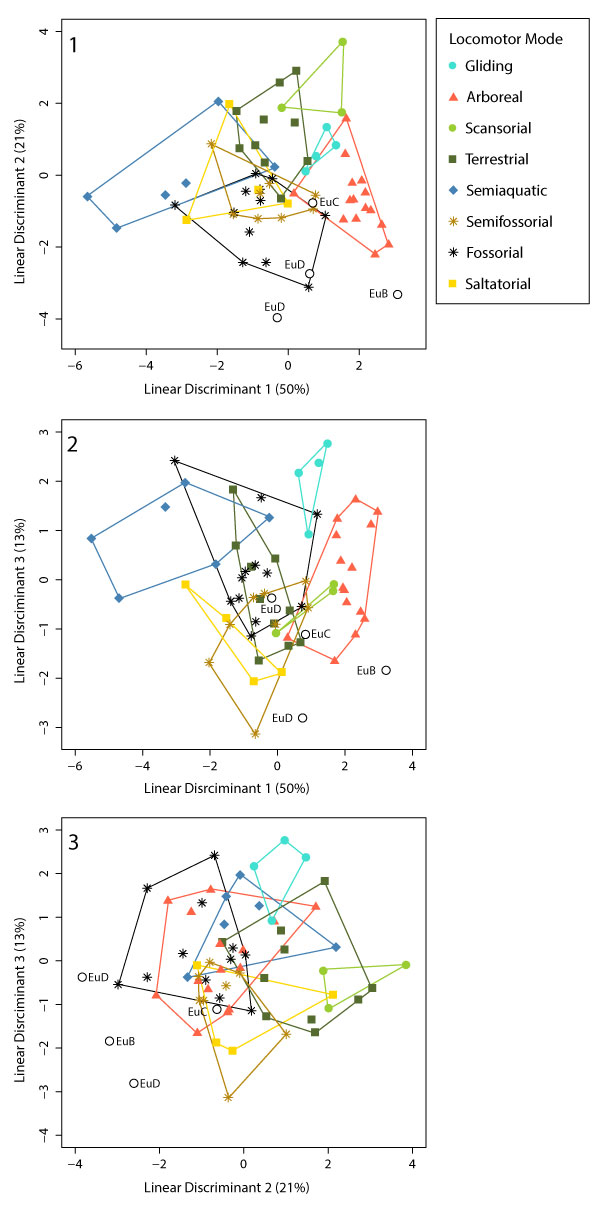
FIGURE 24. Plots of Linear Discriminant Analysis of the pruned dataset according to locomotor group. (1) LD1 vs. LD2; (2) LD1 vs. LD3; and (3) LD2 vs. LD3.