FIGURE 1. 1) Map of eastern Zealandia including New Zealand and the Chatham Islands, grey areas = emergent, grey outline = 2000 m isobath, boxed area is displayed in Figure 1.2. 2) Map of the Chatham Islands, grey areas = emergent, boxed area is displayed in Figure 1.3. 3) Geological map of the Waihere Bay area, northwest Pitt Island, fossil locality recorded in this study is indicated, age estimates from the following sources: Tupuangi Formation (Mildenhall, 1994; Mays and Stilwell, 2013), Kahuitara Tuff (Mildenhall, 1994; Stilwell, 1998), other estimates (Campbell et al., 1993; Panter et al., 2006). Modified from figures 1 and 3 of Mays et al. (2015b) with permission.
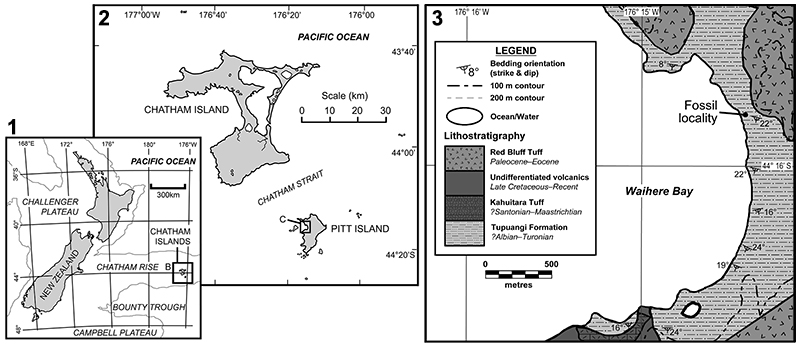
FIGURE 2. Austrosequoia novae-zeelandiae (Ettingshausen, 1887) Mays et al., 2017, PL1227. 1) Transverse section of a partially exposed, desiccated ovulate cone. 2) Neutron tomographic reconstruction largely encapsulated in sedimentary matrix, white indicates high neutron attenuation, oblique-transverse view. 3) Volume rendering of neutron tomographic reconstruction, RNA = Relative Neutron Attenuation, grid texture on RNA spectrum indicates relative transparency, regions of highest neutron attenuation represent in situ resin within cone axis and minor enclaves of resin near the distal ends of the bract-scale complexes, desiccation exhibited by large gaps in coalified organic remains (blue/green), oblique-transverse view. 4) Greyscale histogram from neutron tomographic reconstruction of PL1227 (16-bit) these values represent the neutron attenuation of the reconstructed volume, colours and transparency textures as per Figure 2.3, threshold values presented in Table 2, the spectrum has been cropped at the extremes for this graphical representation.
See Appendix for an animation of the virtually extracted specimen illustrated in Figure 2.3.
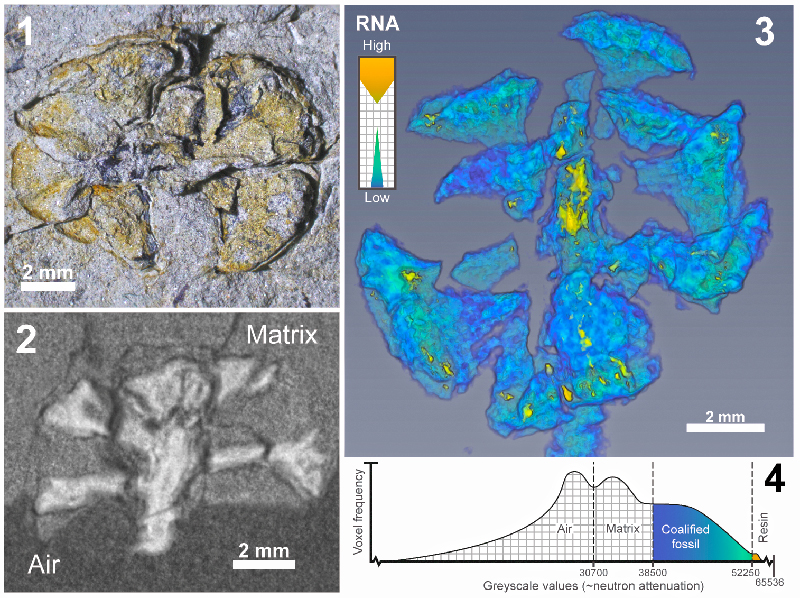
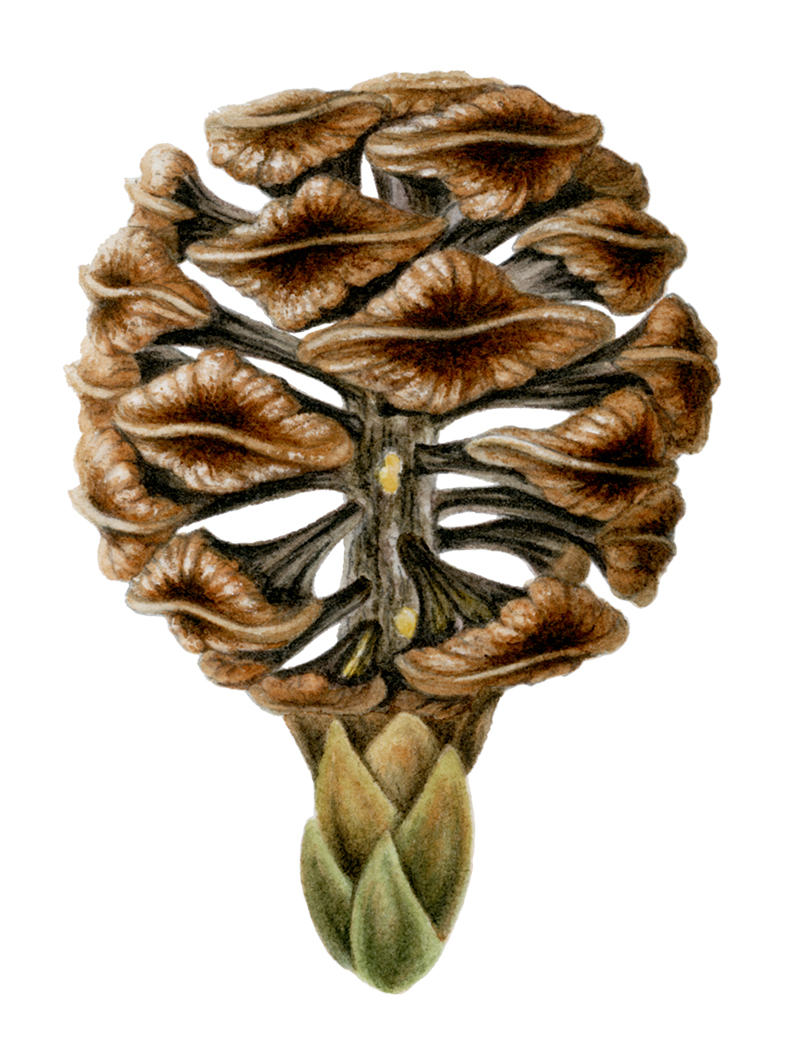
FIGURE 3. Artist’s reconstruction of ovuliferous cone and fertile shoot of Austrosequoia novae-zeelandiae (Ettingshausen, 1887) Mays et al., 2017, artist: Mali Moir.