FIGURE 1. During registration, sliding landmarks are allowed to move tangentially according to their neighborhood landmarks in order to minimize differences in terms of spatial distances or bending energy (1). Surface analysis can be useful to quantify 3D differences on smooth objects, like endocasts: frontal lobe differences between a modern human and an archaic human (2; after figure 3 of Beaudet and Bruner [2017]), and endocranial differences between modern human and chimpanzee (3; after figure 3 of Dupej et al. [2018]). In both cases, maps show, in red, regions of relative dilation in modern humans.
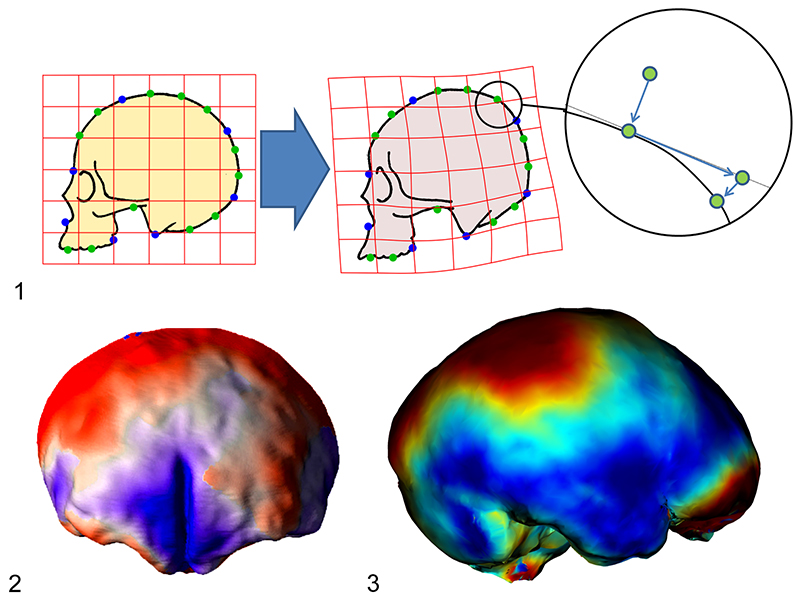
FIGURE 2. In anatomical regions which are not delimitated with homologous landmarks, surface analyses or sliding landmarks are not able to detect local differences, distributing equally the differences over the whole area. Apart from the lack of information, this can introduce a bias on the final output. The 3D form is interpreted as an undifferentiated object, and not as a specific anatomical system.
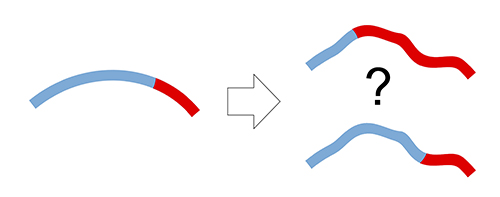
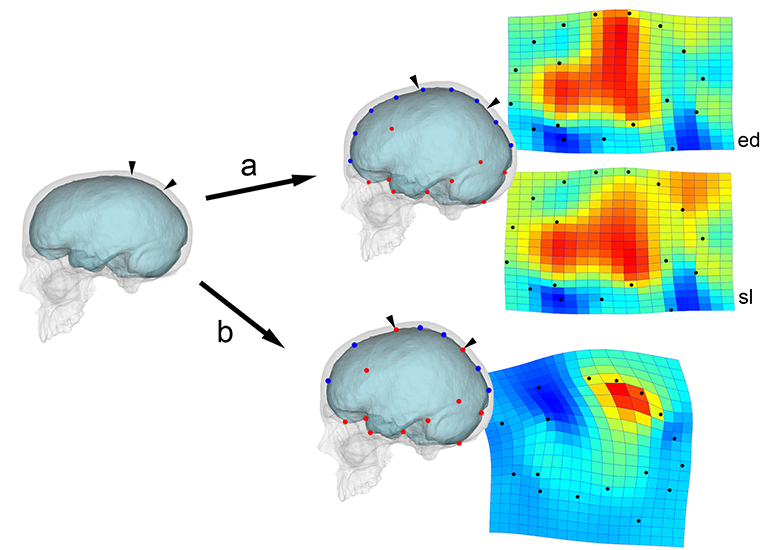
FIGURE 3. A digital model (skull and endocast) has been graphically deformed at the parietal surface, generating a flatter braincase (on the left). The differences from the original image is analyzed through thin-plate spline deformation grids, and expansion maps showing the areas undergoing dilation (red) and compression (blue). Knowing that the actual difference is due only to a marked parietal enlargement (small arrows), we used equally-spaced semi-landmarks (blue points) for the vault profile (a), without (ed) or after (sl) sliding according to a bending energy minimization criterion. The other landmarks have no specific meaning. The shape comparison gives the same importance to every landmark, “spreading” differences throughout the configuration. The parietal difference is interpreted as a more extended effect (mostly when landmarks can slide). The same comparison was computed using distinct spaced landmarks for the frontal, parietal, and occipital outlines separately, that is including the boundaries between the three districts in the model (b). In this case, the shape comparison is able to properly describe the geometrical expansion of the parietal morphology. For this visual example, we used an interpolant function, but a similar effect can be found in every registration procedure (such as Procrustes superimposition or point-to-point minimization in surface analysis) when information on anatomical boundaries and local proportions is not included. Comparisons were computed with PAST 2.17c (Hammer et al., 2001).