FIGURE 1. Schematic stratigraphic column of type section Turtle Bluff Member, Bridger Formation, on southwest flank of Cedar Mountain, Uinta County, Wyoming, showing relative stratigraphic positions of SDSNH, DMNH and UCM localities (along with the locality names in parentheses) that yielded the fossils described in this paper and U-Pb CA-TIMS dates for two tuffs (stratigraphic column reproduced and modified from Kelly and Murphey, 2016a). Locality MPM 2970 occurs on southwest flank of Sage Creek Mountain and its approximate relative stratigraphic position is projected onto type section. Abbreviations are: Lithostr., lithostratigraphic; NALMA, North American Land Mammal age.
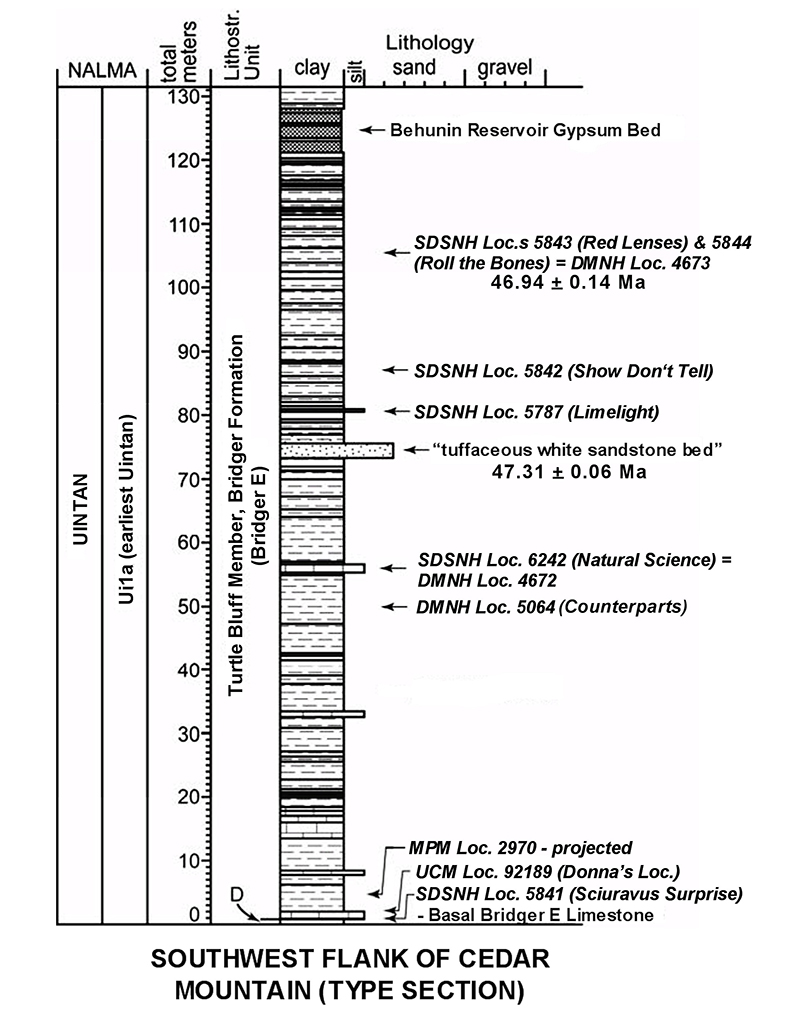
FIGURE 2. Examples of zircon subpopulations recovered from TBM tuff sample PCM3 Aug14-04, shown in their approximate abundances. Longitudinal bubble tracks and elongate habits (upper right) are typical of ash-fall zircons. CA-TIMS dating was limited to single zircons from the ash-type and euhedral subpopulations. The rounded grains are likely to be older, detrital grains incorporated into the tuff during deposition. Scale bars in micrometers (μm).
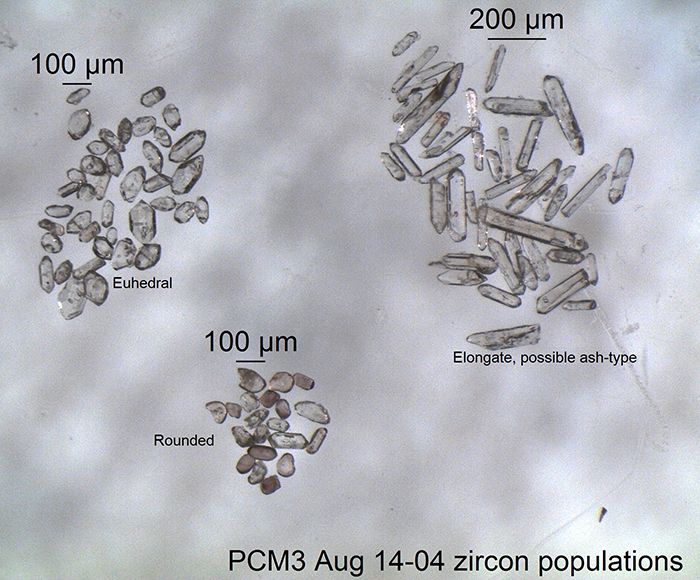
FIGURE 3. Examples of zircon subpopulations recovered from TBM tuff sample PCM3 Aug14-07, shown in their approximate abundances. Elongate, ash-type zircons were only a minor component in the total zircon yield. CA-TIMS dating was limited to single zircons from the elongate and euhedral subpopulations. Most of these analyses gave dates ca. 47.0 Ma, but two single-grain analyses, sK (47.8 Ma) and sM (612 Ma) demonstrated that some older, euhedral, detrital grains were incorporated into the tuff during deposition. Scale bars in micrometers (μm).
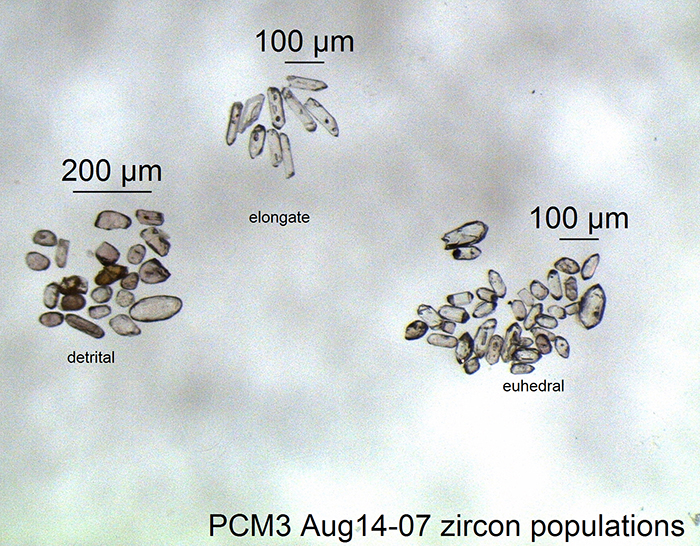
FIGURE 4. Concordia Age plot for sample PCM3Aug14-04. Data have been corrected for 230Th disequilibrium.
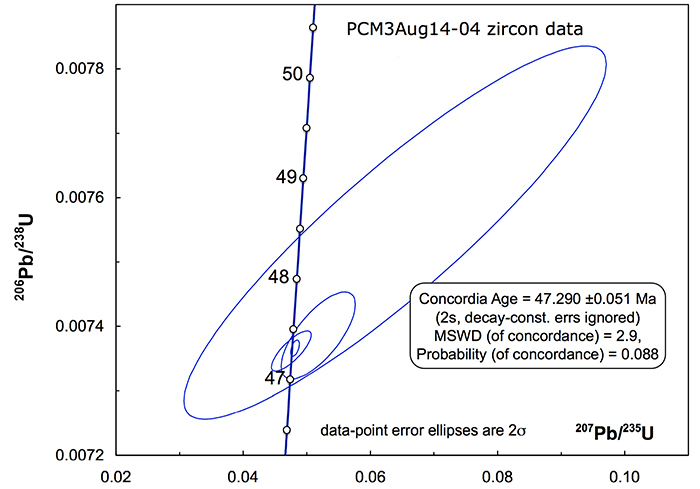
FIGURE 5. Weighted mean 206 Pb/ 238 U plot for CA-TIMS zircon data from PCMAug14-04. All four analyses were included in the weighted mean calculation (green bar).
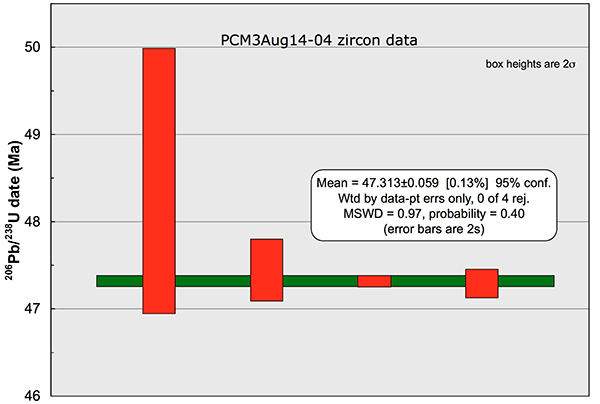
FIGURE 6. Concordia plot for sample PCM3Aug14-07. Spread of analyses from ca. 48 to 46.5 Ma is interpreted to reflect minor inheritance or differing magma chamber residence times. The best estimate of the ash-fall date comes from weighted mean date of youngest six analyses (see Figure 7). Data from single grain M (sM) plots off the figure, concordant at 612 Ma (Table 1).
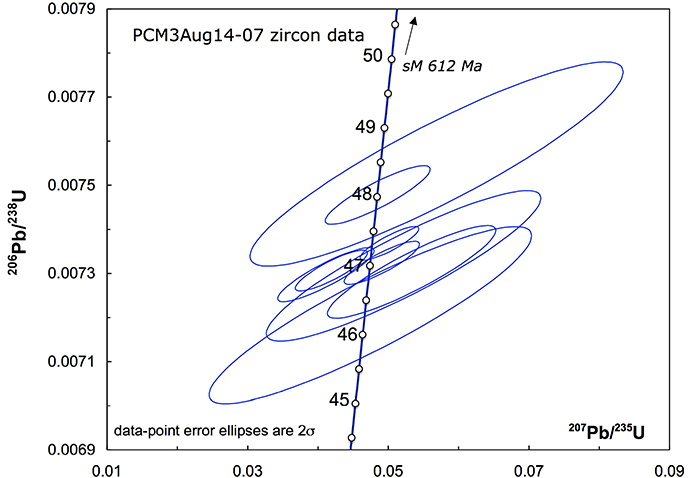
FIGURE 7. Weighted mean 206 Pb/ 238 U plot for CA-TIMS U-Pb zircon data from sample PCMAug14-07. Data from gray boxes (sG, sK, sI) were excluded from calculation, as they do not overlap the weighted mean (green bar) from the youngest six analyses.
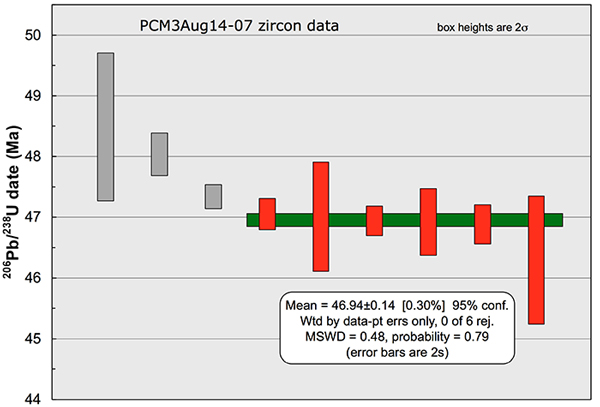
FIGURE 8. Comparison of weighted mean 206 Pb/ 238 U dates of two samples from the TBM, Bridger Formation. Precisions exclude tracer and decay constant uncertainties as these are systematic for both samples. Dates require a minimum of 174 kyr between deposition of these two strata and a maximum of 572 kyr.
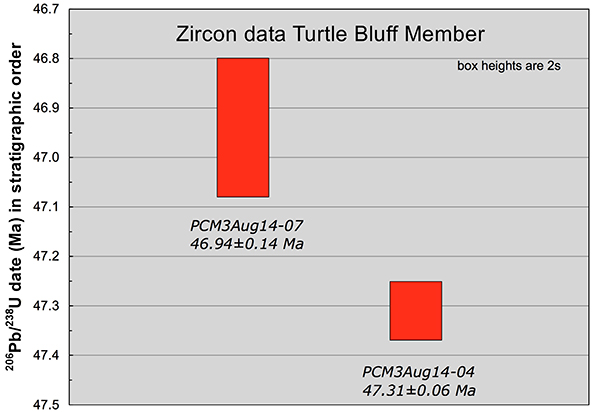
FIGURE 9. Equal area projection of site mean directions that satisfied the Watson test for randomness (Table 2). Open (closed) symbols are on the upper (lower) hemisphere. Directions are shown in geographic coordinates, but beds dip no more than 2 degrees. Open point and dotted circle represent the overall mean direction and 95% cone of confidence.
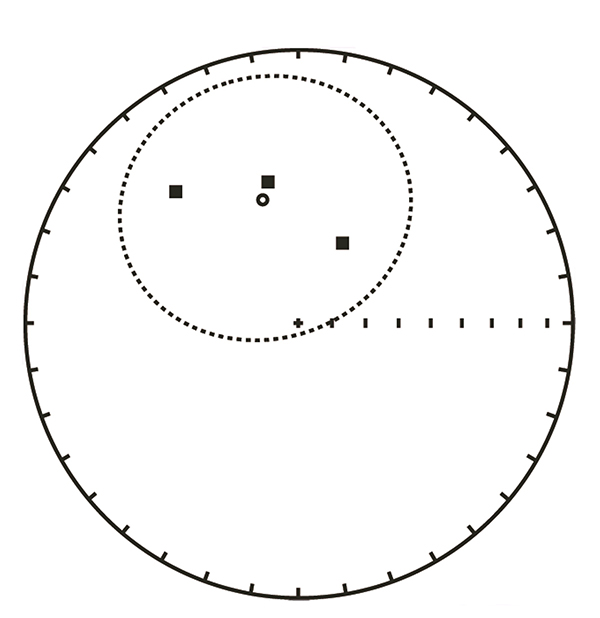
FIGURE 10. Schematic stratigraphic columns of the upper part of the Twin Buttes Member and Turtle Bluff Member (TBM), Bridger Formation, on Sage Creek and Cedar Mountains showing magnetostratigraphy and radioisotopic dates relative to biochrons Br3 (late Bridgerian) and Ui1a (earliest Uintan). Sage Creek Mountain magnetostratigraphic section (shown on left) with key stratigraphic levels from Tsukui (2016, figure 2.5). Paleomagnetic sample, PCM7Sept15-01, analyzed in this paper was collected from uppermost Twin Buttes Member tuff, which occurs about 8 m below the Basal E limestone (= base of the TBM) on Sage Creek Mountain, and corroborates the Sage Creek Mountain magnetostratigraphic section of Tsukui (2016). Paleomagnetic samples (PCM6Sept15-02 and PCM6Sept15-03) analyzed in this paper were collected from the tuffaceous white sandstone, which occurs at 74-75 m above the Basal E limestone (= base of the TBM) on Cedar Mountain. Most recent competing dates for boundary between Chrons C21r and C21n are also shown (Ogg, 2012 [GPTS]; Westerhold et al., 2015; Tsukui, 2016). Abbreviations are: Brid, Bridger; Congl, conglomerate; BC, biochron; MS, magnetostratigraphy. 40 Ar/ 39 Ar dates are from Smith et al. (2008, 2010).
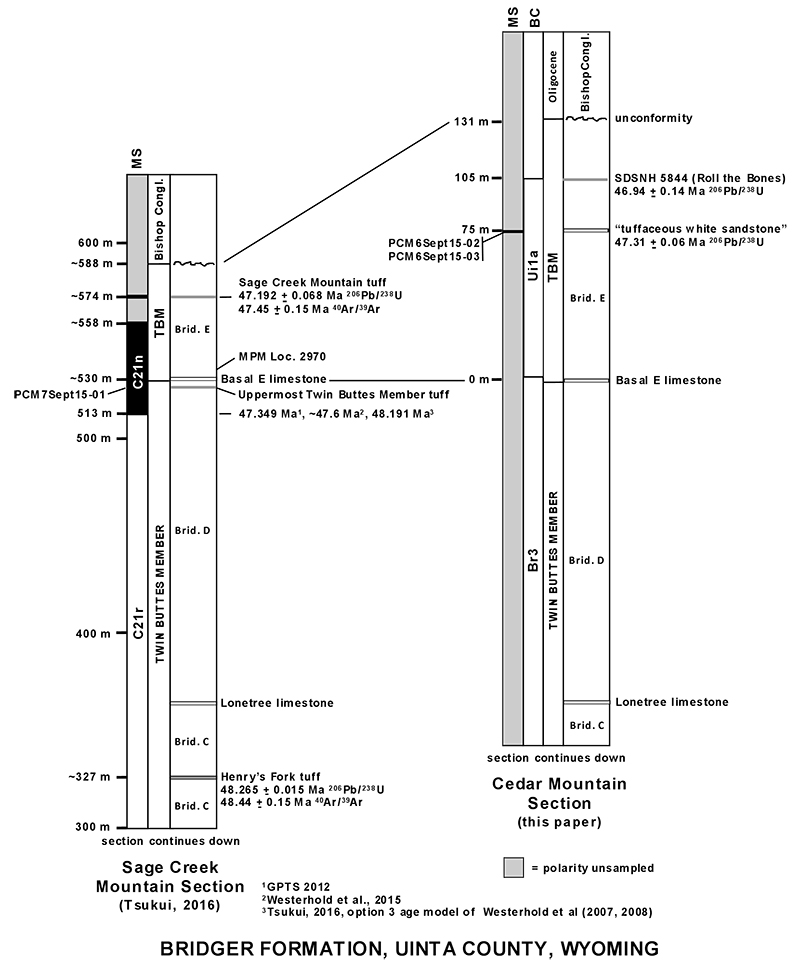
FIGURE 11. Upper molars of Herpetotherium knighti: 1, LM1, SDSNH 110429; 2, RM1, DMNH 75286; 3, LM2, UCM 68793; 4, LM2, UCM 70637; 5, RM2, UCM 95783; 6, RM2, UCM 70639; 7, RM3, UCM 68794; 8, RM3, UCM 73770; 9, RM4, UCM 95784. All occlusal views. Scale bar = 1 mm.
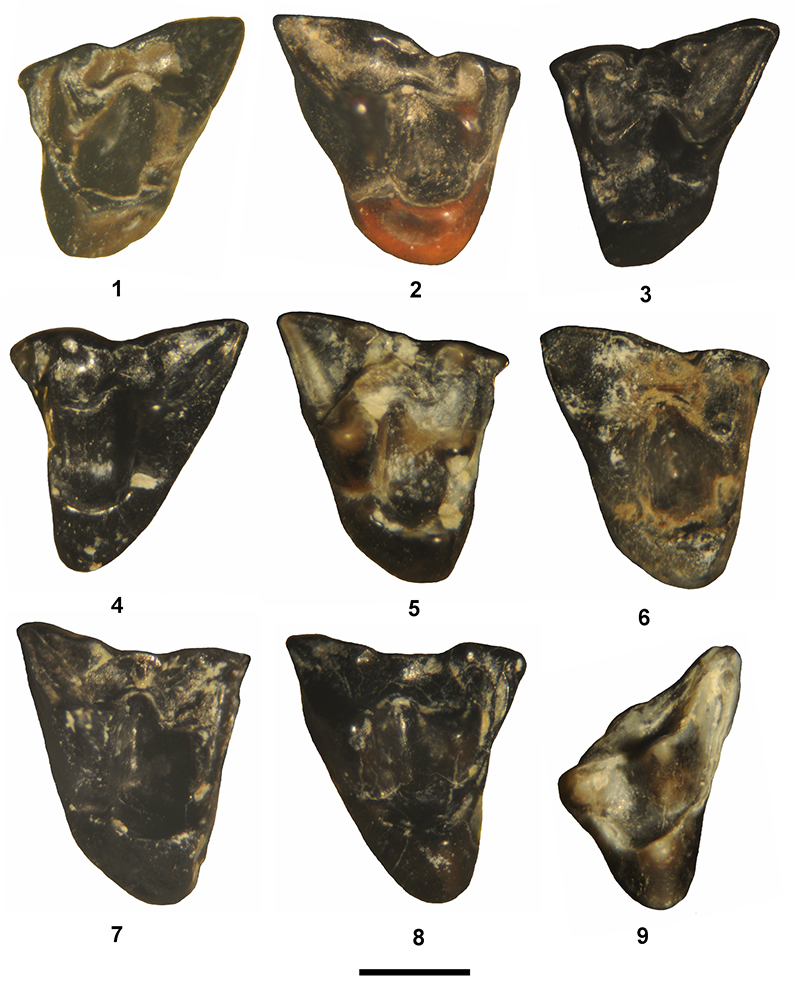
FIGURE 12. Lower cheek teeth of Herpetotherium knighti from TBM: 1, Rdp3?, UCM 68902; 2, Rm2-3, UCM 68574; 3, Rm1, UCM 95792; 4, Lm3-4, UCM 95780; 5, Lm2 or 3, SDSNH 110339; 6, partial Rm2 or 3, SDSNH 110427; 7, Lm2 or 3, UCM 70977; 8, Rm2 or 3, UCM 95785; 9, Rm4, UCM 67896; 10, Rm4, UCM 95793. All occlusal views. Scale bar = 1 mm.
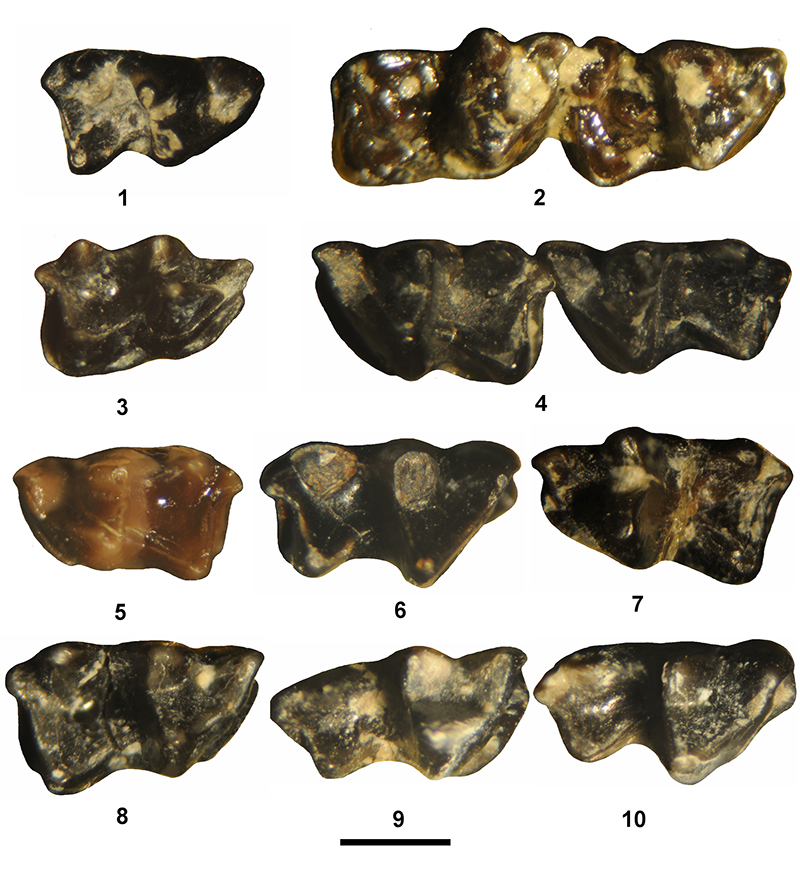
FIGURE 13. Upper and lower dentition of Peradectes from TBM. 1-4, Peradectes chesteri: 1, RdP3, DMNH 75275; 2, LM1, UCM 68427; 3, LM2-3, UCM 95781; 4, Lm2 or 3, UCM 78458. 5, Peradectes californicus, Rm2 or 3, SDSNH 110432. All occlusal views. Scale bar = 1 mm.
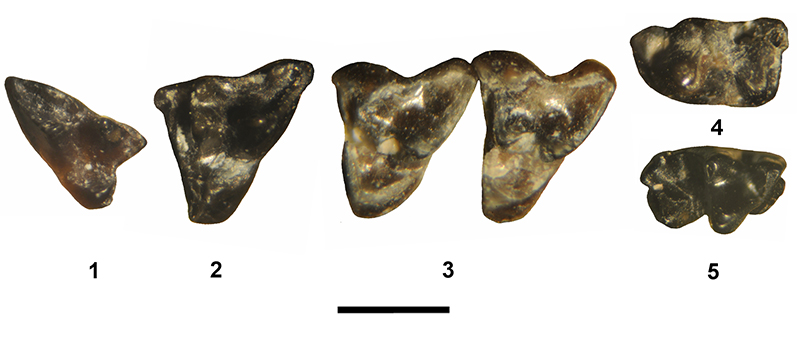
FIGURE 14. Schematic stratigraphic column of Devil's Graveyard Formation, Trans Pecos, Texas, showing correlation of magnetostratigraphy to biochrons of the Uintan North American Land Mammal age. Magnetostratigraphic sections after Walton (1992) and Prothero (1996b). Abbreviations are: BC, biochron; BTLF, Basal Tertiary Local Fauna; Congl., conglomerate; L.F., local fauna; MS, magnetostratigraphy.TMM, Texas Memorial Museum localities; Var., variegated.
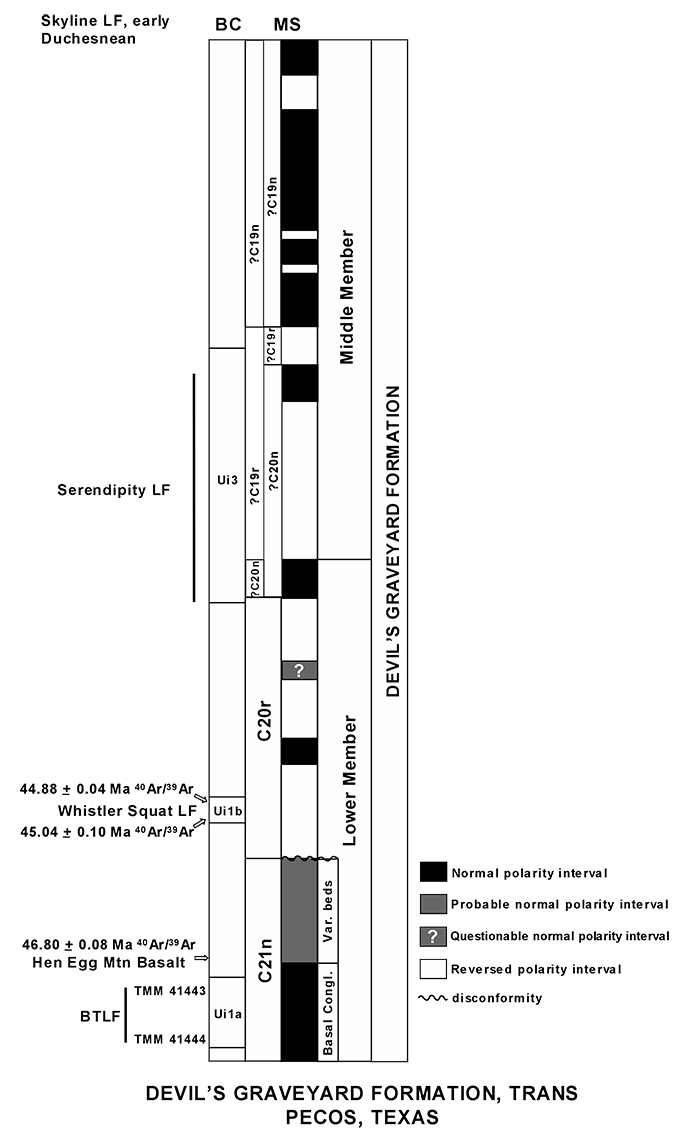
FIGURE 15. Schematic stratigraphic columns of west central and eastern sections of Uinta Formation, Uinta Basin, Utah, showing correlations of magnetostratigraphy to biochrons of the Uintan North American Land Mammal age. Sections modified after Prothero (1996a) and Kelly and Murphey (2012). Note that no Ui1a faunas are currently recognized from the Uinta Formation due to the lack of diagnostic mammal fossils (see text for discussion). Abbreviations are: BC, biochron; Cyn, Canyon; Du, Duchesnean North American Land Mammal age; Fm., formation; GRFm, Green River Formation; Mbr, member; MS, magnetostratigraphy.
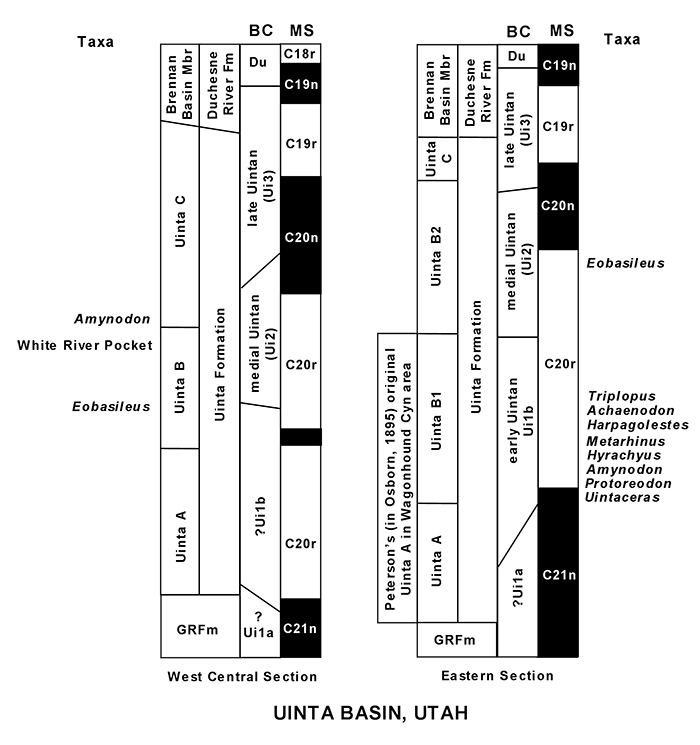
FIGURE 16. Schematic stratigraphic column of Washakie Formation, Washakie Basin, Wyoming, showing correlations of biochrons of the late Bridgerian through middle Uintan North American Land Mammal ages to the magnetostratigraphy. Alternative magnetostratigraphic correlation D of McCarroll et al. (1996a) as preferred by Walsh (1996a) and Tsukui (2016). Marker beds after Roehler (1973). Adobe Town Member upper subunit not included because its polarity is undetermined. Note that no Ui1a faunas are currently recognized from the Washakie Formation of the Washakie Basin due to the lack of diagnostic mammal fossils (see text for discussion). Abbreviations are: BC, biochron; GRFm, Green River Formation; MS, magnetostratigraphy; REBM, Robin's Egg Blue marker bed.
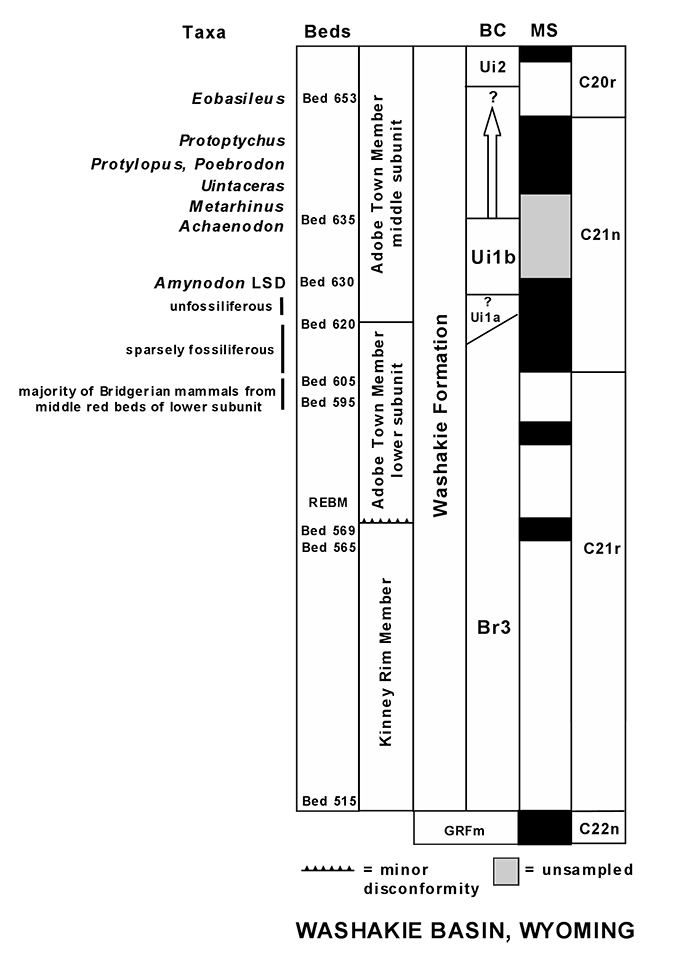
FIGURE 17. Composite schematic stratigraphic section of the Washakie Formation, Sand Wash Basin, Colorado, showing two alternative correlations of the magnetostratigraphy by Stucky et al. (1996). Marker beds after Roehler (1973). Note that separation of Br3, Ui1a, and Ui1b faunas cannot be confidently determined for the main upper section because the precise stratigraphic levels of almost all of the Sand Wash Basin localities relative to the section are unknown and detailed systematic accounts of many of the taxa from these localities are lacking (see text for discussion). Abbreviations are: MS, magnetostratigraphy; REBM, Robin's Egg Blue marker bed; WB, Washakie Basin.
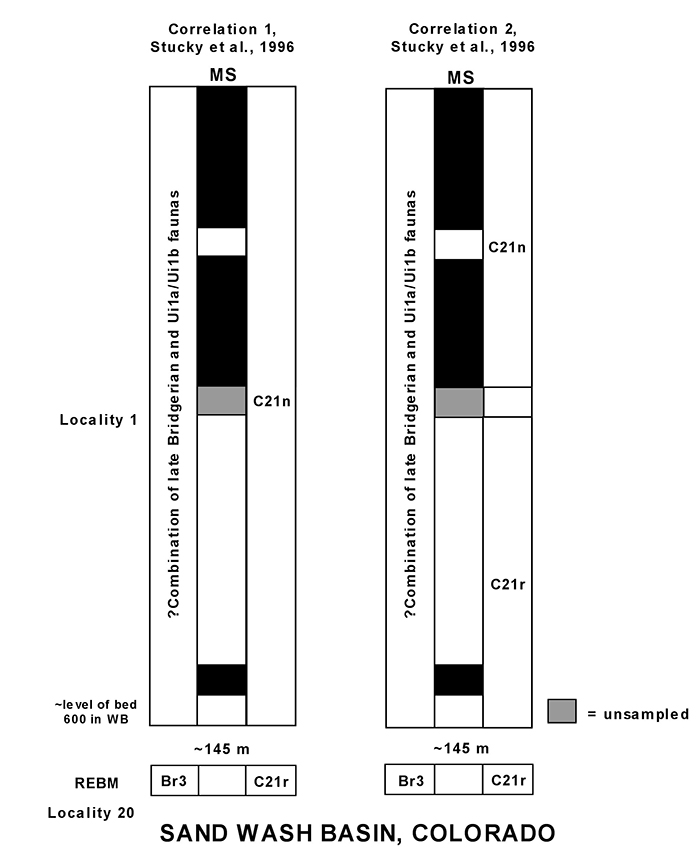
FIGURE 18. Schematic stratigraphic section of Aycross and Tepee Trail formations, Absaroka Range, Wyoming, showing correlation of magnetostratigraphy to biochrons of Bridgerian and Uintan North American Land Mammal ages. Magnetostratigraphic correlation to the GPTS according to Sundell et al. (1984), Walsh et al. (1996a), and Tsukui (2016). Note that no Ui1a faunas from the lower part of the Tepee Trail Formation are recognized due to the lack of mammal fossils (see text for discussion). Abbreviations are: BC, biochron; BPM, Blue Point marker bed; Fm., formation; LSD, lowest stratigraphic datum; MS, magnetostratigraphy; UCMP V-, University of California, Berkeley, Museum of Paleontology vertebrate locality.
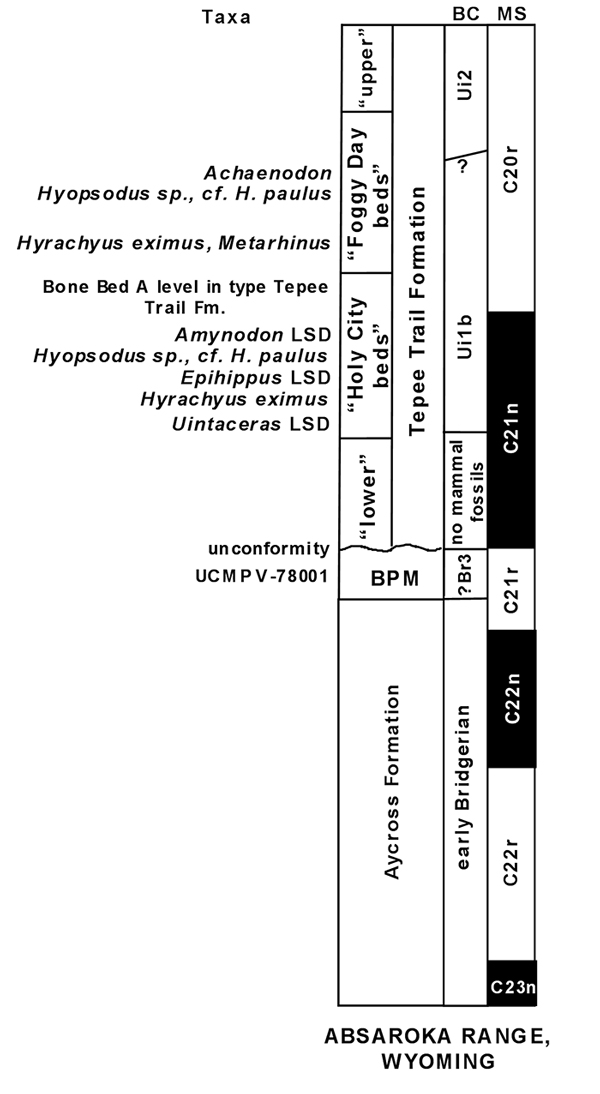
FIGURE 19. Schematic stratigraphic section of Eocene formations of the Greater San Diego area, southern California, showing correlation of magnetostratigraphy to biochrons of the Uintan North American Land Mammal age. Section modified after Walsh (1996b) and Walsh et al. (1996). Note that no Ui1a faunas are recognized from the greater San Diego area (see text for discussion). Abbreviations are: BC, biochron; Est-a, upper Stadium Conglomerate; Est-b, lower Stadium Conglomerate; Et-ss, Torrey Sandstone; F, fauna; LF, local fauna; MS, magnetostratigraphy.
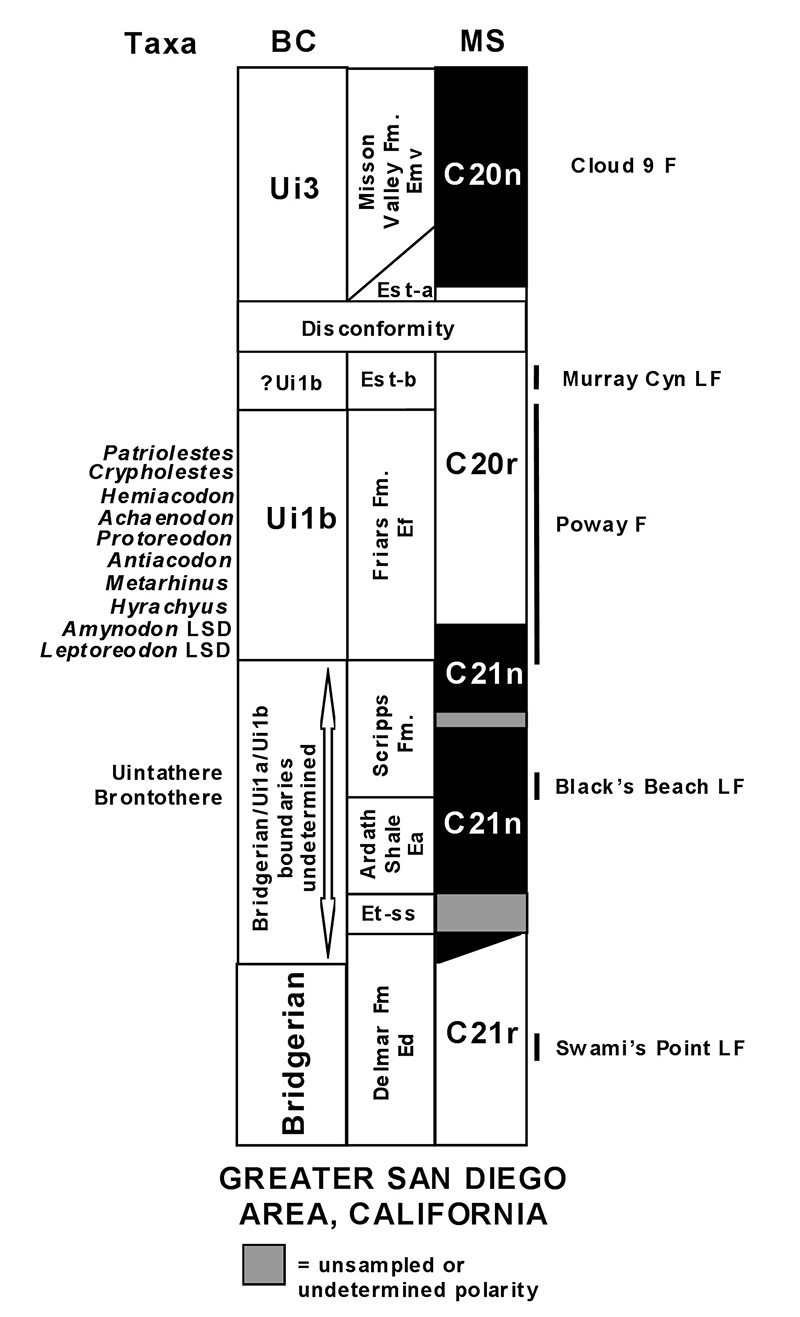
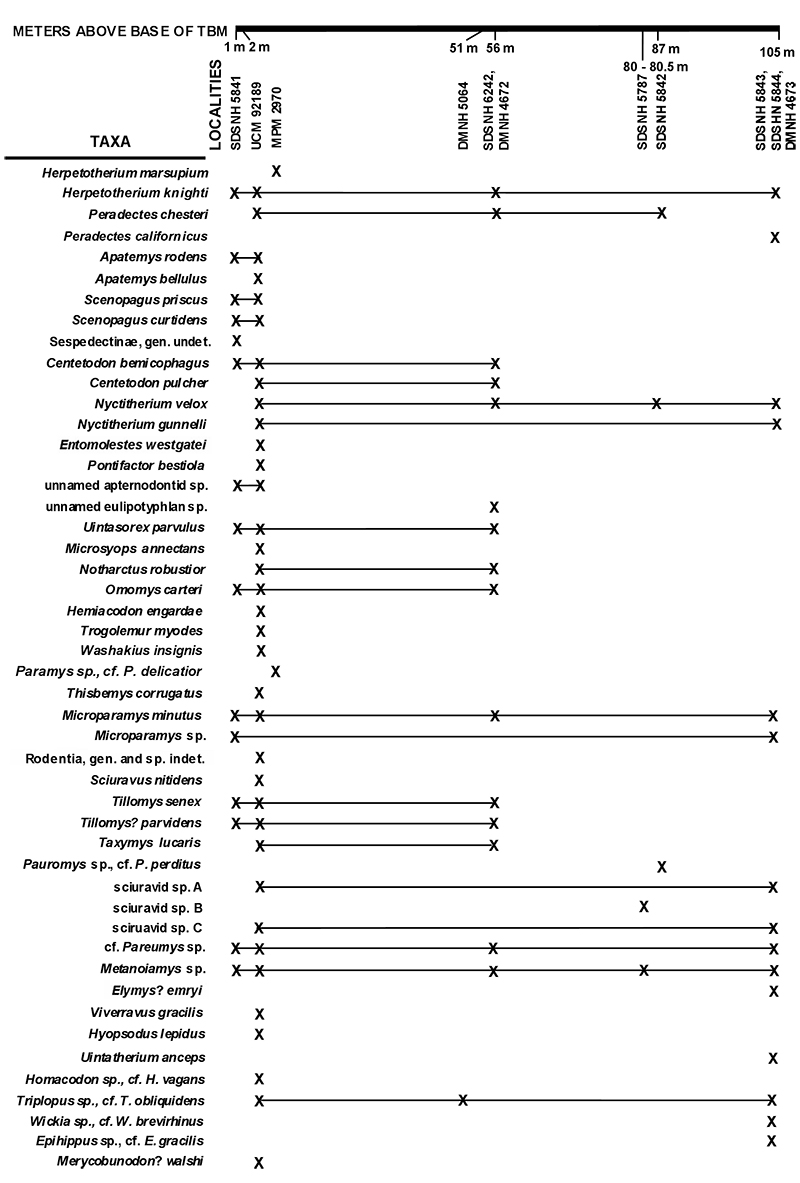
FIGURE 20. Stratigraphic distributions of mammal taxa comprising the TBM Fauna from the Turtle Bluff Member, Bridger Formation, southeastern Wyoming.