

FIGURE 1. Generalized location map of the type locality of Gordodon kraineri in southern New Mexico, and measured stratigraphic section (after Krainer et al., 2003) showing the stratigraphic horizon of the type locality in the lower part of the Bursum Formation.
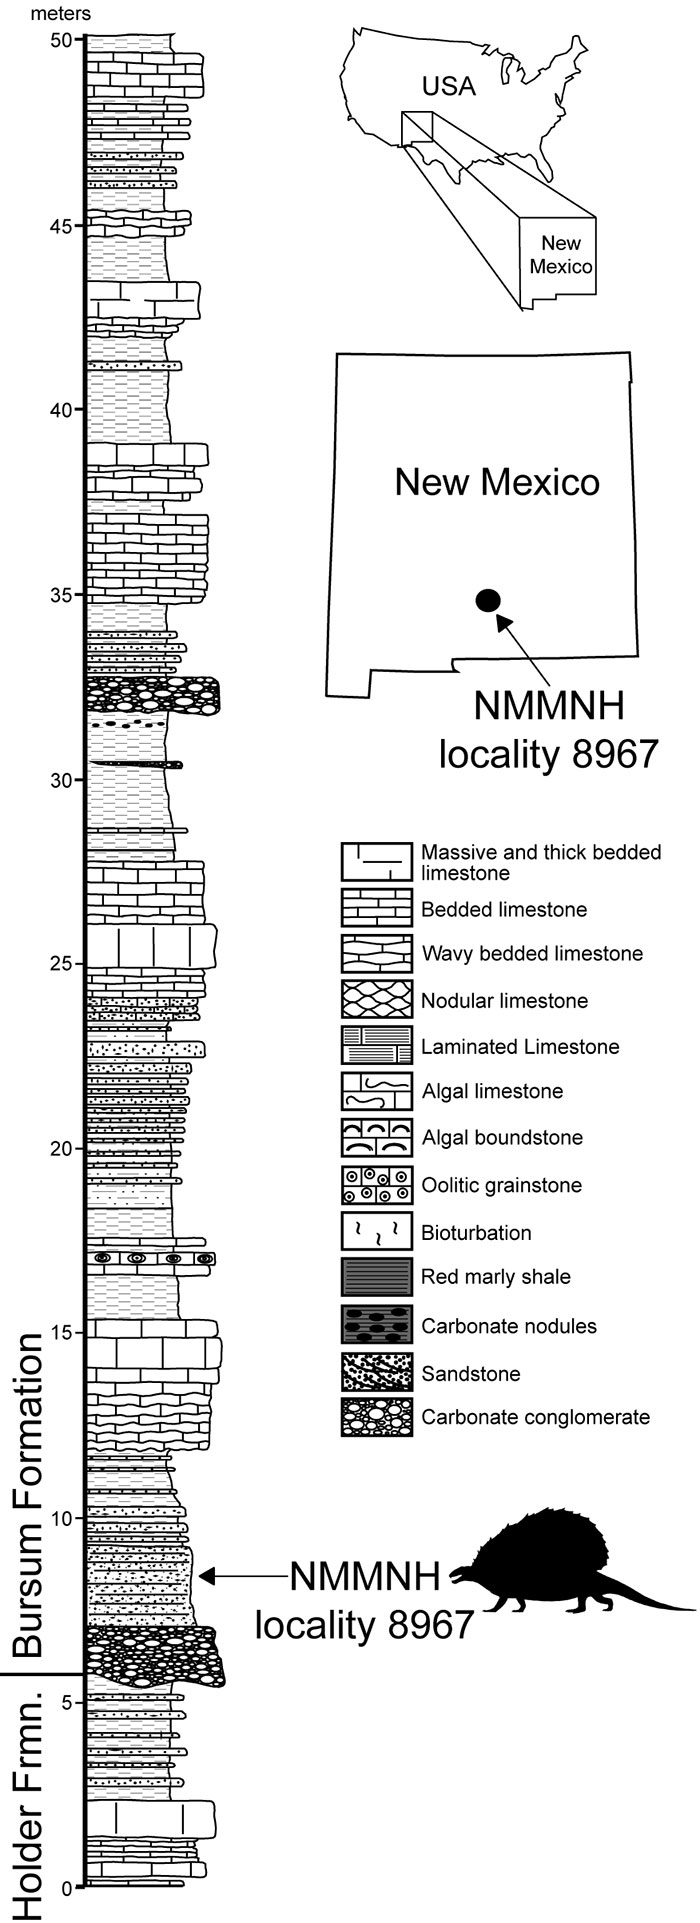
FIGURE 2. Holotype skull, lower jaw and incomplete postcranium of Gordodon kraineri, NMMNH P-70796, photograph (1) and bone map (2). For anatomical abbreviations see the caption to Figure 7. Scale equals 10 cm.
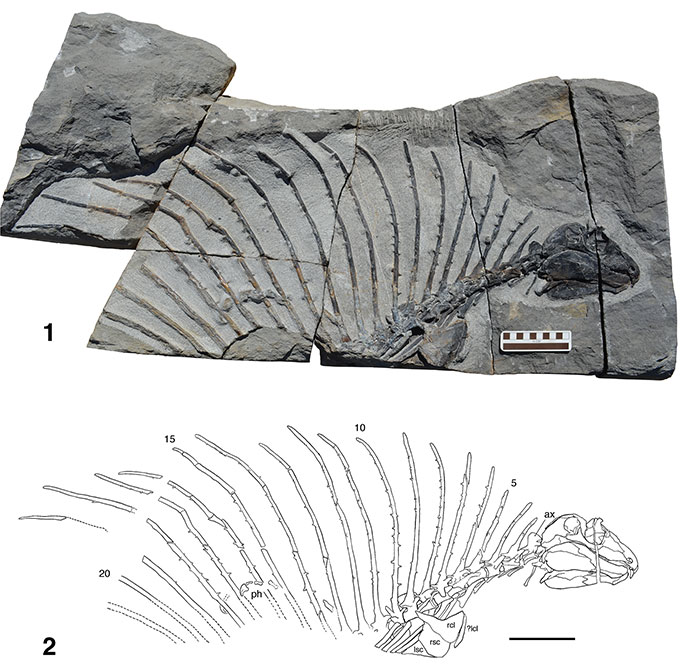
FIGURE 3. The skull and lower jaw, as preserved, of the holotype of Gordodon kraineri, NMMNH P-70796, in right lateral view, photograph (1) and line drawing (2). Anatomical abbreviations are: an = angular; ar = articular; d = dentary; ep = epipterygoid; f = frontal; l = lacrimal; m = maxilla; mtp = mandibular tooth plate; n = nasal; p = parietal; pf = postfrontal; pm = premaxilla; pr = prearticular; prf = prefrontal; pt = pterygoid; q = quadrate; qj = quadratojugal; sa = surangular; sm = septomaxilla; spl = splenial; sq = squamosal; st = supratemporal; t = tabular; v = vomer. Scale equals 1 cm.
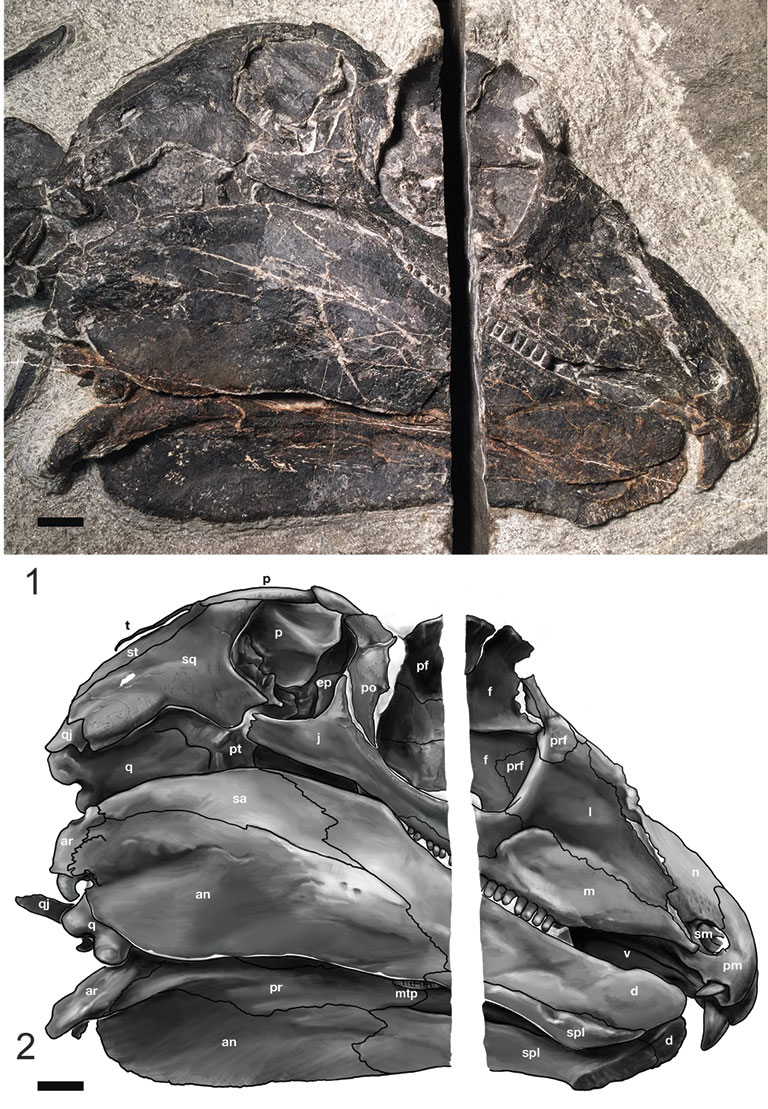
FIGURE 4. Reconstructed skull of Gordodon kraineri in dorsal (1) and right lateral view (2). Scale equals 1 cm.

FIGURE 5. Stereophotograph of the snout region of NMMNH P-70796, holotype of Gordodon kraineri. Scale in cm and mm.
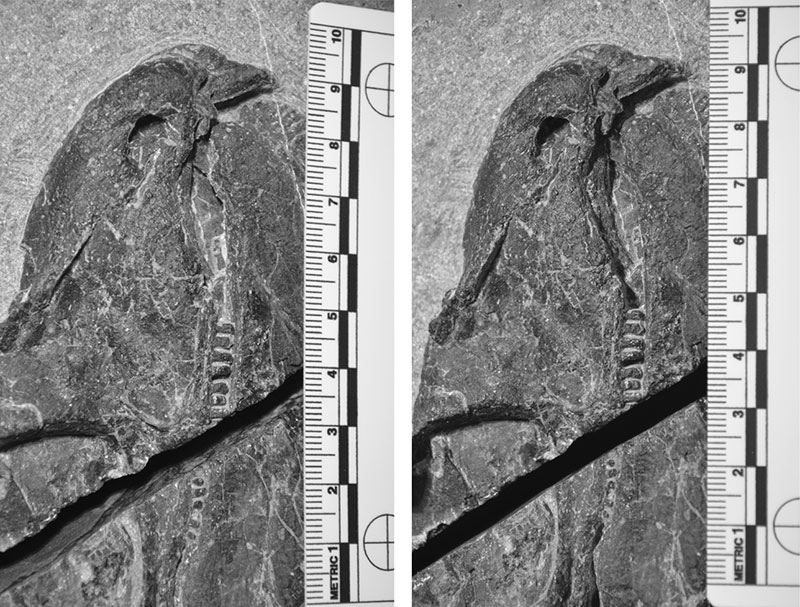
FIGURE 6. Labiolingual strength profile of the Gordodon incisor in relative units. Circles with solid line curve fit shown with bending moment curves based on height2 (squares with short dash line) and height3 (triangles with long dash line) scaled for comparison to the strength profile curve.
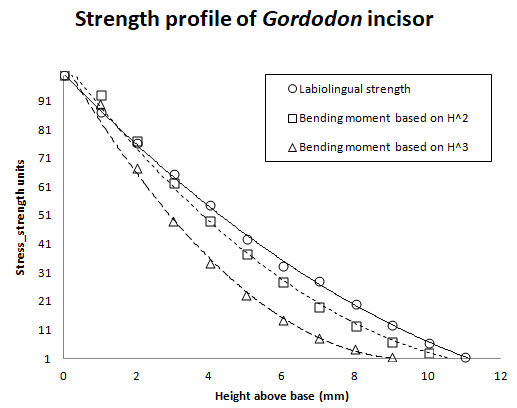
FIGURE 7. Interpretive drawing of NMMNH P-70796. Anatomical abbreviations are: atl = atlas; ax = axis; cvr = cervical ribs; dr = dorsal ribs; lcl/rcl = left/right clavicle; lsc/rsc = left/right scapulocoracoid; ph = ?manual phalanges. Scale bars equal 10 cm.
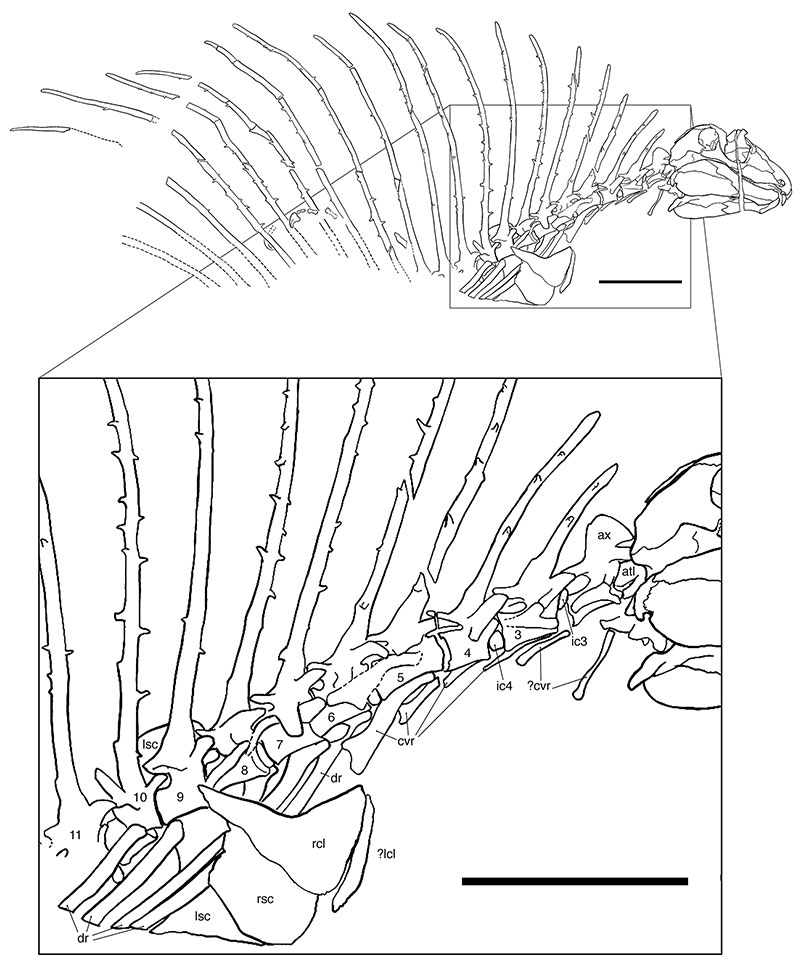
FIGURE 8. Metrics and statistics of the vertebral column as preserved in the holotype of Gordodon kraineri, NMMNH P-70796. 1, Lengths (maximum anteroposterior extent, per Romer and Price, 1940) of the intercentra and centra of vertebrae two through 10, showing monotonic decrease in the length of both elements over the range. 2, Ratio of intercentrum to centrum length (%) decreases from vertebra number two through number 10 as shown by the negative slope of the curve fit, i.e., centrum length decreases at a higher rate than intercentrum length; proceeding posteriorly along the vertebral column the intercentrum becomes relatively longer.
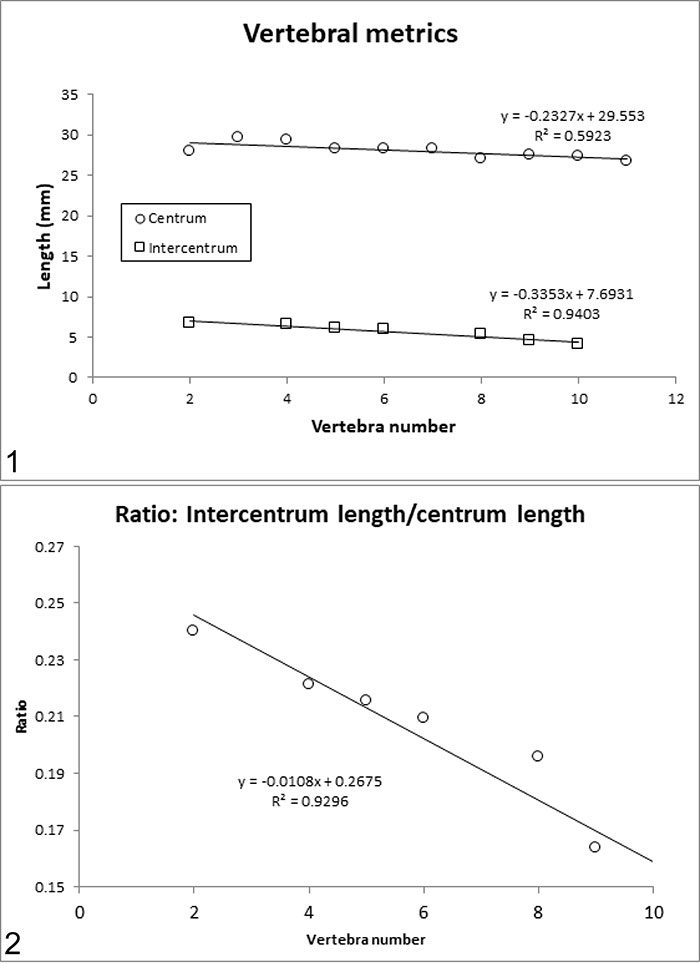
FIGURE 9. Metrics and statistics of the vertebral column as preserved in the holotype of Gordodon kraineri, NMMNH P-70796. 1, Neural spine length increases moving posteriorly along the vertebral column for at least the first 14 vertebrae. 2, Scatterplot of tubercle diameter (measured at 1/2 length) as a function of length. The relationship of diameter to length is very weak; diameter essentially cannot be predicted by length.
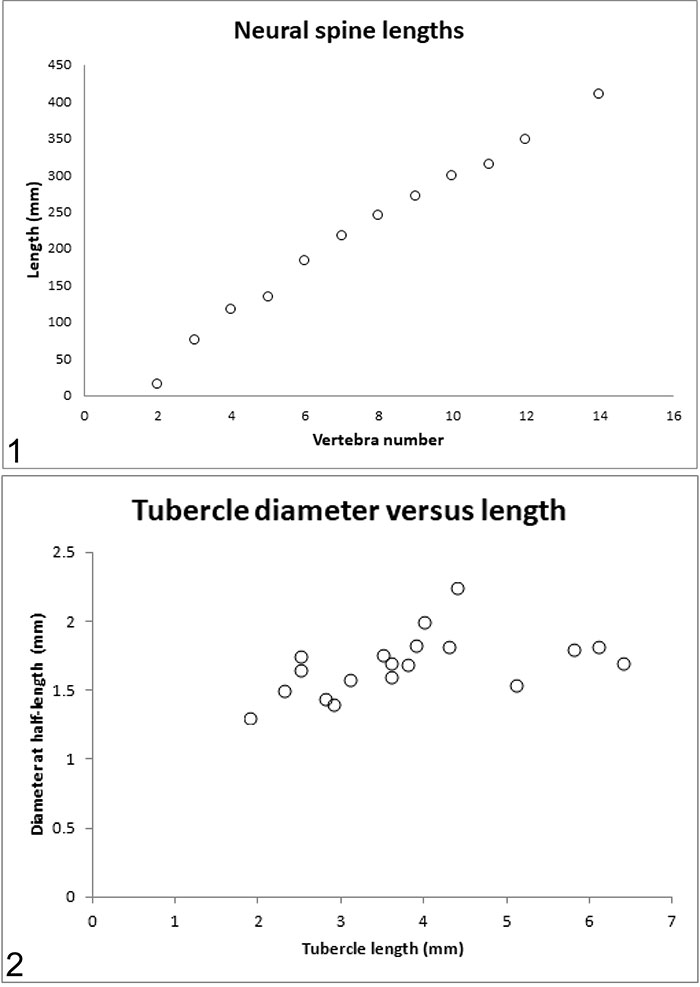
FIGURE 10. Metrics and statistics of the vertebral column as preserved in the holotype of Gordodon kraineri, NMMNH P-70796. 1, Tubercle diameter (measured at 1/2 length) is not organized with respect to height above the base of the neural spine. Tubercle diameter cannot be predicted by position along the length of the neural spine. Data from neural spines 4, 7, and 10. 2, Tubercle spacing distribution: histogram with normal curve fit and cumulative probability plot with 95% normal confidence intervals. Spacing between tubercles is normally distributed, and they do not occur in opposing pairs except by random chance. Data from neural spines 4, 7, 8, and 10. N = 36.
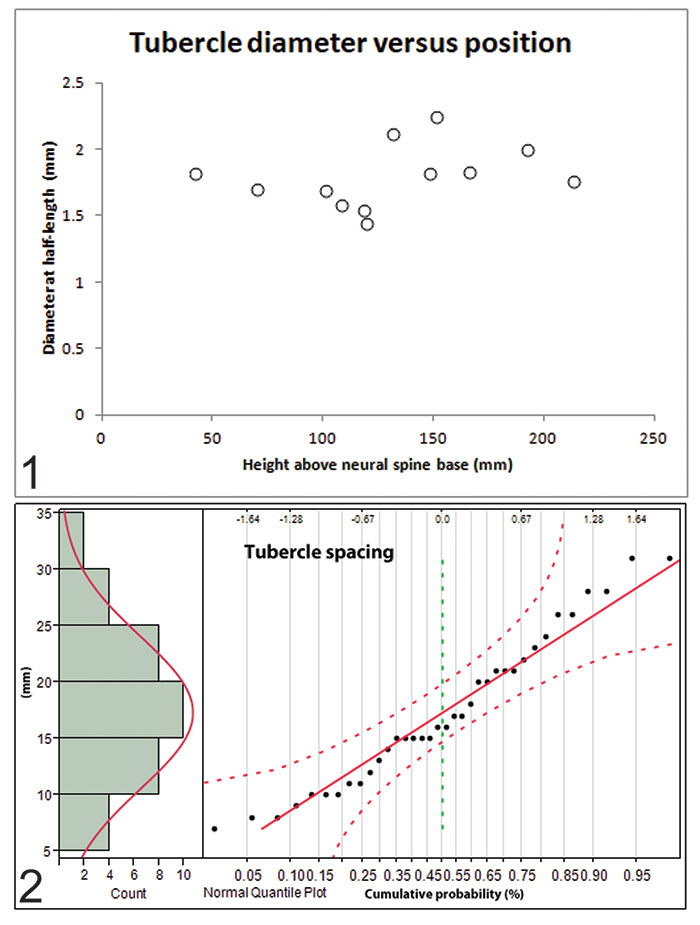
FIGURE 11. Metrics and statistics of the vertebral column as preserved in the holotype of Gordodon kraineri, NMMNH P-70796. 1, Tubercle length distribution: histogram with normal curve fit and probability plot with 95% normal confidence intervals. Tubercle lengths are normally distributed. Data from neural spines 4, 7, and 10. N = 19. 2, Tubercle diameter distribution, measured at 1/2 length: histogram with normal curve fit and probability plot with 95% normal confidence intervals. Tubercle diameters are distributed normally. Data from neural spines 4, 7, and 10. N = 19.

FIGURE 12. Distribution of tubercles along the length of the neural spines in Gordodon and Edpahosaurus. 1, Examples of linear distribution types: Ordered (equally spaced, like fence posts), Random (arranged according to the Poisson statistical distribution), and Aggregated (arranged in clusters with significant spaces between them). 2, Plot of natural logs of means and variances of data sets of distances between tubercles along the neural spines divided into 2, 3, 4, 5, 6, 7, and 8 equal length segments comparing the distribution of tubercles of Gordodon kraineri and Edaphosaurus pogonias. The slope of the lines, not their absolute values, is the pertinent factor: slope <1 indicates an ordered distribution; slope = 1 indicates random (Poisson) distribution; slope >1 indicates aggregated distribution. Because of limited sample size, scatter in the data points was high (note low R2 numbers in the curve fit equations), but the results are clear. The slope of the Gordodon curve fit line is 0.95, indicating a near-perfect Poisson distribution, whereas the slope of the E. pogonias curve fit is 0.38, indicating a well-ordered distribution.
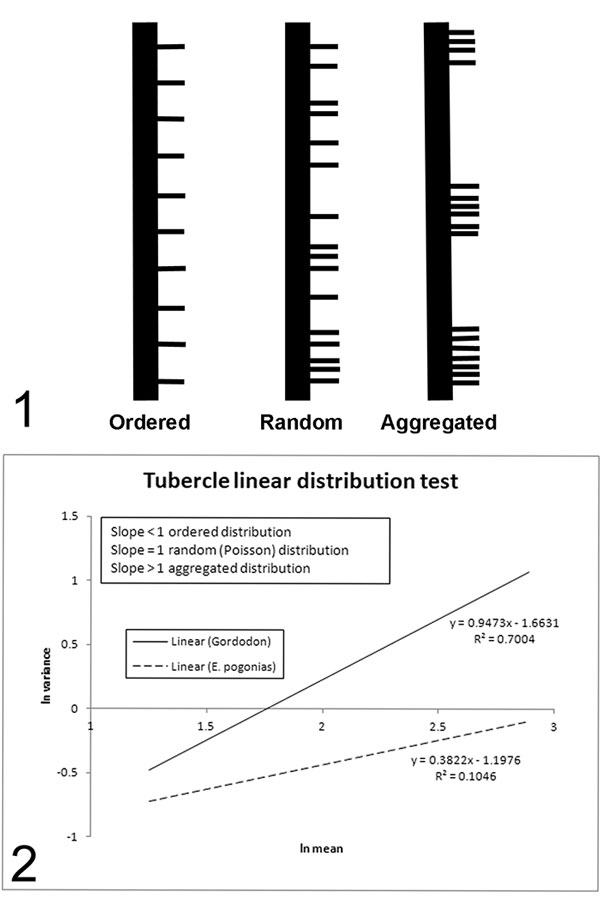
FIGURE 13. Comparison of the relative robustness of the axis (1), the post-axial cervicals (2), and the anterior dorsals (3) of Gordodon to that of several eupelycosaurs. The posterior height of the centrum is divided by its maximum length, so higher numbers indicate a relatively short, robust centrum and lower numbers indicate a relatively long, slender centrum. E. = Edaphosaurus, D. = Dimetrodon, S. = Sphenacodon.

FIGURE 14. Comparison of edaphosaurid anterior dorsal vertebrae (in anterior view) and skeletal reconstructions. 1, AMNH 4060, Edaphosaurus cruciger (modified from Case, 1906a, plate 28). 2, NMMNH P-70796, Gordodon kraineri. 3, KUVP 69035 (vertebra)/ROM 37751 (skeleton), immature Ianthasaurus hardestiorum (modified from Reisz and Berman, 1986, figure 2). Vertebra scale bars equal 5 cm, skeletal reconstruction scale bars equal 0.5 m.
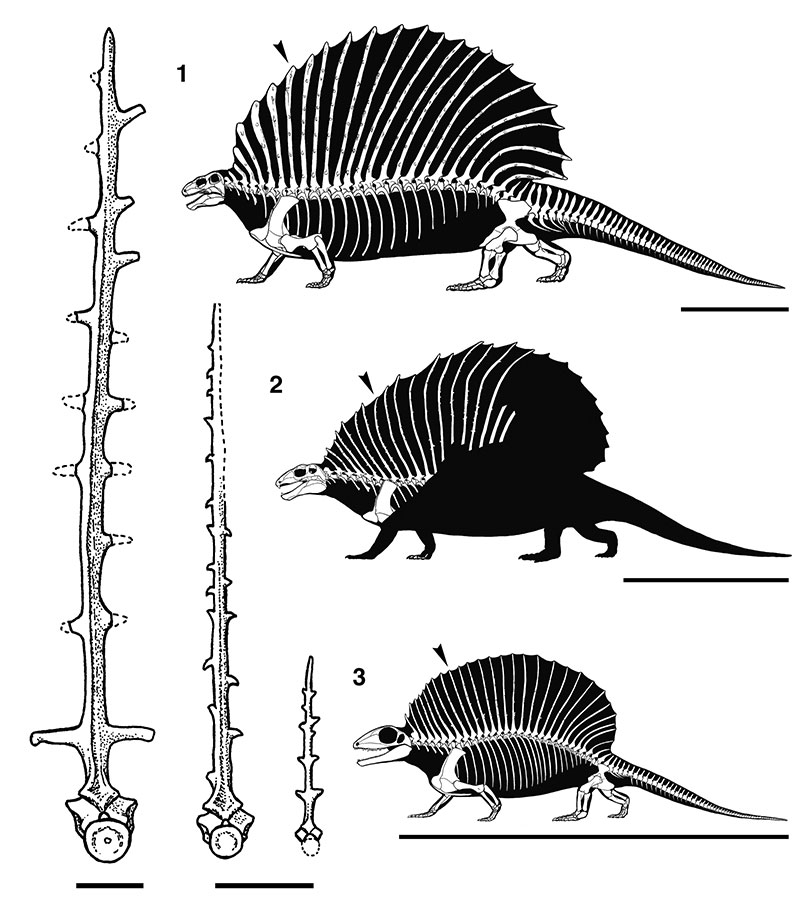
FIGURE 15. Hypothesis of edaphosaur phylogenetic relationships, including Gordodon kraineri. 1, Strict consensus tree. 2, Tree after removal of Edaphosaurus colohistion.

FIGURE 16. Comparison of skulls. 1, Gordodon kraineri. 2, Domestic rabbit, Oryctolagus cuniculus (after Farag et al., 2012, figure 4). 3, The artiodactyl Oreamos americanus, Rocky Mountain goat (after Gilbert, 1990, p. 223). 4, Edaphosaurus boanerges (after Modesto, 1995, figure 2). 5, Green iguana, Iguana iguana (after Porter and Witmer 2015, file S1). 6, The tritylodontid Kayentatherium wellesi (after Sues, 1986, figure 1). Scales equal 1 cm.

FIGURE 17. Maximum gape and origin-insertion ratio. Quantifunctional model of the proposed superficial adductor muscle of Gordodon originating at a circular, rugose boss on the jugal and inserting on an oval rugosity on the lateral posteroventral apex of the angular. 1, Model superimposed on the skull drawing. 2, Line diagram of the model after Herring and Herring (1974) in which the bold line represents the jaw closed (gape = zero degrees). Labels a, b, and l are as in 1, above: a = distance from jaw joint to muscle origin; b = distance from jaw joint to muscle insertion; l = the action line of the muscle and (by Pythagorean theorem) its length with the jaws closed (6.69 cm); L = action line and length of muscle with jaws open; ϕ = angle between a and b with jaws closed (~90o); θ = angle subtended by jaws when wide open, i.e., the maximum gape.

FIGURE 18. Life restoration of Gordodon kraineri.

FIGURE 19. Time calibrated phylogeny of the Edaphosauridae. Numerical ages and their calibration to the standard global chronostratigraphic scale are from Schmitz and Davydov (2012), Ogg et al. (2016) and Ramezani and Bowring (2018). Cross correlation of the SGCS to the North American chronostratigraphic scale and the land-vertebrate faunachrons is based on Barrick et al. (2004), Wardlaw (2005), Heckel et al. (2007), Vachard et al. (2015) and Lucas (2006, 2017, 2018).

