FIGURE 1. An example of the diversity of trilobite moult configurations preserved in the fossil record, see Drage et al. (2018a) for descriptions of the named configurations. 1: Acadoparadoxides sp. Šnajdr 1957 (PMU 25636) in McNamara’s or Somersault Configuration but with the librigenae also rotated; 2: Estaingia bilobata (SAM-P55734) with the right librigena in McNamara’s Configuration; 3: Acadoparadoxides sp. (PMU 25690) showing disarticulation of the librigenae, cranidium and thorax; 4: Acidaspis coronata Salter 1853 (OUMNH C.17494) in the Nutcracker Configuration; 5: E. bilobata (SAM-P 54204) in the Somersault Configuration; 6: Marrolithus ornatus Sternberg 1833 (NMP L15156) in Hupe’s Configuration; 7: Redlichia takooensis Lu 1950 (SAM-P55732) in Salter’s Configuration; 8: Illaenus parabolinus Novák 1918 (in Novák and Perner, 1918) (NHMUK I.15261), an axial shield missing the librigenae; 9: Ogygopsis klotzi Rominger 1887 (OUMNH AT.205), a common axial shield; 10: Trimerocephalus mastophthalmus Richter 1856 (NHMUK In.22418), in Salter’s Configuration with the cephalon displaced forwards; 11: Triarthrus beckii Green 1832 (NHMUK In.19650), showing a Lower Cephalic Unit mostly in situ and a clearly displaced cranidium as a variant of Henningsmoen’s Configuration.
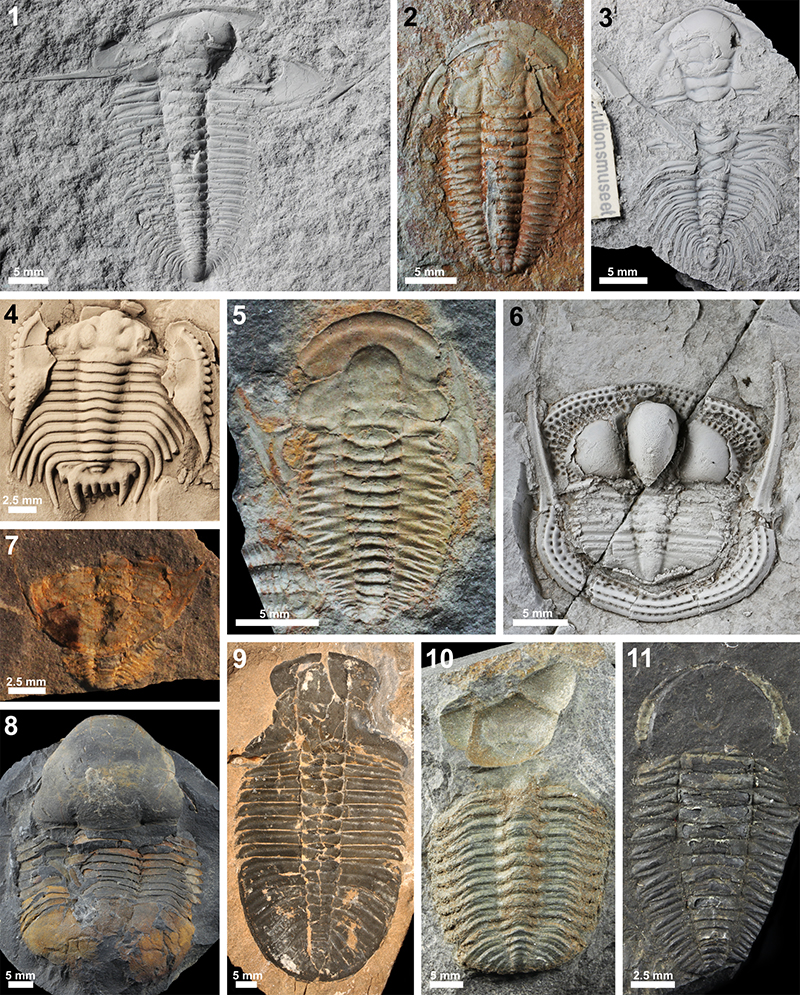
FIGURE 2. Hypothetical trilobite moult specimens, demonstrating the process of gathering data for the presented dataset. 1 and 2 represent specimens that can be confidently considered moult configurations, whereas 3 and 4 (isolated thoracic segments and an isolated cephalon respectively) are too fragmented and lack sufficient information to identify as either moults or carcasses. 1: four moulting characteristics can be counted from this specimen, including open ventral sutures (and therefore separation of the rostral plate/hypostome), open facial sutures (separation of the librigenae), a disarticulated cranidium, and a disarticulated thorax. 2: two moulting characteristics can be counted from this specimen, including a disarticulated cephalon, and a disarticulated pygidium. Of these four specimens, only 1 and 2 would be recorded within the dataset.
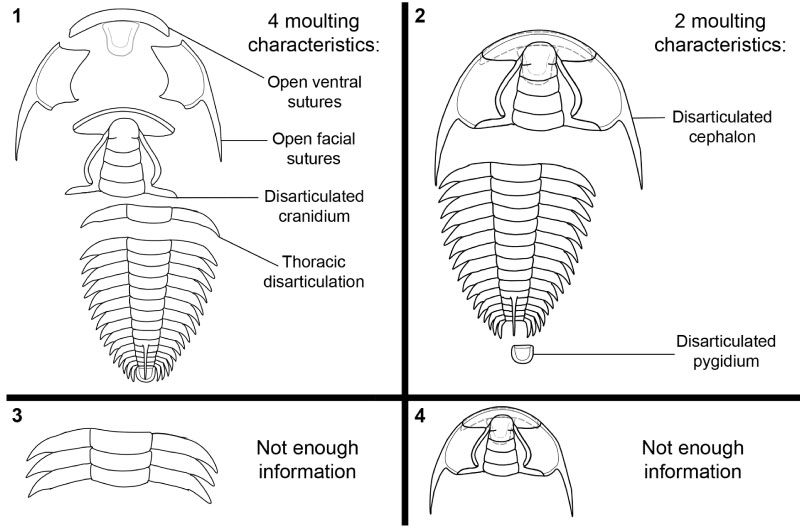
FIGURE 3. Palaeogeographic maps with yellow points representing the sampled species in each geological Period. 1: all sampled species on a modern map, n=370; 2: Cambrian, n=146; 3: Ordovician, n=128; 4: Silurian, n=54; 5: Devonian, n=30; 6: Carboniferous, n=12. Permian not displayed because n=1. Maps represent the mid-point age of each Period. Some specimens appear sampled from terrestrial areas owing to their lack of well-defined collection data. Maps produced using GPlates and PaleoMap (Scotese, 2016).
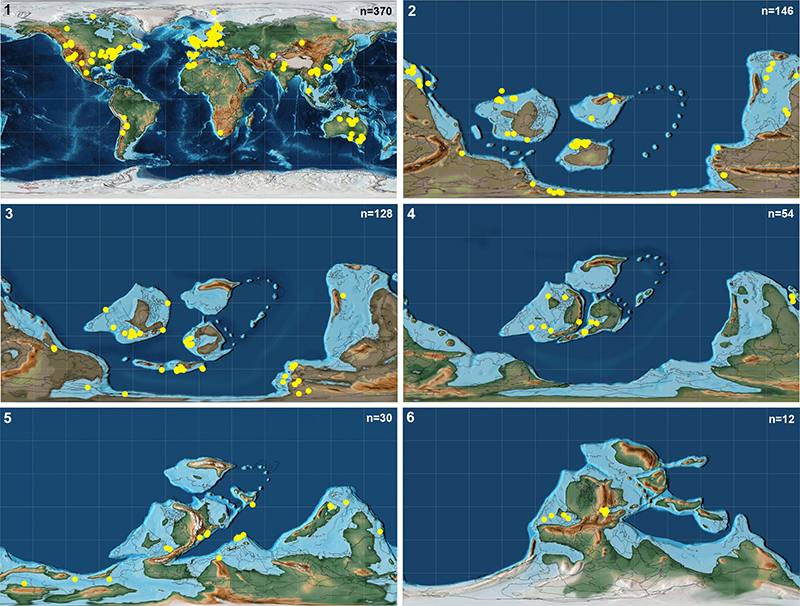
FIGURE 4. Percentage of all sampled trilobite species (n=340) that are represented by 1 specimen, 2, 3-5, 6-8, 9-10, and 11+ specimens. Fifteen species were not included in this count because the number of representative specimens was unknown, as the data was derived from literature that did not provide a sampling estimate.
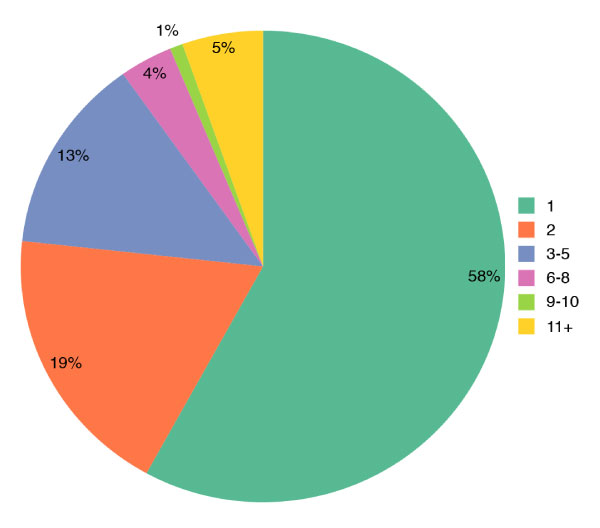
FIGURE 5. Potential moult assemblages and moulting morphology of specialised arthropods. 1: Marrolithus ornatus senftenbergi (Order Asaphida, Family Trinucleidae, L15157 from the NMP collections) with the upper cephalic fringe inverted to rest posterior to the exuvia; 2: Bohemoharpes ungula Sternberg 1833 (Order Harpetida, L2959 from the NMP collections), broken at some places at the marginal suture between the dorsal and ventral parts of the cephalic fringe; 3: Limulus polyphemus Linnaeus 1758 (Order Xiphosurida), carcass showing the comparable closed marginal suture (image by R.D.C. Bicknell, Va. 06 from the Natural History Museum of the University of New England); 4: Limulus polyphemus carcass mid-moult emerging through the marginal suture (Wikimedia Commons).
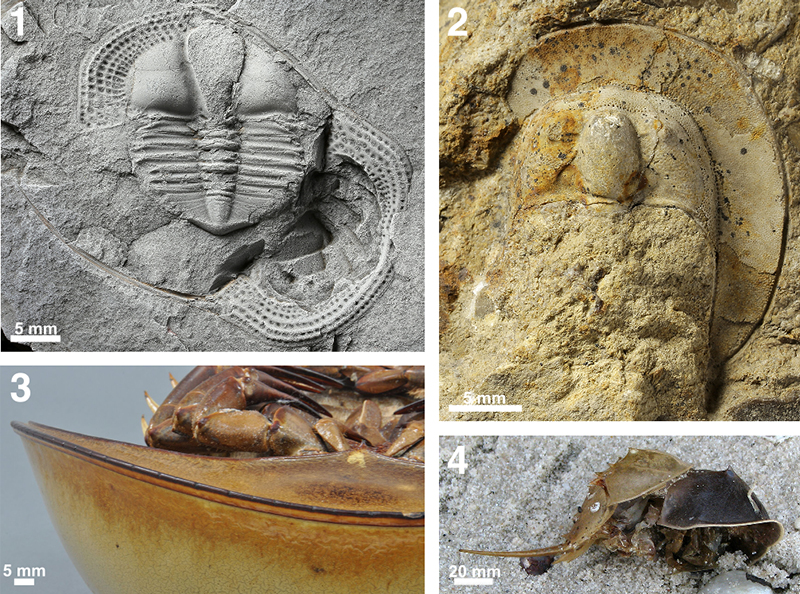
FIGURE 6. Percentage of all trilobite species displaying the two styles of moulting (opening of cephalic sutures, and opening of the cephalothoracic joint), with the total number of species showing each above the bar.
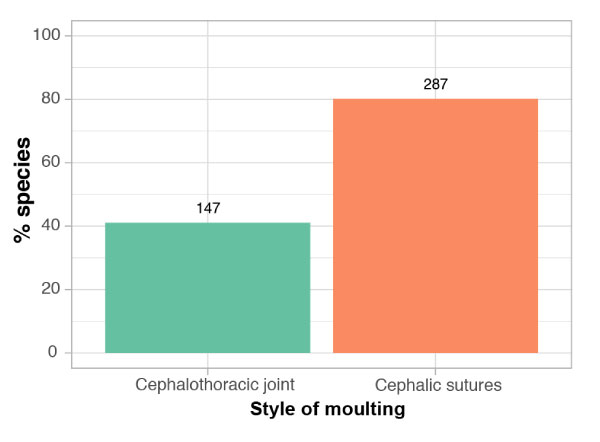
FIGURE 7. Percentage of all trilobite species displaying each of the six different moulting characteristics, with the total number of species showing each above the bar.
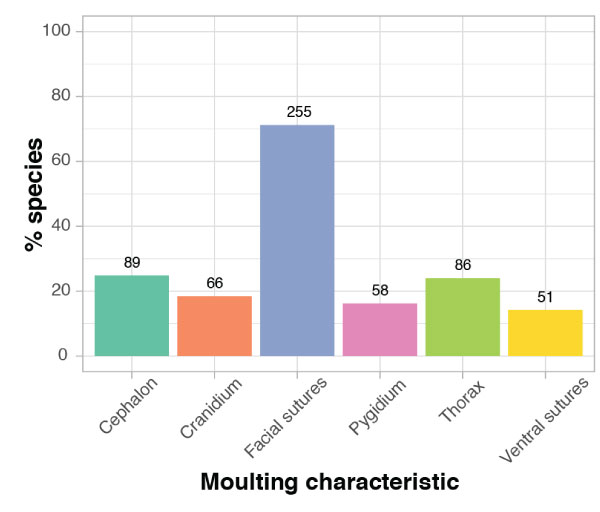
FIGURE 8. Trilobite taxonomic diversity in the sample dataset (green, n=355) plotted as a percentage of the total sample size, compared to total recorded diversity (orange, n=9753; downloaded from FossilWorks; Kiessling et al., 2018).
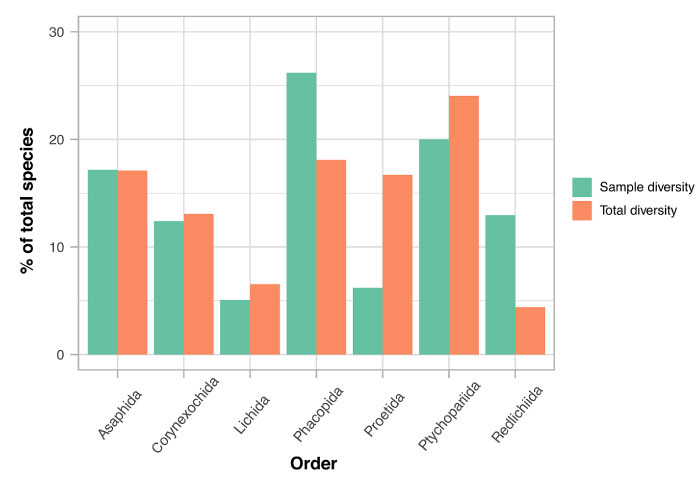
FIGURE 9. Percentage of species in each trilobite order (n=355) displaying the two styles of moulting (opening of cephalic sutures, and opening of the cephalothoracic joint), plotted against sampling (black line; the proportion of species sampled that belong to each order).
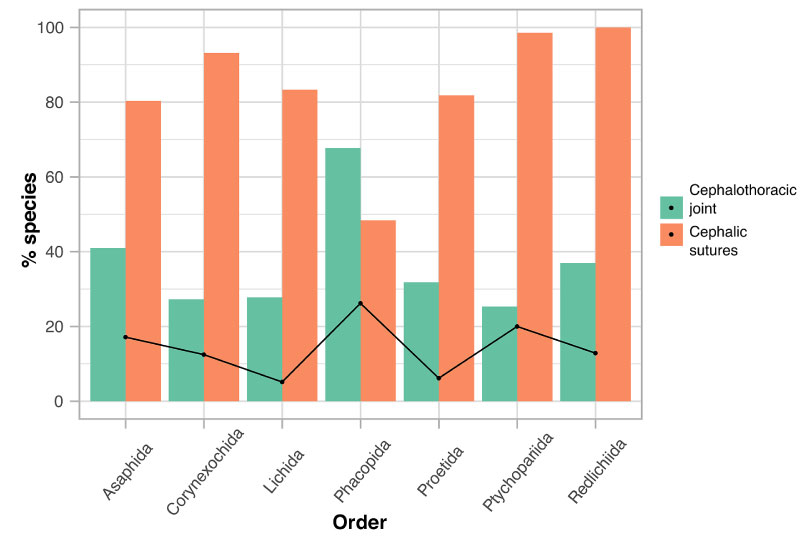
FIGURE 10. Percentage of species in each trilobite order (n=355) displaying each of the six different moulting characteristics (data legend), plotted against sampling (black line; the proportion of species sampled that belong to each order).
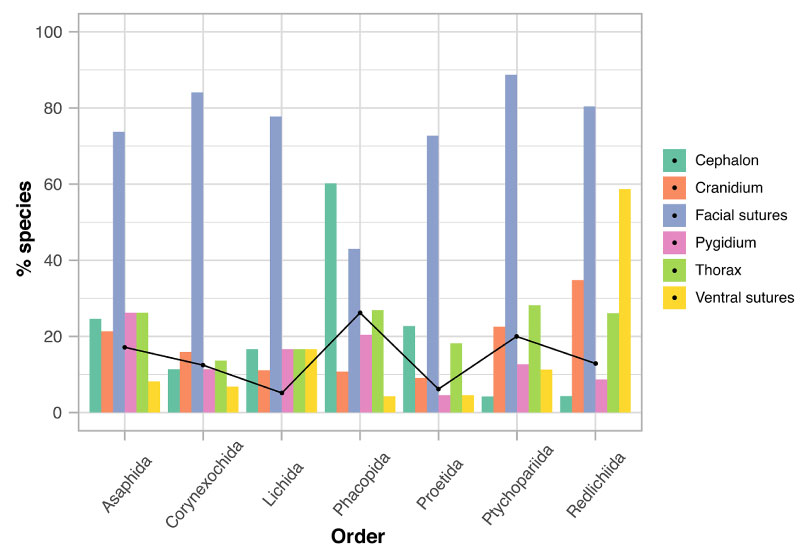
FIGURE 11. Percentage of species in each trilobite order (n=355) for which each moulting characteristic was the ‘normal’ (data legend); i.e., that characteristic most commonly observed in the moult configurations of each species, plotted against sampling (black line; the proportion of species sampled that belong to each order).
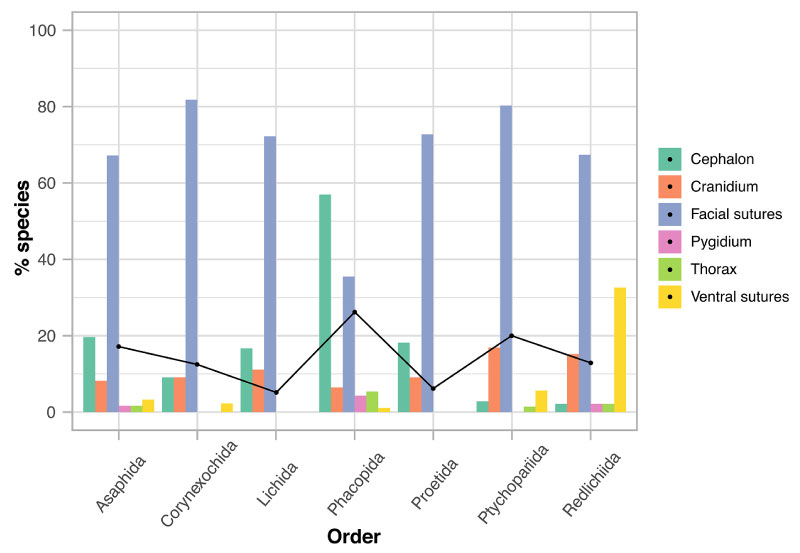
FIGURE 12. Percentage of species in each trilobite family or superfamily displaying the six different moulting characteristic disarticulations (data legend applies to all graphs), plotted against sampling (black line; the proportion of species sampled for the order that belong to each family or superfamily). The Lichida and Proetida are not included owing to their relatively low sample sizes. 1: Phacopida families, n=93; 2: Asaphida families, n=61; 3: Corynexochida families, n=44; 4: Ptychopariida superfamilies, n=71; 5: Redlichiida superfamilies, n=46.
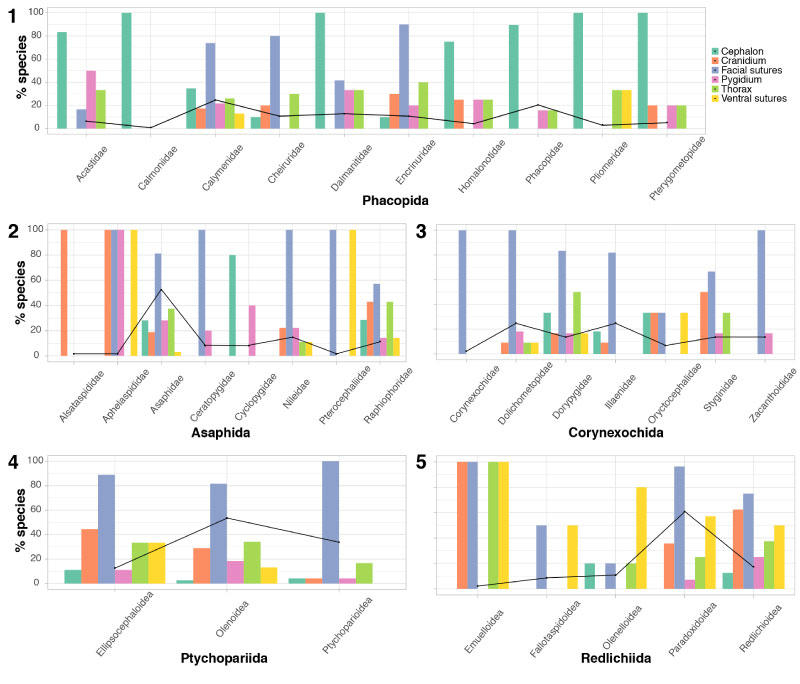
FIGURE 13. Percentage of species in each trilobite order (n=355) displaying 1 to 6 of the different moulting characteristics (MC1-6; data legend), plotted against sampling (black line; the proportion of species sampled that belong to each order). Number of moulting characteristics observed for a species functions as a proxy measure for its moulting variability.
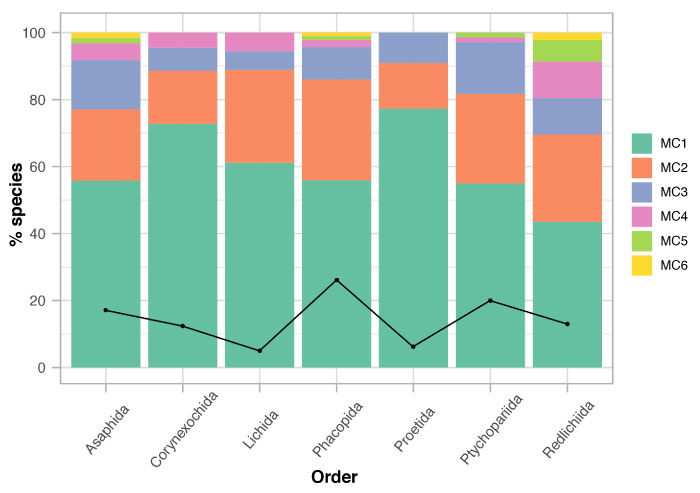
FIGURE 14. Number of specimens sampled for each trilobite species (y-axis), plotted against the number of the described moulting characteristics each species showed (x-axis). The size of each point represents the number of species sampled at that position.
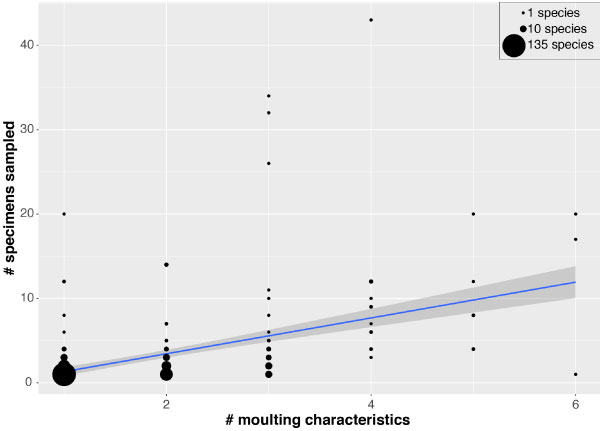
FIGURE 15. Trilobite species diversity through the Palaeozoic plotted as a percentage of the total diversity. Total group recorded diversity (green, n=8309; downloaded from Fossilworks; Kiessling et al., 2018) compared to dataset sample diversity (purple, n=371). The yellow line represents the total group diversity corrected for sampling by using Shareholder Quorum Subsampling (using Fossilworks, 2018).
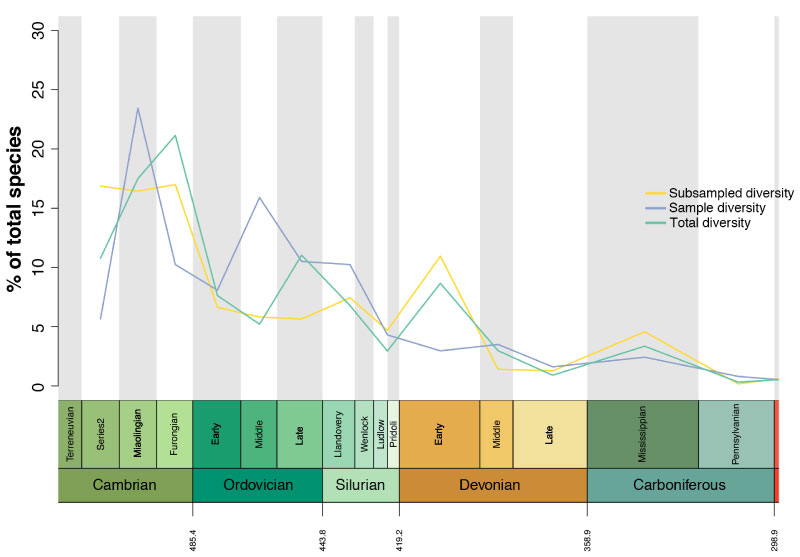
FIGURE 16. Percentage of trilobite species (n=370) in each geological Epoch displaying each of the six different moulting characteristics (see data legend), plotted with total number of species sampled (black).
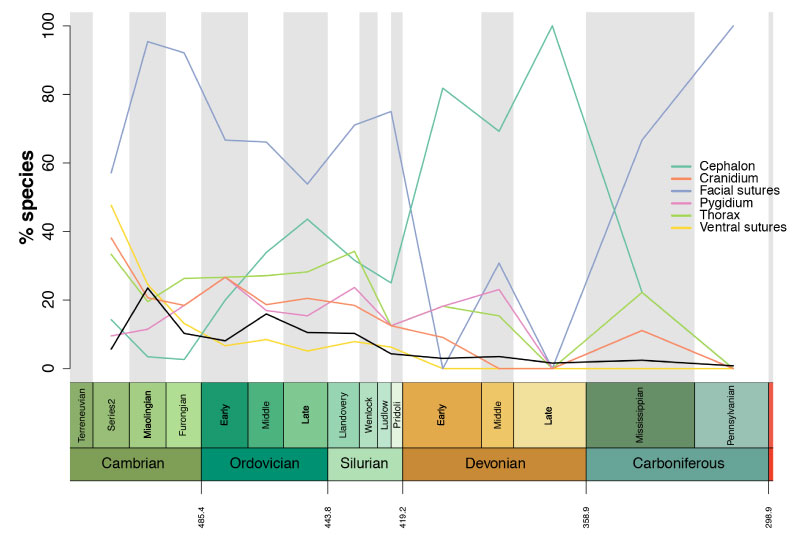
FIGURE 17. Percentage of trilobite species in each geological Epoch for which each moulting characteristic was the ‘normal’ (data legend); i.e., the characteristic most commonly observed in the moult configurations of each species. Plotted with total number of species sampled (black).
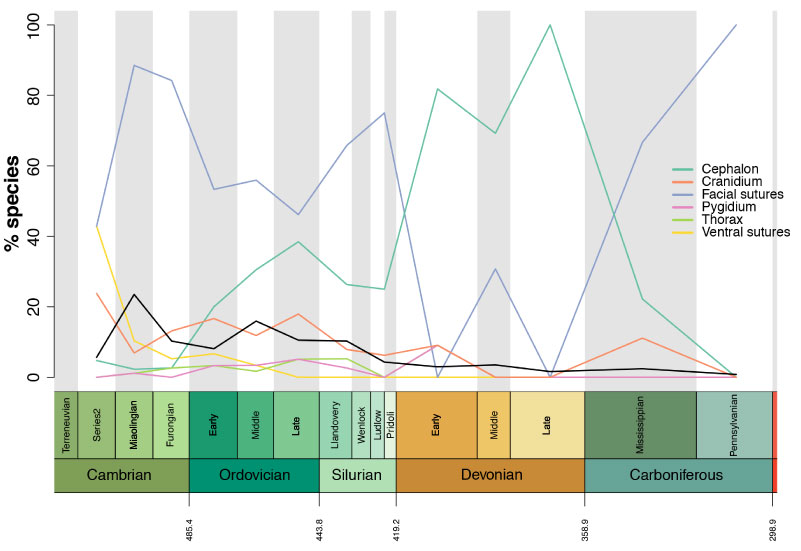
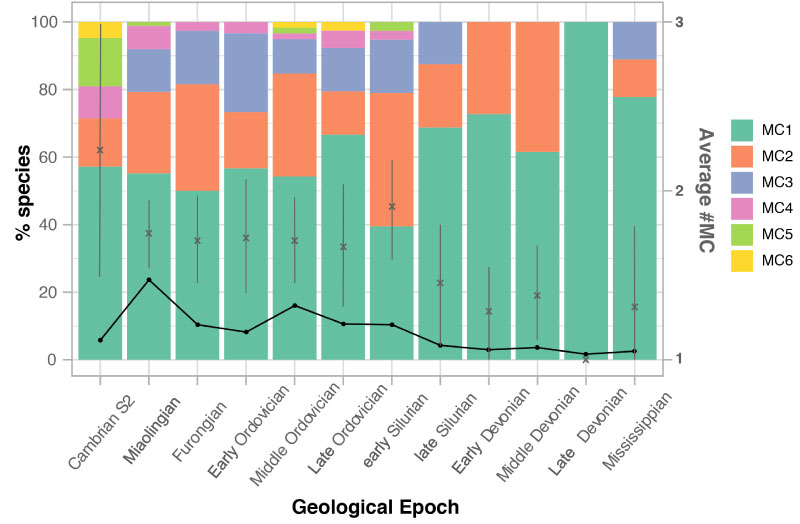
FIGURE 18. Percentage of species in each geological Epoch (n=367; Pennsylvanian and early Permian removed due to low sampling) displaying 1 to 6 of the moulting characteristics (MC1-6; data legend), plotted against sampling (black line; the proportion of species sampled in each Epoch). Grey crosses and second y-axis represent the mean average number of moulting characteristics for species observed in each Epoch, with the 95% confidence intervals given. Number of moulting characteristics observed functions as a proxy measure for intraspecific moulting variability.