FIGURE 1. APC distribution for all journals that have a ‘gold’ OA option. An APC of zero denotes a ‘diamond’ OA journal.
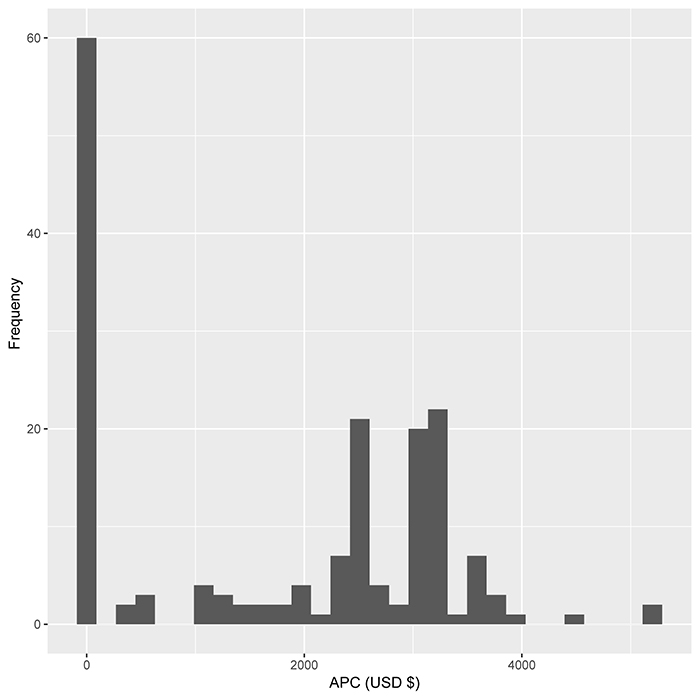
FIGURE 2. Publisher-imposed embargo periods on sharing of postprints (months).
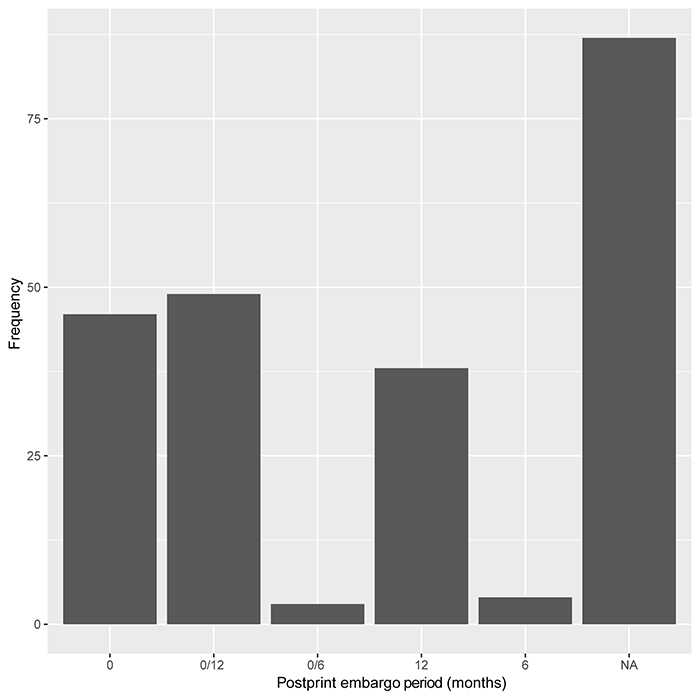
FIGURE 3. Histogram of SNIP scores for palaeontology journals.
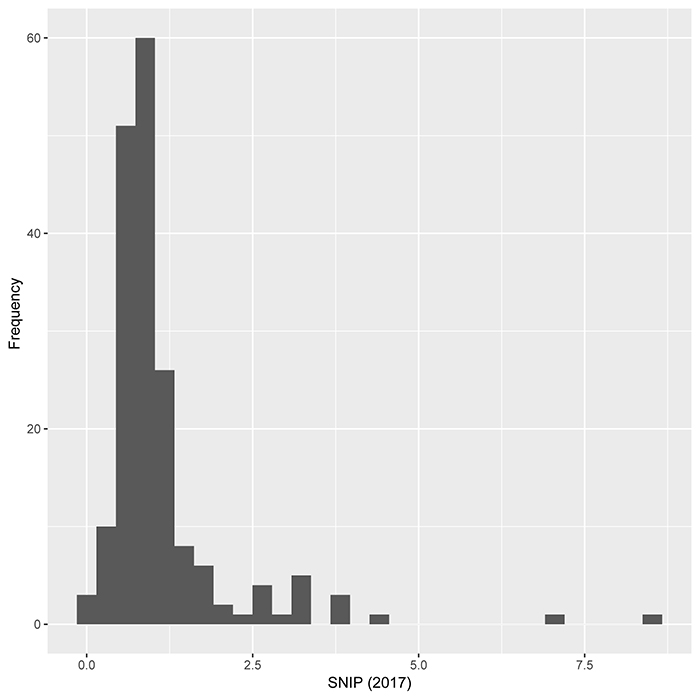
FIGURE 4. Histogram of impact factor scores for palaeontology journals.
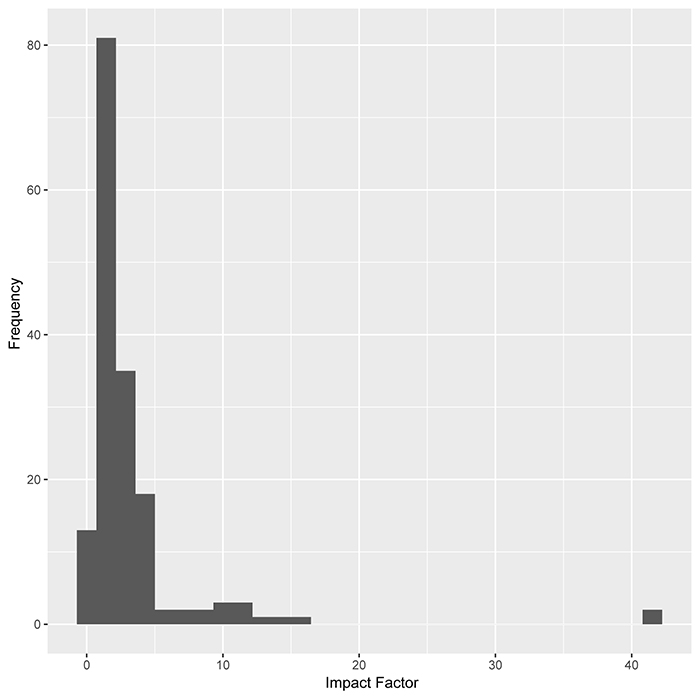
FIGURE 5. Relationship between SNIP and IF for palaeontology journals, with a fitted linear regression (the grey shaded area represents the 95% confidence intervals for the model). R-squared = 0.899.
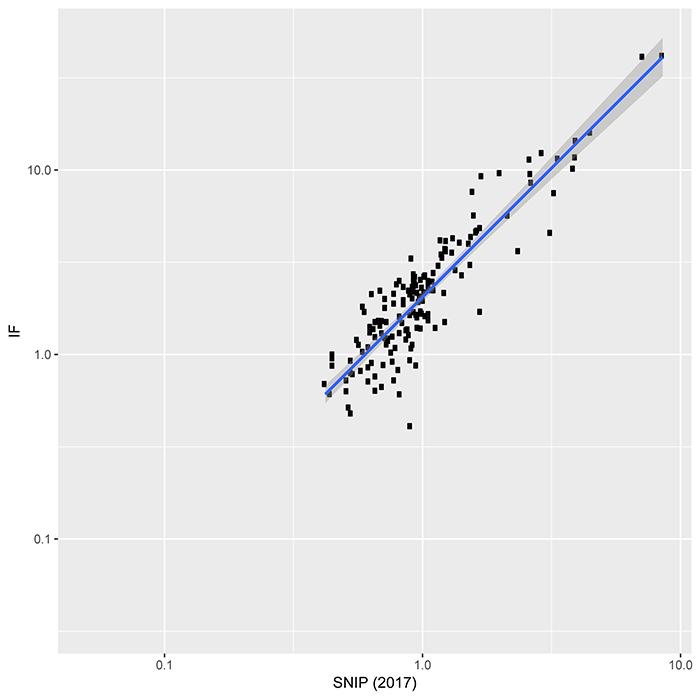
FIGURE 6. Relationship between SNIP and APC. R-squared = 0.135.
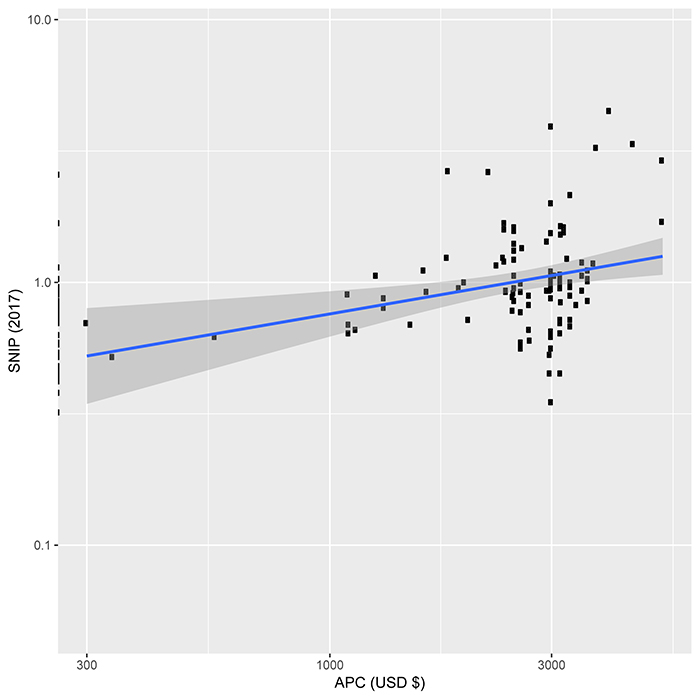
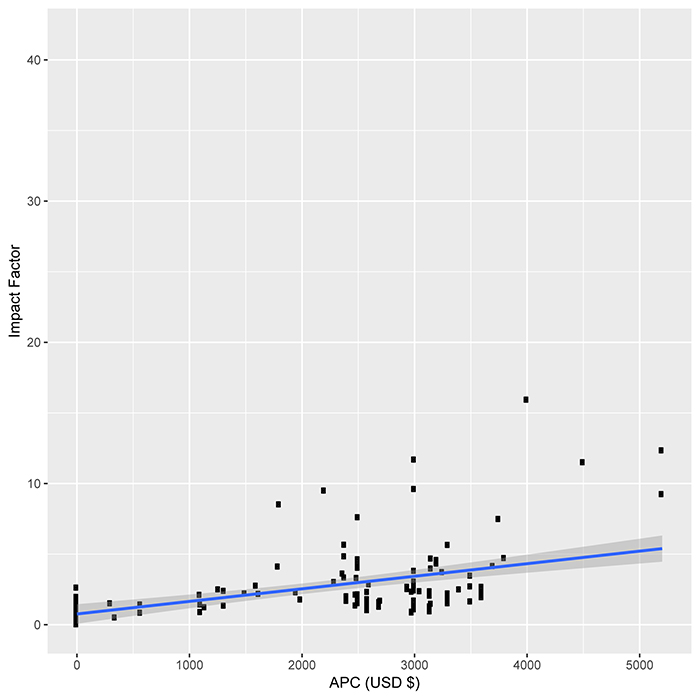
FIGURE 7. Relationship between IF and APC. R-squared = 0.227.