FIGURE 1. Libonectes morgani skull in dorsal view. Sq – squamosal; stf – supratemporal fenestra; pt – pterygoid; pc – parietal crest; j – jugal; tb – temporal bar; soc – supraoccipital; p – parietal; po – postorbital; o – orbit; pfr – prefrontal; en – external nares; mx – maxilla; pmx – premaxilla.
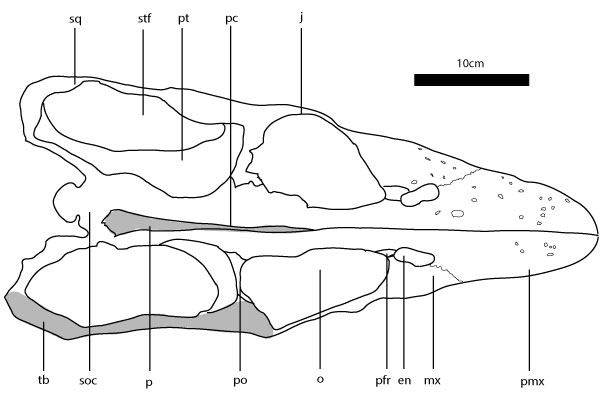
FIGURE 2. Workflow from laser scanning to finite-element analysis. 1 The base model was laser scanned using Scanstudio®. 2 The 3-D modeling used NURBS spline surfaces to conform with the shape of the laser-scanned skull; this is done in Lightwave®. 3 The NURBS surfaces facilitate remodeling according variants intended to be studied. 4 The models are meshed in the FEA software COMSOL Multiphysics®. 5 In COMSOL Multiphysics® the boundary conditions (loadings and constraints) are applied. 6 The results obtained are scaled to the same range in order to facilitate comparison.
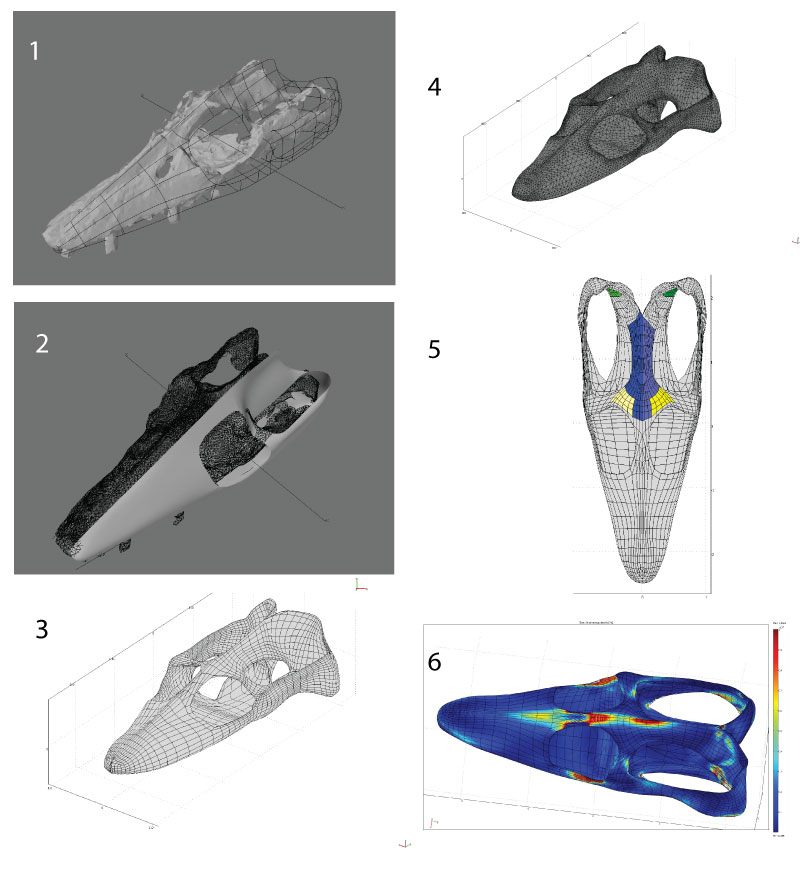
FIGURE 3. Base skull model in various views with the boundary conditions. 1 Lateral view. 2 Dorsal view. 3 Ventral view. 4 Anterodorsal view. 5 Laterodorsal view. Boundary conditions: light blue - area for origin of left MAMES origin, dark blue - area for origin of right MAMES origin; light yellow – area for origin of right MPst origin; dark yellow – area for origin of right MPst origin; light green – area for origin of right MAMP origin; dark green – area for origin of right MAMP origin; light orange – area for origin of left MPt origin; dark orange – area for origin of right MPt origin.
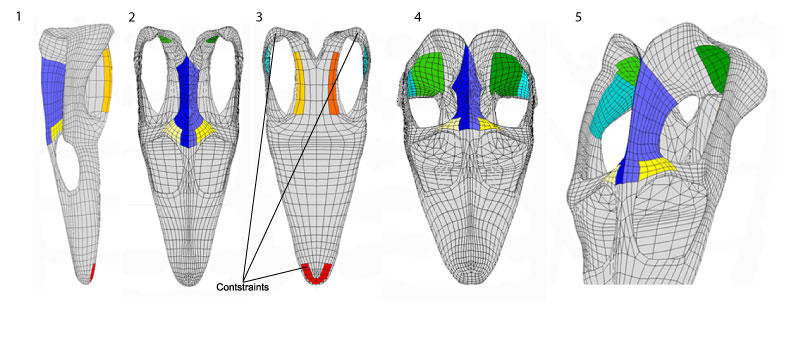
FIGURE 4. Osteological correlates in the cranium of Libonectes morgani. 1 Periosteum texture on the premaxilla-maxilla for textural comparison with other regions of the skull, note the ornamented surface of the bone and the presence of several elongated foramina. 2 Medial view of the temporal bar at the level of the squamosal jugal suture; note the deeply striated and rugose texture of the bone where the mAMES most likely inserted. 3 In anterodorsal view, the posteriormost portion of the temporal fenestra; note excavated form of this section of the skull where the mAMP most likely inserted. 4. Dorsal view of the palate in the orbital region for textural comparison of the periosteum; note the smooth surface of the bone. 5 The highly pitted and rugose texture of the parietal crest is suggestive of the origination of the mAMEM and mAMEP. 6 Finely pitted surface of the posterior surface of the postorbital where the mPST most likely inserted. 7 Finely pitted lateral walls of the pterygoid where most likely the mPT inserted. Scale bar equals 0.5 cm.
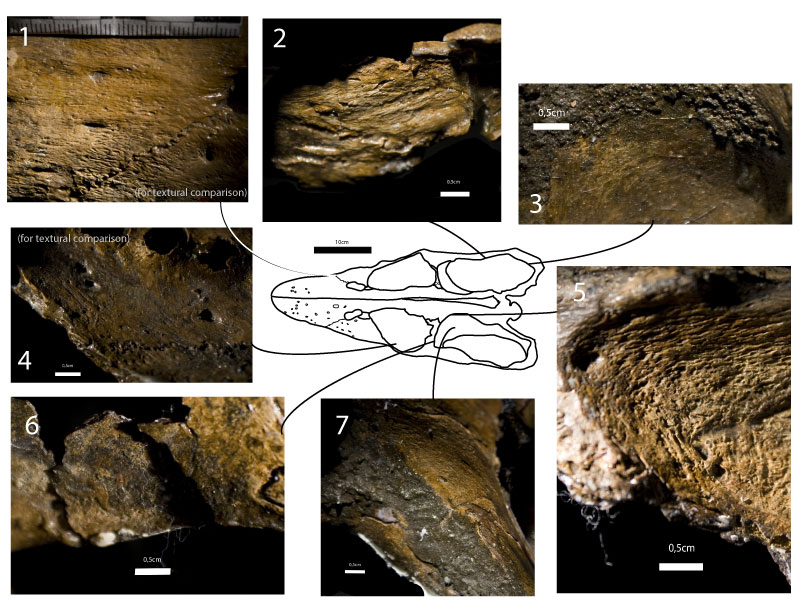
FIGURE 5. Osteological correlates in the mandible of Libonectes morgani. 1 Lateral view of the anterior portion of the mandible; the smooth but slightly ornamented texture of this section of the bone contrasts with the areas where muscles insert. 2 In medial view near the coronoid the bone texture is highly but smoothly pitted suggestion the area of insertion of the mPST. 3 Medial view of the mandible posterior to the coronoid; note the finely pitted area, tentatively the insertion of the mAMP. 4 Ventral view of the mandible with fine ornamental striations (contrast with the striations of the mPT insertion). 5 Strongly remodeled bone periosteum presenting a wavy pattern where a portion of the mPT inserted. 6 Dorsolateral view of the mandible near the coronoid; presumable mAMES insertion demonstrating deeply pitted bone texture. 7 Lateral view of the mandible demonstrating deep striations for presumable insertion of the mPT. 8 Dorsal view of the glenoid region with deeply pitted surface possibly for the insertion of the mAME.
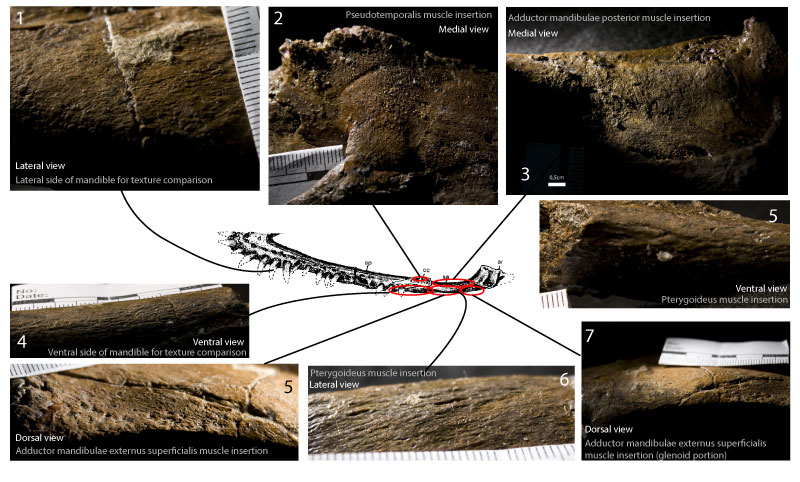
FIGURE 6. Muscle attachments in Libonectes morgani, Sphenodon puncatus and Alligator mississipiensis. 1 Libonectes morgani skull in laterodosal view and its adductor chamber musculature origins. 2 Inset of the Libonectes morgani skull in posterodorsal view depicting the supratemporal fenestra and adductor chamber musculature origins. 3 Sphenodonpunctatus skull in laterodorsal view and its adductor chamber musculature origins based on Jones et al. (2009). 4 Alligator mississipiensis skull in ventrolateral view depicting the adductor chamber region and its musculature origins. Grayish dark blue: mAMEM; Dark blue: mAMEP; Light blue: mAMES; Light green: mAMP; Gray: mDM - musculus depressor mandibulae; Orange: mPt; Yellow: mPstP; Pink: mPstS.
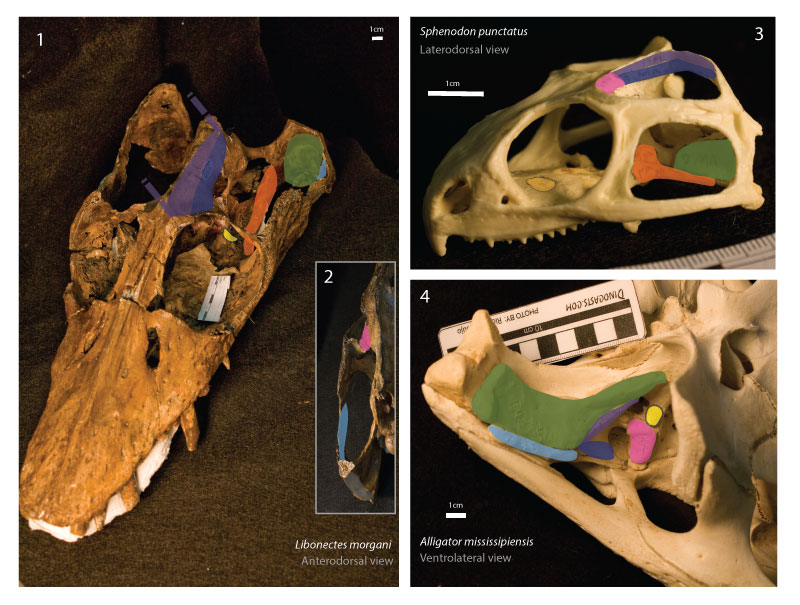
FIGURE 7. Mandible insertions in Libonectes morganiSphenodon puncatus and Alligator mississipiensis. 1 Libonectes morgani medial view of the posterior portion of the mandible. 2 Sphenodonpunctatus medial view of the posterior portion of the mandible. 3 A. mississipiensis medial view of the posterior portion of the mandible. Purple: mAMEM; Dark blue: mAMEP; Light blue: mAMES; Light green: mAMP; Gray: mDM - musculus depressor mandibulae; Orange: mPt; Yellow: mPstP; Pink: mPstS.
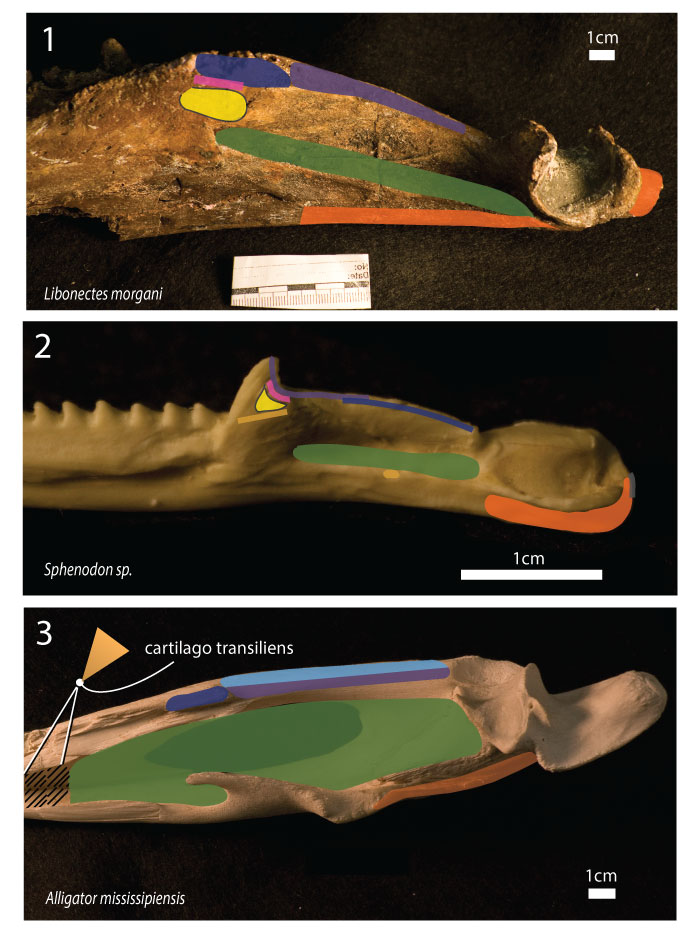
FIGURE 8. Finite-element models results. STB – shallow temporal bar variant model; LPC – low parietal crest variant model; SSF – small supratemporal fenestra variant model. Strain energy density, results in dorsal view: 1 Base model, 2 low parietal crest model, 3 shallow temporal bar model, 4 small supratemporal fenestra model. In lateral view: 5 Base model, 6 low parietal crest model, 7 shallow temporal bar model, 8 small supratemporal fenestra model. Von Mises stresses, results in dorsal view: 9 Base model, 10 low parietal crest model, 11 shallow temporal bar model, 12 small supratemporal fenestra model. In lateral view: 13 Base model, 14 low parietal crest model, 15 shallow temporal bar model, 16 small supratemporal fenestra model. Strain energy density, results in anterodorsal view:n17 Base model, 18 low parietal crest model, 19 shallow temporal bar model, 20 small supratemporal fenestra model. Von Mises stresses, results in anterodorsal view: 21 Base model, 22 low parietal crest model, 23 shallow temporal bar model, 24 small supratemporal fenestra model.
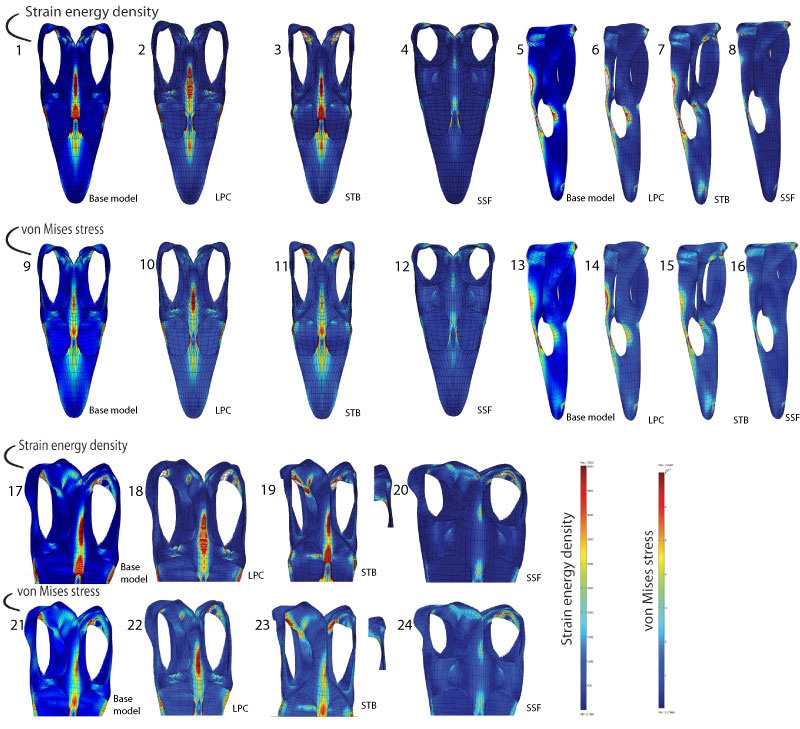
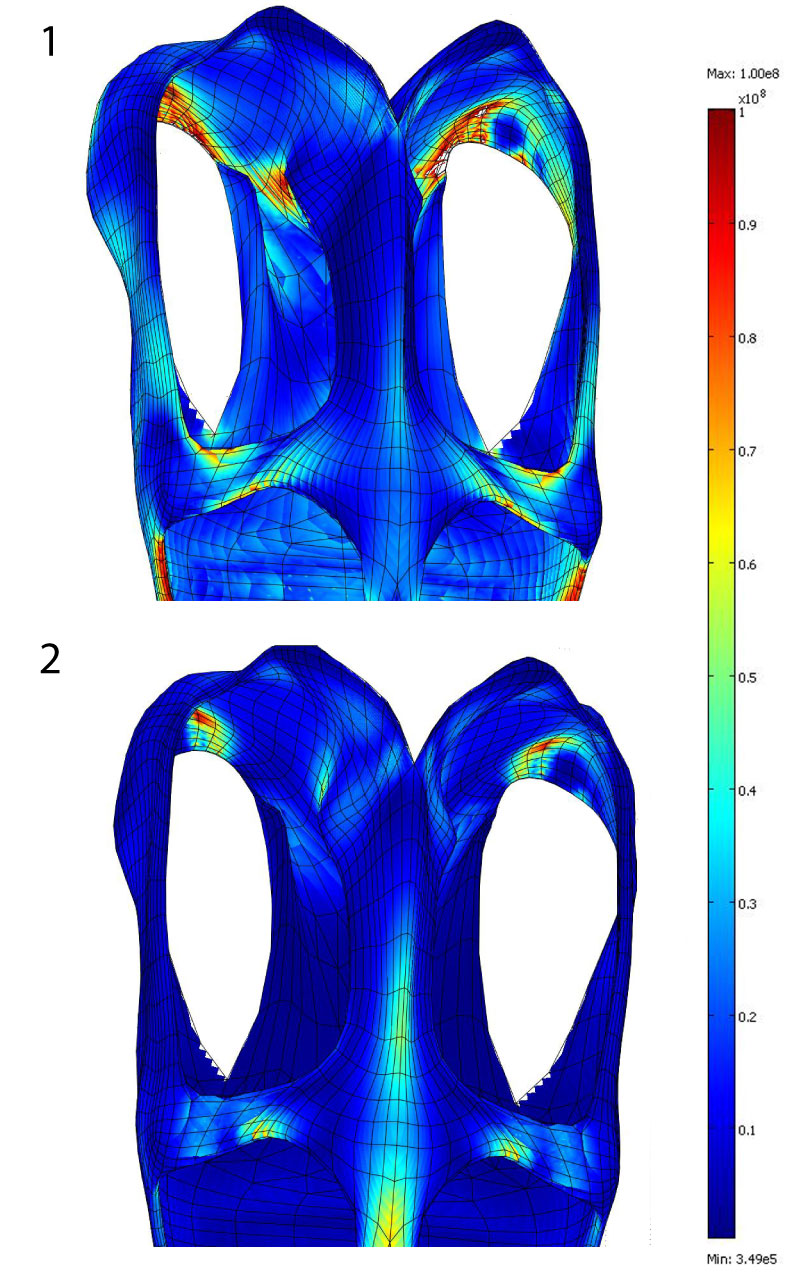
FIGURE 9.Libonectes morgani base model with posterior part of the skull viewed anterodorsally. 1 Results for the model with scaled forces at pterygoid (LC1). 2 Results for the model with no pterygoid (LC2).