

TABLE 1. Material and measurements of Myomimus maritsensis from Hayranlı locality.
|
|
Length |
|
Width |
||
|
|
range |
mean |
N |
range |
Mean |
|
P4 |
7.12-7.92 |
7.65 |
7 |
8.76-9.53 |
9.19 |
|
M1 |
9.56-10.24 |
9.9 |
12 |
10.86-12.02 |
11.5 |
|
M2 |
10.06-10.98 |
10.5 |
15-13 |
11.81-13.16 |
12.6 |
|
M3 |
9.58 |
1 |
10.29 |
||
|
p4 |
6.77 |
1 |
6.45 |
||
|
m1 |
11.49-12.17 |
11.83 |
7 |
9.95-11.02 |
10.46 |
|
m2 |
10.71-12.71 |
11.56 |
16 |
10.29-11.83 |
11 |
|
m3 |
10.27-10.6 |
10.6 |
4 |
8.89-10.34 |
9.6 |
TABLE 2. Distribution of morphotypes for lower and upper cheek teeth of the Hayranlı Gliridae. The specimens that are separated according to morphotypes b and d of P4; B and C of M1/2; R of M3 in the upper dentition, and morphotypes b of p4; 1 and 2 of m1; 1 and 2 of m2; and 1B of m3 in the lower dentition are attributed to Myomimus maritsensis. The others (e of P4 and H of M1/2 in the upper dentition; 3 of m1 and 3 of m2 in the lower dentition) are attributed to Microdyromys koenigswaldi. Morphotype classification as cited in Daams (1981).
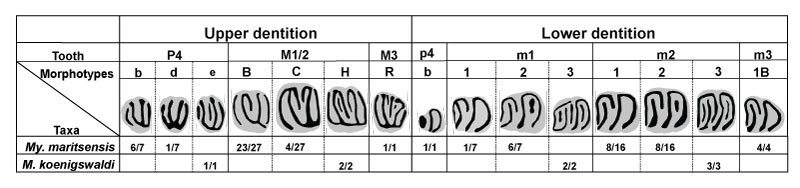
TABLE 3. Material and measurements of Microdyromys koenigswaldi from Hayranlı locality.
|
|
Length |
|
Width |
||
|
|
range |
mean |
N |
range |
mean |
|
P4 |
7.99 |
1 |
9.47 |
||
|
M1-2 |
10.16-10.45 |
10.3 |
2 |
10.76-12.09 |
11.37 |
|
m1 |
9.74-10.04 |
9.89 |
2 |
8.89-10.27 |
10.27 |
|
m2 |
10.11-10.52 |
10.25 |
3 |
10.55-11.23 |
10.8 |
TABLE 4. Summary statistics of the variables for M. koenigswaldi and My. maritsensis from Hayranlı. Data for Hypnomys morpheus and Eliomys quercinus ophiusae imported from Hautier et al. (2009).
|
Tooth Facet |
Species |
Sample |
N fs |
N ws |
N sp |
N lp |
||||
|
m |
SD |
m |
SD |
m |
SD |
m |
SD |
|||
|
Hypoconid |
Myomimus maritsensis |
10 |
34.8 |
11,21 |
5.1 |
3.31 |
30.3 |
7.63 |
11.6 |
3.17 |
|
Microdyromys koenigswaldi |
2 |
34 |
0 |
4 |
2.83 |
37.5 |
10.61 |
4.5 |
0.71 |
|
|
Hypnomys morpheus |
21 |
28.8 |
14,1 |
3.33 |
14.2 |
25.43 |
14 |
5.62 |
3.6 |
|
|
Eliomys quercinus ophiusae |
8 |
6 |
3.2 |
2.75 |
11.6 |
15.5 |
9 |
3.87 |
1.89 |
|
TABLE 5. ANOVA performed on N fs, N ws, N sp, and N lp microwear variables.
|
ANOVA |
Variables |
MS |
df |
F |
p |
|
|
N fs |
||||||
|
species |
2067.91 |
2 |
14.35 |
0.0001 |
||
|
|
|
error |
144.1 |
36 |
|
|
|
N ws |
||||||
|
species |
29.6 |
2 |
2.229 |
0.12 |
||
|
|
|
error |
239.1 |
36 |
|
|
|
N sp |
||||||
|
species |
1387 |
2 |
8.852 |
0.0007 |
||
|
|
|
error |
156.7 |
36 |
|
|
|
N lp |
||||||
|
species |
164.1 |
2 |
15.62 |
0.0001 |
||
|
|
|
error |
10.51 |
36 |
|
|
