FIGURE 1. 1, Landmarks used in this study depicted on the average configuration. This configuration, called the consensus, is the reference upon which all the rest of configurations is superimposed. It is computed after the Procrustes superimposition. 2, Procrustes residuals (all the superimposed configurations) superimposed to the average (here in white). This is the shape data that is submitted to statistical procedures such as PCA, Discriminant Analysis and Multivariate regressions.
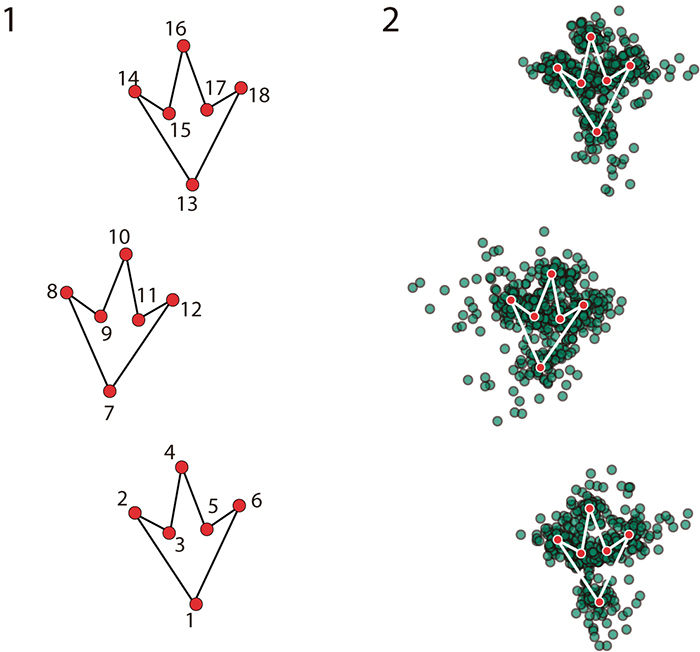
FIGURE 2. PCA ordination and shape differences between trackways. The center of each deformation grid corresponds closely to the PC scores that it represents. The histogram represents the cross-validation failure (superimposition) of the discriminant function to find differences between taxa.
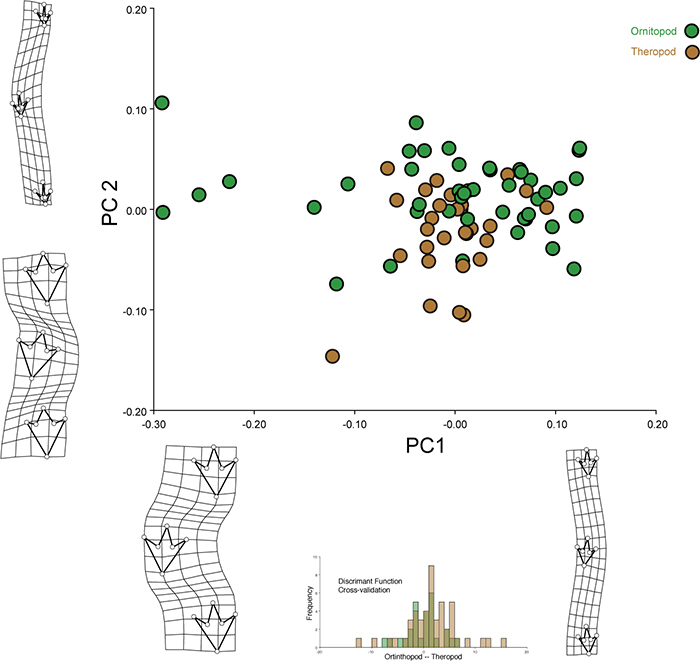
FIGURE 3. 1, Scatter-plot of the Multivariate Regression of shape data onto Centroid Size. Predicted shapes are placed along x-axis for clarification. 2, Superimposition between smaller (black) and larger (blue) predicted trackways. 3, Scatter-plot of the Multivariate Regression of shape data onto estimated speeds (Km/h). Predicted shapes also placed along x -axis for clarification. 4, Superimposition between average (black) and prediction at faster speeds (blue). 5, Bivariate Regression between Speed and Centroid Size.
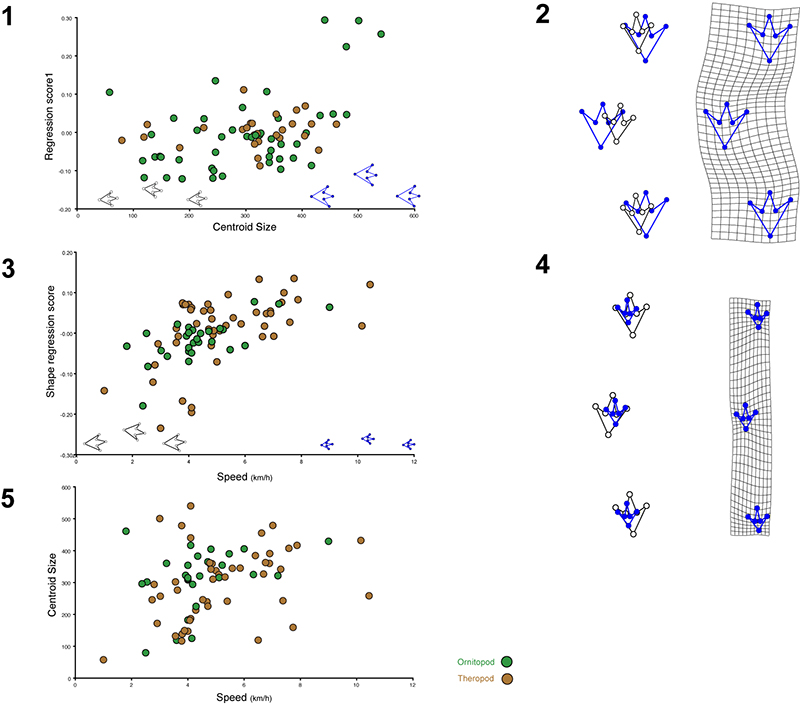
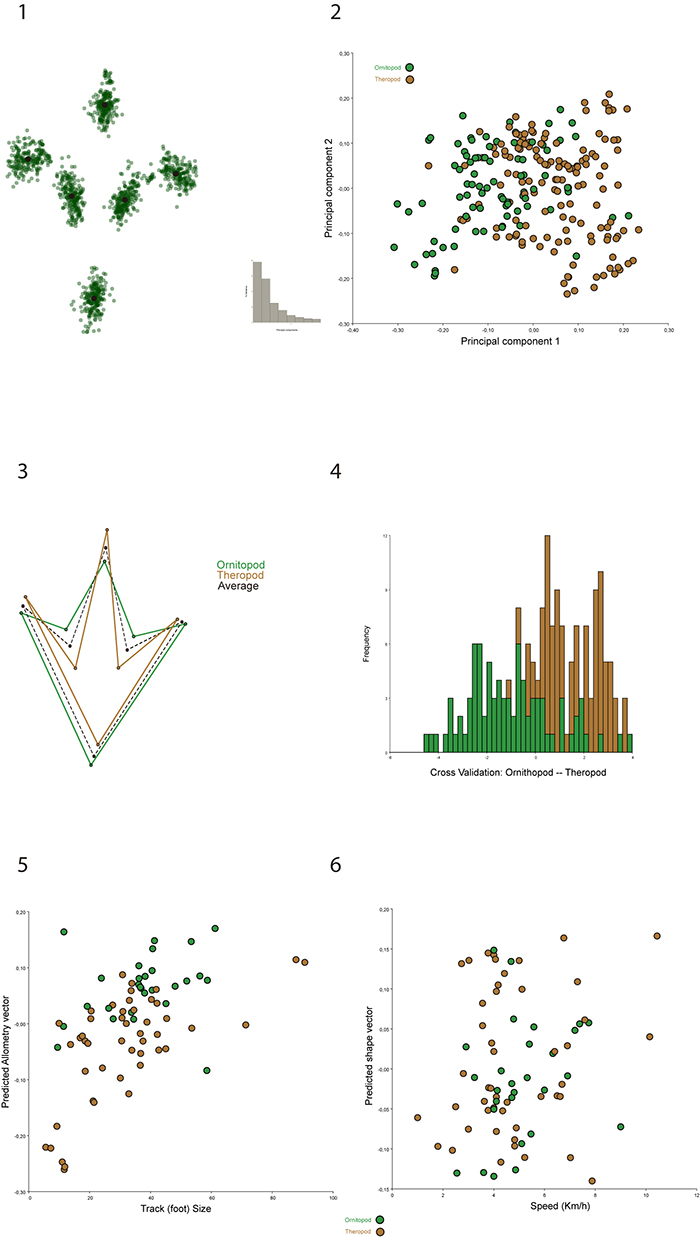
FIGURE 4. Replica of the study in isolated tracks. 1, Landmarks and superimposed residuals. 2, PCA ordination (histogram represents each PCs accounted variance). 3, Superimposition of positive and negative scores of PC1 (at 0.25 and -0.25) on the average. 4, Cross-validation of Discriminant function for ichnotaxa. 5, Multivariate regression of size on track shape. 6, Multivariate regression of speed on shape.