|
|
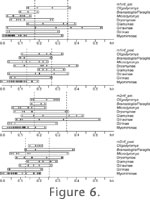
RESULTSThe values of the best parameters are listed in Table 9a (lower molars) and Table 9b (upper molars). Since h/r gave the highest degree of coincidence for all profile classes, we took that as the best index of concavity, which we call C(hr). The remaining discussion concentrates on that parameter. The values obtained for h/r for each specimen are listed in Table 10. C(hr) gave a wide range for m2sup_ant, from 0.09 for M. praemurinus to 0.33 for G. bravoi. Values for m2sup_post on the other hand, ranged from 0.07 for O. attenuatus to 0.21 for O. libanicus, and in many cases the value for m2sup_post was only little more than half the value for m2sup_ant. This was due to the fact that in many species the metacone was considerably lower than the paracone.
In Figure 6.1–6.2 the horizontal bars give the range of C(h/r) for each group. The position of each individual specimen is indicated by a + sign within each range bar, in some cases slightly offset to enhance the visibility of all the points. The black/white bar on top of m2sup_ant represents twice the standard deviation of the multiple drawings of O. libanicus, taken from Table 7. That bar gives an idea of the reliability of each of the individual values as represented by the + signs.
The maximum values range between 0.32 (m2inf_post Dryomyinae) and 0.53 (m1inf_ant Gliravinae); for each one of the eight profile classes this maximum value is divided by three, in order to define the limits of weakly concave, moderately concave, and strongly concave.
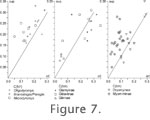
In order to compare the concavity of upper and lower molars, for each species the mean of the values of C(hr) of M1 and M2 was compared to the mean of C(hr) of M1 and M2 (see Figure 7). The oblique line denotes equal concavity in upper and lower molars; to the left of that line the upper molars are more concave than the lower ones. |
|