|
|
|
METHODS
We developed two types of computer model. The first (model 1), of a single septum and one chamber length of siphuncle, was used to examine the effects of asymmetry within a single chamber of the ammonite's phragmocone. The second type of model is of a complete ammonite, which allowed us to examine the potential effects of phragmocone asymmetries on the entire ammonite animal. In this case, two models of different shell diameter were constructed (models 2 and 3) permitting analysis of the impact of phragmocone asymmetries at different growth stages. All measurements were taken from specimens of B. columbiae. Abbreviations and measurements follow Smith (1986) and include maximum shell diameter (DMAX) and whorl height (WH). Details of model construction are given below. Model 1: Components within a Single Phragmocone Chamber
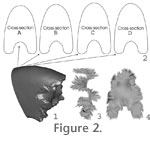
Single Septum. Using Geomagic, the septal face was lifted off the fossil scan. Due to erosion, the ventral tips of the saddles were missing from the scan. Thus, the geometry extending from approximately the outer third of the septal
face to the suture line had to be reconstructed. The outermost edges of the scanned septal face were cropped off, and the innermost two-thirds of the septal face were imported into Rhinoceros.
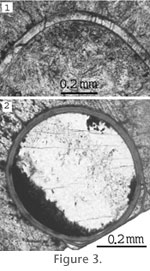
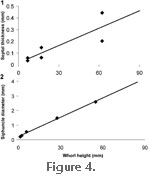
In order to calculate their thickness, thin sections were cut perpendicular to septa (Figure 3.1) at three different shell diameters. It is well recognized that ammonite septa thin from the centre towards the margins of the shell (Westermann 1971). This was accounted for by measuring the thickness at the middle of each septa as well as the thickness of the very outside edge. These thicknesses were then plotted against whorl height, and the average of the two values was used to represent the thickness of the septa at a given whorl height (Figure 4.1).
If density = mass/volume and mass is constant then
The density used for the septa was the same as for the shell (2.67 g/cm3, Hewitt and Westermann 1996) and was used in combination with the adjusted volume to produce a mass of about 4.12 g for the modeled septum (Table 2). Single Chamber Length of Siphuncle. The length of siphuncle within a single chamber was measured directly from the scanned fragment (25.7 degrees, 33.8 mm, Figure 1.1). In order to calculate the diameter of the siphuncle, five polished thin sections were cut perpendicular to the siphuncle at different whorl heights (Figure 3.2). In each case, the siphuncle diameter was then measured and plotted against whorl height (Figure 4.2). A best fit line was applied to this graph and measurements were taken from this line to assign the siphuncle diameter to the model. A recent study of Cretaceous phylloceratids found that as ammonites grew, new siphuncular tissue was added in front of the last formed septum (Tanabe et al. 2005). Based on this finding, the centre of the chamber length of the siphuncle in our model was added such that it intersected the septum. Using the model, the volume was determined by capping each end of the siphuncle and using a built-in function in Rhinoceros (Table 2). The siphuncular tube consists of conchiolin membranes and is very thin (Westermann 1971; Tanabe et al. 2005). It is primarily filled with blood vessels and surrounding epithelium (Tanabe et al. 2000). For this reason, the density of the siphuncle was taken as 1.055 g/cm3, the same as the density of the soft body of Nautilus (Saunders and Shapiro 1986). The product of density times volume produced a mass of about 0.24 g for the siphuncle on the model (Table 2). Cameral Sheets. Sheets of organic material have been discovered in the chambers of Triassic, Jurassic and Cretaceous ammonites (Grandjean 1910; Weitschat and Bandel 1991; Westermann 1992; and references therein) and may have been present in B. columbiae. Thus, cameral sheets are included mathematically in model 1 as a separate, optional component. Cameral sheets are broadly divided into three groups: horizontal sheets, siphuncular sheets and transverse sheets (Weitschat and Bandel 1991). Horizontal sheets are not included here as they are probably limited to Triassic ammonites with nearly spherical conchs (Westermann 1992). Siphuncular sheets are usually short and straight in Jurassic ammonites and probably functioned to attach the siphuncle to the inner shell wall whereas transverse sheets include all sheets that are subparallel to the septa including some that are suspended from the siphuncular tube (Weitschat and Bandel 1991). As both the latter two types of cameral sheets are associated with the siphuncle, in cases where the siphuncle is offset to one side, their mass would also have been displaced. Cameral sheets probably occupied a total of about 14% of cameral space (Hewitt and Westermann 1996; Kröger 2002). In model 1, 9.5 % of cameral space is considered to be occupied by cameral sheets (as horizontal sheets were not present). The siphuncular sheets would have been completely offset as they surrounded the siphuncle (3 % of chamber volume was allocated for these). In addition, a portion of the transverse sheets would also have been offset as some of these are suspended from the siphuncle (1.5 % of chamber volume was allocated for these). Thus, in the model, 4.5 % of the volume of the chambers was considered to be taken up by cameral sheets that were offset whereas the remaining 5 % of chamber volume was considered to be occupied by cameral sheets that were considered central. Total chamber volume was determined directly from the model using the built-in function in Rhinoceros (Table 2). As cameral sheets are believed to have been organic in composition (e.g., Erben and Reid 1971; Weitschat and Bandel 1991 and references therein) and saturated with cameral liquid (Kröger 2002), the density of the cameral sheets is considered to be 1.055 g/cm3, the same as the soft tissue of Nautilus (Saunders and Shapiro 1986). The product of density times 9.5 % of total modeled chamber volume produces a mass of about 3.65 g for the cameral sheets (Table 2).
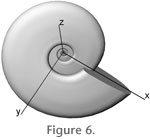
To investigate how these asymmetries affected the entire ammonite animal, a three-dimensional model of a specimen of large shell diameter was constructed (model 2, DMAX = 300 mm). Required data included whorl dimensions as well as septal face surface areas, thickness and number of septal faces, siphuncle diameter, shell thickness and body chamber length. Procedures used to calculate each of these components are addressed below. Direction notations for the model are indicated in Figure 6.
Septal Face Surface Areas. Model 1 provided a septal face surface area of 5098.52 mm3 for a whorl height of 62.3 mm. In order to examine how septal face surface areas changed through ontogeny, two more septal face surface areas were needed. Each of these was calculated using the following equations:
However, A needs to be adjusted to take into account the simplification of the suture line as shell diameter decreases using a simplification factor (equations 2-4).
In order to calculate the suture line length for equations 2 and 3, the suture lines were drawn, flattened and then measured.
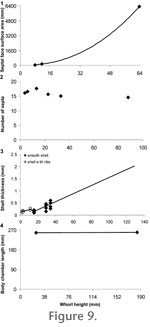
Septal Thickness and Number. The best fit line for the graph of septal thickness versus whorl height described for model 1 was used to assign a thickness to each septum (Figure 4.1). The number of septa per 360 degrees was counted in a specimen at several ontogenetic stages and then plotted against the whorl height measured at the large end of each revolution (Figure 9.2). For the purposes of model construction, the average number of septa per whorl was taken as 14, and they were placed every 25.7 degrees behind the septum at the back of the body chamber. Siphuncle Diameter. As in model 1, the best fit line for the graph of siphuncle diameter plotted against whorl height was used to assign diameters to the siphuncle in the model (Figure 4.2). Although the specimen used to make the shell measurements is quite small (DMAX = 74 mm) relative to the model, Westermann (1971) showed that shell wall thickness in the Ammonitina is approximately isometric or even positively allometric with shell diameter. Thus, we consider the plot to be reasonably accurate for extrapolation of data at larger shell diameters.
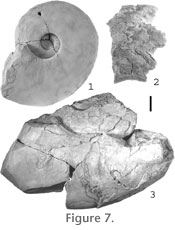
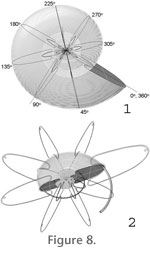
Cameral Sheets. Similar to model 1 described above, cameral sheets were considered as an optional component. Body Chamber Length. Body chamber length was measured at two different shell diameters. In the first case, a body chamber length of 258 degrees was measured on a small specimen (Figure 9.4, GSC 131684, WH = 25 mm). In the second case, the body chamber length had to be estimated because complete specimens of B. columbiae at large shell diameters are unknown. The large fragment used to create the model has approximating septa and is the final portion of a mature phragmocone (Figure 7.2, GSC 131683, WH = 132.6 mm). This fragment was used in combination with a second incomplete specimen where the final portion of phragmocone is missing but the body chamber is present (Figure 7.3, GSC 127056). By inferring the position of the septate fragment, a body chamber length of about 259 degrees was obtained. Because both the observed and calculated body chamber lengths were very similar, a length of 259 degrees was adopted for the model. Model Assembly. Once the dimensions of all the components were obtained, the model was assembled using Rhinoceros. Whorls (containing shell and siphuncle outline) of similar absolute angle (i.e., 0, 360, 720, etc. degrees) were fitted together and rotated into position. Surfaces were then lofted onto the shell, body and siphuncle outlines, and ends were put onto the lofted surfaces to make volume calculations possible (Figure 8.2). Finally, the model was divided into whorl or half-whorl portions to facilitate easy removal for work on smaller specimens.
Component Masses and Positions. Volumes were obtained from the model for the shell, siphuncle and body chamber using functions built into the software (Table 3).
Model 3: Entire Ammonite Animal at 54 mm Maximum Shell Diameter
To investigate how these asymmetries affected the entire ammonite animal at different growth stages, a three-dimensional model of a complete, small ammonite animal was also created (model 3, DMAX = 54 mm). Model 3 was constructed by removing the outer two whorls from model 2 and altering the position of the body chamber. The volumes were calculated using the same methods described above for model 2, and the densities used for each component are the same as in model 2 (Table 5). Volumes, masses and relative positions of the centroids of each component in the X, Y and Z plane are given in Table 5 whereas the positions of the centres of buoyancy (displacement) and mass (final X, Y and Z coordinates) are provided in Table 6. Once again, cameral sheets are kept optional. |
|
