|
|
|
DISCUSSION
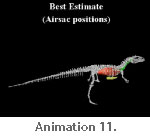
The reconstructions presented here provide the first comprehensive mass set values for Allosaurus, based on the single most complete specimen currently known and thus providing a firm basis to constrain the likely maximum range in mass properties for this dinosaur. As in a previous study (Bates et al. 2009), reconstruction of best estimate body segment and respiratory volumes was guided by the anatomy of the skeletal model and information from extant archosaurs. It was ensured that the ventral outline of the sarcral segment passed close to the pelvis (ischium and pubis) based on consideration of pelvic limb musculature (Hutchinson 2001) and the impressions of the pubic boot in trace fossils (Gierlinski et al. 2005). The lateral profile around the pectoral girdle has to pass under scapula-coracoids and is unlikely to extend below the level of the arms, which would severely restrict the range of movement. The gastralia form a shallow convexity linking the pubis and sternum in non-avian theropods, so the belly outline was constructed with a conservative amount of flesh beneath this plane, based on the relationship between the gastralia and the abdominal wall in extant crocodilians (Perry 1983; Claessens 2004). The amount of flesh reconstructed on the dorsal surface of the animal was likely to be of moderate depth based on the anatomy of extant archosaurs, though the dorsal outline of the anterior neck is expanded near its insertion on head segment to account for the musculature in the nuchal crest region, notably M. transversospinalis capitis (Snively and Russell 2007). The mediolateral expansion of trunk cavities is generally considered to be the most uncertain dimension in trunk reconstructions of non-avian dinosaurs (Henderson 1999). The best estimate reconstruction of MOR 693 had around 35-40 mm of soft tissue between the proximal end of the ribs and the wall of the thoracic cavity, which represents 12% of the mediolateral width of one side of the reconstructed body volume. The most gracile model has a total mass of 1307.69 kg (1280 kg with enlarged air sacs) but is highly emaciated, particularly in the torso (Figure 3.1, Animation 3, and Animation 4). When the gracile model was subjected to the full volume reduction it resulted in the body outline moving within the rib cage, and this was manually adjusted (i.e., re-inflated) prior to mass calculations until the ribs were enclosed within the thoracic cavity. The largest model produced a mass estimate of 1976.85 kg (2000.03 kg with reduced air sacs), but was unrealistic in many areas and contained an excessive amount of flesh around the neck, torso, sacrum and proximal tail (Figure 3.4, Animation 9, and Animation 10). However, all segments in the + 7.5% model and many of the segments in the + 11.25% model still appeared reasonable given the inherent levels of uncertainty (Figure 3.2-3.3, Animation 5, Animation 6, Animation 7, and Animation 8). Both the medio-lateral and dorso-ventral extent of the proximal parts of the neck and tail appear excessively large in the + 11.25% model, and the ventral outline of the body extended well below the level of the gastral basket (Figure 3.3, Animation 7, and Animation 8). These considerations suggest that the model represents a close approximation to the likely maximum total body mass for MOR 693 given the current level of uncertainty surrounding body volumes in non-avian dinosaurs. It is therefore suggested that the total body mass of MOR 693 is constrained within 1350-1850 kg.
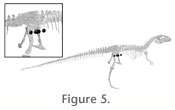
The sensitivity analysis undertaken on rib cage orientation and inter-vertebral spacing provides the first insight to the effect of ambiguities in dinosaur joint articulation on mass set predictions. Manual adjustments of the best estimate thoracic cavity after increasing the mediolateral flare of the rib cage by 10 degrees resulted in a 20.3% (0.106 kg m-3) increase in thoracic volume, similar to the 23% (0.12 kg m-3) decrease incurred by contracting the rib cage by 10 degrees (Appendix: Table 20 and Table 21; Figure 4.1). However, expansion and contraction of the rib cage necessitates parallel changes to the thoracic air sac, which reduced the actual change in thoracic mass to +16.4% (63.53 kg) and -22.9% (88.57 kg) in the respective models (Figure 4.1). Whilst this represents a significant change to the mass and volume of the thoracic segment, the overall effect on total body mass is modest (Table 1). Increasing inter-vertebral spacing between caudal, dorsal and cervical vertebrae by 0.005 m effectively increased the length of our best estimate reconstruction by approximately 0.35 m and total body volume by 0.05 m3. However, once again the necessity of increasing air sac volume to maintain plausible respiratory anatomy (O'Connor and Claessens 2005) reduced the actual body mass increase to just 36.82 kg or 2.5% (Appendix: Table 22; Figure 4.2).
Mass and inertial properties also underpin biomechanical assessments of absolute and relative performance in both extant and extinct taxa (Winter 1990). For example, Sellers and Manning (2007) used estimated mass properties to conduct a forward simulation of locomotion with the aim of predicting the maximum running speed of Allosaurus. A subsequent sensitivity analysis tested for the effect of these estimated mass properties on predicted running speed by individually substituting initial values for numbers sampled from the range of published estimates for Allosaurus, in addition to data from extant vertebrates (Bates et al. in press). The volumetric reconstructions and sensitivity analysis presented here suggest the range of mass values tested in this former study far exceed the plausible range for an Allosaurus of the skeletal dimensions used. Of particular significance are the leg-to-trunk volume ratios obtained here for Allosaurus (Appendix: Table 24), which support earlier inferences that medium to large non-avian theropods are likely to have a lower proportion of total body mass as hind limb muscle than extant avian bipeds (Hutchinson et al. 2007; Bates et al. 2009; see Paul 1998, 2008 for contrary arguments). Bates et al. (in press) tested muscle force values equivalent to values for the muscle mass of a single hind limb between 11.93 – 33.78% total body mass for Allosaurus. Although the minimum value falls close to that suggested in this study, the maximum value far exceeds the plausible ratio based on volumetric reconstructions (Appendix: Table 24). Reconstructing MOR 693 with the largest leg volumes (plus 15%) and smallest trunk volume (minus 7.5%) yields a hind limb volume equivalent to 17.79% total body mass, the highest value possible using the reconstructions presented here. This significantly reduces the uncertainty in running performance in Allosaurus resulting from unknown muscle mass values. Although an increase in sophistication and anatomical realism of these 'evolutionary robotic' models may yield predictions of higher locomotor performance for dinosaurs, the results presented here cast doubt on speeds above 8 m/s for Allosaurus based on current simulations (but see Bates et al. in press for discussion of uncertainty resulting from unknown physiological factors). |
|