|
|
|
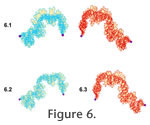
RESULTSConstraintsThe tie-point model for septal formation implies that the position of lobe tips should be more tightly constrained than the position of saddles. In none of the ammonoids considered here was that prediction borne out. The complex, ammonitic sutures of C. springeri and N. muelleri, while showing some scatter, generally follow the same path, both through the lobes and through the saddles (Figure 4.1-4.2). The lines must all converge at the landmarks bounding the lateral element, but they remain well-aligned even far from these points. Neogastroplites muelleri (Figure 4.2) shows a greater degree of constraint in suture pattern than C. springeri (Figure 4.1), which is surprising given this species' profound intraspecific variability in shell shape and ornamentation (Reeside and Cobban 1960). The N. muelleri suture patterns used here were taken from individuals chosen to represent the full range of shell forms in the species, from very compressed and lightly ornamented shells to very inflated and nodose forms. Remarkably, this shell shape variation did not produce a similar degree of sutural variation. One might suspect that the much simpler goniatitic sutures of the Paleozoic groups might fit the tie-point model better. However, the sutures of M. subdivisum do not show much constraint at all, at lobes or at saddles (Figure 4.3). These sutures represent a succession of ontogenetic stages, which may account for some of the variability, especially the appearance of smaller folioles near the bounding landmarks later in ontogeny. Interestingly, the more juvenile sutures of M. subdivisum, which are merely scaled up here to overlie more mature patterns, have the same basic proportions and relative saddle height as the more mature ones, implying isometric growth with no apparent allometry. Finally, Somoholites does show a more variably positioned saddle top, as expected under the tie-point model (Figure 4.4). However, the model can't explain the very similar positioning of the "waists" on these lines. It should be noted that these sutures come from five different species of Somoholites, and they still all show a very constrained pattern overall. This lack of interspecific variation probably reflects the fact that the suture pattern is so simple. Sutures like these, with a single lateral saddle element, may come closest to the ideal envisioned by the proponents of the tie-point model. Suture ShapeAn additional prediction of the tie-point model is that lobe tips should be more sharply angled, as the septal membrane bends strongly around the tie-point, while saddle tops should be more rounded. In the Cretaceous ammonites C. springeri (Figure 4.1) and N. muelleri (Figure 4.2), the shape of both folioles and lobules (i.e., sub-folds of saddles and lobes, respectively) varies—some are gently rounded and some are more sharply incised. Among the Paleozoic goniatites, the lack of lobules in Somoholites prevents its use in testing this prediction, but both folioles and lobules are gently rounded in M. subdivisum. SymmetryEvery proposed model for septal formation either explicitly or implicitly suggests septa should be bilaterally symmetric, with left and right sides as mirror images. Symmetry in suture patterns was therefore evaluated in C. springeri, N. muelleri, and M. subdivisum in several ways (only right sutures were available for Somoholites, so it was not included in the symmetry tests). Right (red) and left (blue) opposing sutures from the holotype of C. springeri are shown overlain on each other in the left side of Figure 5.1. Clearly, these patterns do not match each other very precisely. For comparison, the same right suture was overlain with a right suture from a different individual, as shown in the right side of Figure 5.1. Visually, one can conclude that right and left sides of the same septal margin are not mirror images of each other, although the mismatch is not as large as the difference between sutures from two separate individuals. The difference between pairs of sutures was quantified by defining the area of mismatch between them (yellow polygons in Figure 5). The area of mismatch for right and left sides of the same C. springeri suture is 9.0 units, while it is 15.3 units for two different individuals (Table 2). Similarly, right and left sides of the same sutures are also different from each other, again to a lesser degree than those from two different individuals, in N. muelleri (Figure 5.2) and M. subdivisum (Figure 5.3). Areas of mismatch (Table 2) bear out this visual assessment. A second way of evaluating symmetry is to compare the suture line lengths of right and left sides of the same suture (Table 4, Figure 5). In C. springeri, the left side is 13% longer than the right side, while in N. muelleri, the right side is 2.3% longer than the left side. For comparison, this observed difference in length between right and left sides of the same suture is considerably more than that observed in replicate measurements of the same suture (<2.5% in C. springeri and <1.0% in N. muelleri; see Table 3. However, the difference in length between two right sutures from different specimens is larger (e.g., 42.4% difference in two C. springeri, 14.0% in two N. muelleri), indicating that inter-individual variation is larger than intra-individual asymmetry. The difference between right and left suture length is smaller in the Paleozoic M. subdivisum, and which side is longer varies among sutures from a single specimen. To further explore this consistent shortening of suture patterns in the Cretaceous ammonoids, the shapes and areas spanned by multiple right or left sutures were compared (Figure 4). In C. springeri, for instance, the right sutures of multiple individuals are all consistently shortened relative to the left sutures, with umbilical elements displaced toward the venter (Figure 4.1). Hence, the asymmetry in suture patterns is not merely due to a single pathological specimen. Nor can the shortening of one side relative to the other be explained by uniform post-depositional deformation, as the suture patterns come from specimens found in different localities in several states. Rather, the variation between right and left sutural line length seems to be biologically real and inherent to the species. One can also compare how fully the right or left sutures fill in the area defined by all sutures combined. Right sutures of C. springeri show more scatter within this species' "template" while left sutures are more tightly aligned with each other (Figure 4.1). Therefore, for this species, left sutures appear to be more constrained in their form than right sutures. Finally, the area spanned by sets of right versus left sutures can be compared quantitatively to assess the relative degree of variability in suture pattern. In the Paleozoic goniatite M. subdivisum, the right sutures appear to be notably more constrained than the lefts, based on the smaller area spanned by these lateral sutural elements relative to the same number of left elements (Table 1). This approach requires caution, however, as the selection of sutures to include in the polygon can affect the overall area spanned by the sutures. For instance, the area spanned by the eight left sutures of C. springeri shown in Figure 4.1 is 39.37 units while the equivalent area for the right sutures is 47.20 units (see also Table 1), supporting the visual assessment of a greater degree of constraint in left versus right sutures in this species. However, it is possible that the choice of particular sutures might produce this difference—perhaps a different set of eight right sutures would show a narrower area of coverage. To evaluate how robust this difference is to the choice of sutures to include, eight sutures were drawn randomly from the pool of 12 right sutures that had been scanned, and the area spanned by those eight sutures was determined. This process was repeated, resulting in a total of five different subsets of eight right C. springeri sutures. The areas spanned by these five different polygons are listed in Table 5; the area of the left polygon is given for comparison. Note that in all five cases, the right polygon spanned a larger area than the left. To confirm this difference, the 95% confidence interval for the rights area was calculated; it is 43.13 to 53.37 units (tc=2.776, df=4, ci=5.12). Since the left area falls below this interval, we can conclude that left sutures span significantly less area than right sutures. Hence, the left sutures do seem to be consistently less variable and more constrained than the right sutures in C. springeri.
C |
|