| |
Statistical analysis
ANOVA
Although the analysis of variance is robust with respect to the assumption of normality (Zar 1999), I performed Shapiro-Wilk W tests on the distributions of cheek tooth dimensions of Valentine Railway Quarries samples for which N
≥10 (limited to length of P3, P4, and M1; length and talonid width of p4, m1, and m2). Results were all consistent with populations with normally distributed values, although the value for length of P3 was p=0.0501. I did not test very small samples for conformity to a normal distribution, but no evidence suggests they are inconsistent with this assumption.
ANOVAs of the tooth dimensions (Table 6) strongly support recognition of three size groups of Hesperolagomys corresponding to the three species qualitatively described above. Mean values of cheek tooth dimensions differ significantly between samples of the Barstovian species, H. niobrarensis and H. fluviatilis, for all teeth except p3 and m1. H. galbreathi differs significantly from H. fluviatilis in the lengths of P3 and the lower premolars (p3, p4) but not other teeth. Measured dimensions of all H. niobrarensis teeth, excepting p3 width, m1 trigonid width, and length and trigonid width of m2, differ significantly from those of H. galbreathi.
 Tooth dimensions of H. fluviatilis and H. galbreathi showing significant differences are length of P3, length p3, and length and trigonid width p4. Although sample sizes in most cases were quite small, the lowest power estimate (for p3) was 0.895, indicating that there is a 10.5% chance of committing a Type II error in the analysis. Other power estimates were 0.9 or greater. Tooth dimensions of H. fluviatilis and H. galbreathi showing significant differences are length of P3, length p3, and length and trigonid width p4. Although sample sizes in most cases were quite small, the lowest power estimate (for p3) was 0.895, indicating that there is a 10.5% chance of committing a Type II error in the analysis. Other power estimates were 0.9 or greater.
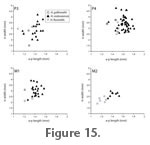
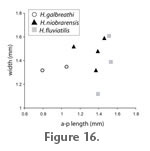
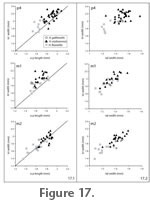
Differences between species in length of most teeth are consistent with scaling, such that H. galbreathi length and width values are intermediate between H. fluviatilis (smaller) and H. niobrarensis (larger) (Figure 15,
Figure 16, and
Figure 17). Only p3 of H. fluviatilis deviates from this pattern, being both relatively and absolutely longer than that of the other species (Figure 16).
Variation in Transverse Width of Upper Cheek Teeth
 Coefficients of variation for check tooth dimensions of H. niobrarensis and H. fluviatilis (Table 1 and
Table 4) are mostly within the range expected (CV=4 to 10) for a single species (Simpson et al. 1960). Upper cheek tooth widths, however, especially of the tall-crowned premolars, have much higher CV values. Coefficients of variation for check tooth dimensions of H. niobrarensis and H. fluviatilis (Table 1 and
Table 4) are mostly within the range expected (CV=4 to 10) for a single species (Simpson et al. 1960). Upper cheek tooth widths, however, especially of the tall-crowned premolars, have much higher CV values.
Many workers have noted the extreme change in transverse width with increased wear in unilaterally hypsodont lagomorph upper cheek teeth (e.g.,
Wood 1940;
Sych 1975;
Tobien 1975,
1978;
Gawne 1978), but only
Gawne (1978) attempted to quantify the relationship between occlusal width and crown height and explore its taxonomic implications. Using crown heights and widths in tooth rows of a large sample of previously unstudied Chadronian leporids from Wyoming, she was able to demonstrate that a number of named 'species' of Megalagus and Montanolagus are better interpreted as wear stages of the single species Megalagus brachyodon (Gawne 1978).
 Because Gawne's technique utilized measurements from complete tooth rows (rare in the samples studied here), I developed a similar approach using isolated teeth. Results for P4, the tallest-crowned and most abundantly represented upper cheek tooth in the Valentine Railway Quarries sample, are shown in
Figure 5. As crown height decreases with increasing wear, occlusal width increases in a statistically highly significant (negative) linear relationship (R2=0.89, p<0.0001). Occlusal length in P4 shows a statistically significant (positive) linear relationship with crown height, but at a much lower level of significance (R2=0.19, p=0.02). Thus, as wear proceeds, the occlusal surface of P4 nearly doubles in width while decreasing only slightly. Larger samples representing the spectrum of wear stages of other species of Tesperolagomys are needed to test if the linear function determined for P4 of H. niobrarensis width through wear is species-specific. As described above, buccolingual 'stretching' of Hesperolagomys upper cheek teeth has led to their misidentification as Russellagus, a larger ochotonid, by previous authors. Because Gawne's technique utilized measurements from complete tooth rows (rare in the samples studied here), I developed a similar approach using isolated teeth. Results for P4, the tallest-crowned and most abundantly represented upper cheek tooth in the Valentine Railway Quarries sample, are shown in
Figure 5. As crown height decreases with increasing wear, occlusal width increases in a statistically highly significant (negative) linear relationship (R2=0.89, p<0.0001). Occlusal length in P4 shows a statistically significant (positive) linear relationship with crown height, but at a much lower level of significance (R2=0.19, p=0.02). Thus, as wear proceeds, the occlusal surface of P4 nearly doubles in width while decreasing only slightly. Larger samples representing the spectrum of wear stages of other species of Tesperolagomys are needed to test if the linear function determined for P4 of H. niobrarensis width through wear is species-specific. As described above, buccolingual 'stretching' of Hesperolagomys upper cheek teeth has led to their misidentification as Russellagus, a larger ochotonid, by previous authors.
Size-related Bias in Recovery of Isolated Teeth
 Ochotonid jaws are large enough (greater than one centimeter in length) to be collected during routine surface prospecting but isolated teeth are rarely recovered by this method. The large samples of individual teeth studied here were obtained almost entirely by the sieving of large volumes of unconsolidated sediment using 0.16 inch (1.6 mm) mesh screens (Voorhies and Timperley 1997; B.E. Bailey, personal commun., 2005). To address how the method of collection might have influenced the composition of the studied sample, I counted the identifiable specimens for each tooth position in the Valentine Railway Quarries collection (see
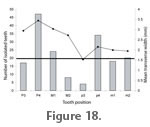
Thomas 1969). These counts, plotted against a measure of mean maximum diameter for each tooth position (width for upper cheek teeth and p3, trigonid width for p4-m2), are shown in
Figure 18. Upper (larger) cheek teeth outnumber lowers and the largest upper (P4) and lower (p4) teeth are both disproportionally abundant. The smallest upper (M2) and lower (p3) teeth are correspondingly less abundant. Teeth poorly represented in the sample, notably p3, are close to or smaller than 1.6 mm in mean maximum diameter. The cylindrical shape of the latter tooth especially appears to allow it to elude recovery by passing through the screens. The lack of P2s in the Valentine Railway Quarries and other Hesperolagomys samples probably also results from size bias, the tooth being barely 1 mm in width. Ochotonid jaws are large enough (greater than one centimeter in length) to be collected during routine surface prospecting but isolated teeth are rarely recovered by this method. The large samples of individual teeth studied here were obtained almost entirely by the sieving of large volumes of unconsolidated sediment using 0.16 inch (1.6 mm) mesh screens (Voorhies and Timperley 1997; B.E. Bailey, personal commun., 2005). To address how the method of collection might have influenced the composition of the studied sample, I counted the identifiable specimens for each tooth position in the Valentine Railway Quarries collection (see
Thomas 1969). These counts, plotted against a measure of mean maximum diameter for each tooth position (width for upper cheek teeth and p3, trigonid width for p4-m2), are shown in
Figure 18. Upper (larger) cheek teeth outnumber lowers and the largest upper (P4) and lower (p4) teeth are both disproportionally abundant. The smallest upper (M2) and lower (p3) teeth are correspondingly less abundant. Teeth poorly represented in the sample, notably p3, are close to or smaller than 1.6 mm in mean maximum diameter. The cylindrical shape of the latter tooth especially appears to allow it to elude recovery by passing through the screens. The lack of P2s in the Valentine Railway Quarries and other Hesperolagomys samples probably also results from size bias, the tooth being barely 1 mm in width.
|