

 Magnification and resolution in dental microwear analysis using light microscopy
Article number: 15.3.25A
https://doi.org/10.26879/317
Copyright Society for Vertebrate Paleontology, October 2012
Author biographies
Plain-language and multi-lingual abstracts
PDF version
Submission: 23 February 2012. Acceptance: 10 September 2012
{flike id=299}
ABSTRACT
One potentially problematic aspect of dental microwear analysis is sensitivity to the resolution (fineness of detail) at which dental wear surfaces are viewed. Magnification is one of many variables that determine resolution. Microwear studies based on light microscopy generally report magnifications ranging from 30X-100X, although ambiguities in reported methods prohibit duplication of the resolutions of many studies. Moreover, magnification settings have been arbitrary and, thus far, the biasing effects of different resolutions have not been tested. We tested sensitivity of dental microwear analysis to resolution by manipulating pixel density and magnification in photomicrographs taken under a light microscope using the molars of a browser (moose), grazer (zebra), and frugivore/hard object feeder (peccary). Resolution affected the number of observable microwear features and distorted the proportional frequencies of large and small features. Nonetheless, two observers independently found similar differences between the species throughout a range of resolutions. At no resolution did observers recover statistically undifferentiated data, although interobserver correlation was best when resolution was decreased to 20-40% of the initial resolution. Observer correlation for microwear features with a maximal dimension >20 μm was substantially better than for smaller features. We conclude that (1) dimensionless aspects of microwear data (e.g., proportional numbers of scratches between species) are more robust to resolution than raw frequency data, (2) higher resolution does not produce higher quality data, and (3) the optimal resolution may be dependent upon the size of the microwear features. Further testing of the interaction of resolution, microwear feature size, and the observer will increase repeatability of results and lead to more robust paleodietary interpretations.
Matthew C. Mihlbachler. Department of Anatomy, New York College of Osteopathic Medicine at the New York Institute of Technology, Old Westbury, NY 11568, USA and Division of Paleontology, American Museum of Natural History, Central Park West at 79th St. New York, NY 10024, USA. mmihlbac@nyit.edu
Brian L. Beatty. Department of Anatomy, New York College of Osteopathic Medicine at the New York Institute of Technology, Old Westbury, NY 11568, USA and Division of Paleobiology, National Museum of Natural History, Smithsonian Institution, Washington, DC, USA. bbeatty@nyit.edu
Keywords: dental wear; observer bias; observer error; paleodiet; paleoecology
Final citation: Mihlbachler, Matthew C. and Beatty, Brian L. 2012. Magnification and resolution in dental microwear analysis using light microscopy. Palaeontologia Electronica Vol. 15, Issue 2;25A,15p;
palaeo-electronica.org/content/2012-issue-3-articles/299-resolution-in-dental-microwear
INTRODUCTION
Dental microwear analysis is an increasingly utilized method in vertebrate paleoecology. The abundances, distributions, orientations, sizes, and shapes of microwear features have been used to interpret masticatory behaviors, diets, and other aspects of ecology for extinct species, ancient populations of extant species, and poorly-studied modern populations (Merceron et al., 2005a, 2005b; Townsend and Croft, 2008a, 2008b; Green, 2009; Schubert et al., 2010; Solounias et al., 2010; DeMiguel et al., 2011; Firmat et al., 2011; Rivals et al., 2011; Rivals and Semprebon, 2012). We differentiate dental microwear analysis from a newer method known as “texture analysis” (Scott et al., 2006, 2012; Merceron et al., 2010; Schubert et al., 2010; Ungar et al., 2010). Here, “dental microwear” refers to the more traditional technique where an observer quantifies discrete oral events based on individual microwear features (pits and scratches), whereas the later refers to computer-generated measurements of three-dimensional surface texture variables (e.g., complexity, anisotropy) via confocal microscopy.
Although microwear is a rich source of paleoecological information, the utility of dental microwear analysis as a paleoecological proxy is diminished by insufficient understanding of ante-mortem and post-mortem dental wear processes, and by non-standardized and untested methods that involve subjectivity, observer error, and sensitivity to instrumentation variation (Gordon, 1988; King et al., 1999; Fraser et al., 2009; Mihlbachler et al., 2012). Texture analysis eliminates the human observer from the interpretation of wear surfaces, but is not completely immune from all human error (such as inclusion criteria for specimens and selection of the area studied) or other complications such as post-mortem wear. In the future, dental microwear analysis and texture analysis will continue to be utilized and possibly combined in ways that offer unique paleoecological insights.
Early dental microwear analyses involved quantification of dental wear features on SEM generated images taken at high magnification (e.g., 500X). Standardization of SEM methods was a priority in the 1980s (Gordon, 1982, 1984, 1988; Teaford, 1991). In more recent years, workers have increasingly adopted low magnification light microscopy for dental microwear analysis (LDM). Early LDM studies reported a strong relationship of microwear and diet (e.g., browsing versus grazing ungulates), suggesting that the microwear features visible under low-magnification light microscopy may be highly relevant to ecologically significant dietary variables, such as the percentages of browse, graze, and fruit in the diet (Solounias and Semprebon, 2002; Semprebon et al., 2004; Merceron et al. 2005a, 2005b; Nelson et al., 2005). Nonetheless, there has been little coordinated attempt to test or standardize LDM methods leading some to suggest that LDM is irreproducible (Scott et al., 2008). Mihlbachler et al. (2010, 2012) measured observer bias in LDM. The degree of bias was similar to that reported for SEM methods and did not completely undermine an association of dental microwear data with diet. However, the Mihlbachler et al. (2012) study suggests prior LDM studies may have underestimated observer bias.
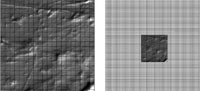
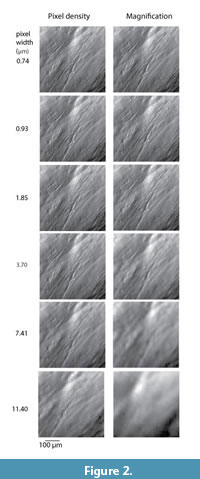
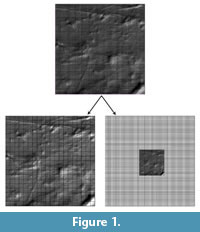 In this study we test sensitivity of LDM to the resolution of dental microwear features. It is important to draw a distinction between magnification and resolution. Resolution is the more inclusive concept that refers to the fineness of observable detail. Magnification refers to the degree to which the object is enlarged. Magnification is one of many resolution variables. There are two widely adopted approaches to LDM, a stereoscopic method, first introduced by Solounias and Semprebon (2002) and Semprebon et al. (2004), where specimens are analyzed “live” through the eyepieces of a microscope, and a photomicrographic method, first described by Merceron et al. (2005a, 2005b) where digital photomicrographs are taken with a light microscope and analyzed on a computer display. Variables relevant to stereoscopic LDM are numerous and include magnification, quality and intensity of light, quality and cleanliness of the optical instruments, fineness of focus, and variations in the human eye. An additional variable important to photomicrographic LDM is pixel density, or the number of pixels/area with which the tooth surface is sampled by the digital camera (Figure 1). The resolution of a digital image can be referred to as “digital magnification,” although we avoid the term here because digital magnification is non-analogous to optical magnification and does not produce equivalent results (Figure 2). Hereafter, “magnification” refers to magnification produced by the lenses of the microscope, whereas “pixel density” refers to digital aspects of resolution.
 Both stereoscopic and photomicrographic LDM studies report variable ranges of magnification, ranging from 30X-100X (Solounias and Semprebon, 2002; Semprebon et al., 2004; Nelson et al., 2005; Merceron et al., 2005a, 2005b; Rodrigues et al., 2009). Magnification choice is largely arbitrary and typically determined by the resolution limits of the instruments used (e.g., the maximum magnification of the microscope) and the size of the animals being analyzed, with lower magnifications for larger species (e.g., ungulates) and higher magnification for smaller species (e.g., rodents). Neither magnification nor other aspects of resolution have been tested to determine what resolution, if any, is best for maximally differentiating diet or minimizing observer bias. If there is a particular resolution where microwear analysis can maximally discern diet, it is most certainly dependant on characteristics of the microwear features themselves rather than the size of the animal, although animal size and features size may be related.
Microwear researchers have largely treated microwear data as if they were equivalent regardless of methodological differences. For instance, high frequencies of scratches relative to pits are considered indicative of a grazing diet. Likewise, high frequencies of large pits and “coarse” scratches, and other large microwear features may relate to hard object feeding. Such interpretations are often made without consideration of how variable resolutions might influence the apparent frequencies and size distributions of microwear features. Nonetheless, it stands to reason that resolution will impact the number and size range of observable microwear feature.
Fraser et al. (2009) reported that “high dynamic range imaging,” a method that reduces over- and under-exposure in photographs, improved visualization of microwear features possibly increasing repeatability. Drawing from this conclusion, one might expect higher resolutions to be preferable because smaller microwear features are visible, and details of all microwear features regardless of size are more finely resolved. Consequently, finer differences in microwear pattern might be recognizable and quantifiable at higher resolutions. However, lower resolution could be advantageous. For instance, Rodrigues et al. (2009) suggested pits with diameters less than 5 μm have no relationship to paleodiet. If this observation is correct, low resolution, where the smallest microwear features are not visible, may eliminate noise in microwear data.
Resolution may also interact with the observer in complex and unpredictable ways that influences repeatability. Microwear features range in clarity from fresh features with angular high-contrast edges that observers unanimously interpret in the same way, to older features with worn rounded edges often overprinted by other features (Mihlbachler et al., 2012). Viewing microwear surfaces at decreased resolution may increase repeatability by eliminating the most obscure microwear features, regardless of size, where interpretation is more observer dependent.
We manipulated magnification and pixel density to address the following questions: (1) Is there an optimal resolution at which different microwear patterns can be maximally differentiated? (2) How does observer bias interact with changes in resolution? (3) And finally, are there benefits to examining microwear at different resolutions?
MATERIALS AND METHODS
Dental Microwear Analysis
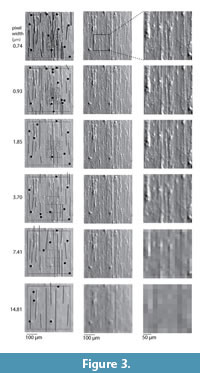 The methods used for molding, casting, photographing, and analyzing dental microwear follow Mihlbachler et al. (2012) and a detailed description of the complete methodology can be found there. Here we provide details necessary to replicate the resolution manipulation aspect of the study. Dental wear surfaces were mold, cast, and digitally photographed under a stereomicroscope using oblique, reflected white light. Specimens chosen for this study were wild and from three ungulate species with different diets, including a folivorous browser (moose: Alces alces), a frugivore/hard object feeder (peccary: Tayassu pecari) and a grazer (zebra: Equus quagga). Two observers (the authors) independently analyzed identical sets of images, and the results of these two observers were compared. The images were randomly ordered so the observers were unaware of the taxonomic identity of the wear surfaces. Each observer partitioned microwear features into four size and shape categories. Features with a maximum/minimum diameter ratio less than four were counted as pits. Features with a maximum/minimum diameter ratio greater than four were counted as scratches. Features were further categorized as follows: large pits (maximum diameter > 20 μm), small pits (5 μm < maximum diameter < 20 μm), wide scratches (maximum width > 5 μm), and narrow scratches (maximum width < 5 μm). Pits < 5 μm were ignored because they were poorly resolved even at our highest resolution setting. “Large microwear features” (large pits and wide scratches) were quantified in a large (400 μm x 400 μm) area, and “small features” (small pits and narrow scratches) were quantified in a smaller area (150 μm x 150 μm). Interpretations of individual features were preserved by tracing over the images in a vector graphics program (Adobe Illustrator) using standardized circles (for pits) and lines (for scratches) calibrated to the diameter and width criteria that match the above described feature definitions (Figure 3). The images and interpretations of the observers are available online (www.nyit.edu/nycom/research/microwear).
Manipulation of Resolution
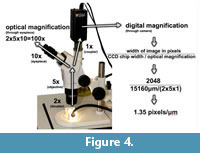
Dental casts were initially magnified 10X through the objective lens of a Zeiss Stemi light stereomicroscope and photographed with an Insight Spot 4 megapixel camera. It is important to note that light passing to the camera bypasses the eyepieces, and optical magnification afforded the camera is calculated differently than the magnification afforded the human eye (Figure 4). Pixel density in the resulting images is 1.35 pixels/μm. In other words, each pixel represents a square area of tooth surface that is 0.74 μm wide. This is the identical resolution described in Mihlbachler et al. (2012), the highest resolution used here, and the highest resolution setting possible with the instruments used.
 Starting with this initial resolution, we iteratively degraded image resolution in two different ways: by resampling digital images with fewer pixels and, secondly, by re-photographing wear surfaces with lower magnifications. Both manipulations result in equivalently lowered pixel density (Figure 2), but with different resulting resolutions (Figure 3). In the first series of manipulations, magnification remained constant, and only pixel density was varied, whereas in the second series of manipulations pixel density was altered via changes in optical magnification.
Pixel density manipulations. In the first set of analyses, 30 images (10 per species) were extracted from an earlier microwear study (Mihlbachler et al., 2012) and iteratively reanalyzed at lower pixel densities. Prior to analysis, these images were cropped to 608 pixel x 608 pixel images, covering 450 μm x 450 μm area of tooth surface, onto which the 400 μm2 and 150 μm2 areas for microwear quantification were outlined. The cropped images, with squares superimposed over them, were iteratively resampled in Adobe Photoshop with lower pixel densities, guaranteeing the identical area was being analyzed during each iteration but with fewer pixels. Resulting pixel widths, in relation to the tooth surface, were 0.74 μm (100%), 0.93 μm (80%), 1.85 μm (40%), 3.70 μm (20%), 7.41 μm (10%), and 14.81 μm (5%). Percentiles refer to the density of pixels in comparison to the original images. Data for the highest resolution (pixel width = 0.74 μm) were extracted from the earlier Mihlbachler et al. (2012) study. The remaining iterations were analyzed in reverse order, beginning with the lowest resolution first to eliminate the possibility of higher resolution images influencing the observer’s interpretations of lower resolution images.
Paired T-tests (Table 1) were used to test for interobserver differences for all of the microwear variables at different pixel densities. Type I error (falsely rejecting the null hypothesis) is expected to occur in the same frequency of the alpha level of the test (P = 0.05). A Bonferonni correction can be used to minimize type 1 error, but at the cost of increasing the probability of type II error (incorrectly retaining the null hypothesis) (Perneger, 1998). In this case, where non-rejection of the null hypothesis is the desired outcome, the Bonferonni corrected alpha value (P = 0.002) is likely to underestimate the frequency of significant interobserver error. Therefore, we take the more conservative approach and accept the results without Bonferonni corrections.
Pearson correlation coefficients (Table 2) were calculated to examine the possibility that even though observers do not consistently recognize the same numbers of scratches and pits, they may still recover highly correlated results and find similar proportional differences between species.
Magnification manipulations. Altering the magnification required rephotographing wear surfaces. We found it impossible to reidentify and photograph the identical wear surfaces on all 30 teeth used in this study. Therefore, rather than attempting to reanalyze all 30 wear surfaces at different magnifications, we selected three dental wear surfaces (one moose, one peccary, and one zebra) where we were able to outline areas of the same tooth at different magnifications that were approximately identical. These three teeth were repeatedly photographed at decreasing optical magnifications (10x, 8x, 4x, 2x, 1x, and 0.65x) and, as above, were analyzed in reverse order, from the lowest resolution to the highest. This range includes both the highest and lowest magnification settings possible with our microscope. Resulting pixel widths, in relation to the tooth surface, were 0.74 μm (100%), 0.93 μm (80%), 1.85 μm (40%), 3.70 μm (20%), 7.41 μm (10%), and 11.40 μm (6.5%). Percentiles refer to the density of pixels in comparison to the highest resolution images. We also subjected the most highly magnified images to equivalent reductions in pixel density (pixel widths = 0.74 μm (100%), 0.93 μm (80%), 1.85 μm (40%), 3.70 μm (20%), 7.41 μm (10%), and 11.40 μm (6.5%).
RESULTS
 Observer Error and Resolution
Paired T-tests comparing observers one and two for the 30 images found numerous significant interobserver differences in the mean frequencies of microwear features at all pixel densities (Table 1). No clear trends linking digital resolution to interobserver differences were apparent.
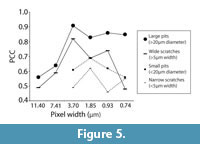
However, the data collected by both observers were significantly correlated for all microwear variables at all pixel densities (Table 2, Figure 5). Both large and small pits consistently produced higher correlation coefficients than scratches. Interobserver correlation for small microwear features (small pits and narrow scratches) was highest at 40% of the initial pixel density (pixel width = 1.85 μm). Interobserver correlation coefficients for large microwear features (large pits and wide scratches) were higher overall in comparison to small microwear features and highest at 20% of initial pixel density (pixel width = 3.70 μm).
Differentiating Diets at Different Resolutions
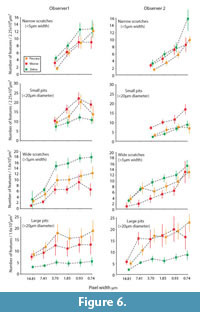 Figure 6 shows the means and standard errors for microwear features recognized at different resolutions for both observers. Pixel density had clear influence on the number of observed features. However, decreased pixel density did not obscure differences between the three species for either observer. Differences between the species were more often found among larger microwear features. Likewise, results concerning large microwear features were more consistent between observers and across different resolution levels. Species-level differences for small microwear features were less significant overall and more sensitive to decreased pixel density.
Small microwear features. Small microwear features were not observed at the two lowest pixel densities (pixel widths = 7.41 and 14.81 μm). At higher pixel densities, both observers found significant differences in the frequencies of small microwear features. Zebra had the highest frequencies of narrow scratches, peccary the fewest, and moose with intermediate numbers. However, some inconsistencies between observers and at different resolutions were found. For example, at the highest resolution (pixel width = 0.74 μm), observer two found zebra to have significantly more scratches than moose and peccary, but this result was not repeated by observer one, nor was it replicated by observer two at other resolutions. Both observers found significant differences in the frequency of small pits between zebra and moose at all but the lowest resolution levels where small features were observable (pixel width = 3.70 μm). The second observer always found peccary and moose to have significantly different numbers of small pits, whereas observer one produced more variable results on the relative proximity of the peccary with respect to the moose and zebra.
Large microwear features. Large features were seen by both observers at all pixel densities tested. Species differences found in the large microwear features were most prominent and had the most interobserver agreement at resolutions between 20-80% of initial pixel density (pixel width = 0.93μm - 7.41μm). However, the responses of each observer to manipulation of pixel density were non-identical. For observer one, the degree of resolution had little effect on the number of large microwear features recognized, except at the lowest resolutions (pixel widths = 7.41 and 14.81 μm). Observer two was more sensitive to resolution degradation, particularly for scratches. However, these observer-specific responses had little effect on the recognition of differences between the species. Both observers found the zebra to have significantly higher frequencies of wide scratches than moose at all but the highest and lowest resolutions. Both observers generally found the frequency of wide scratches in the peccary microwear images to be intermediate between the zebra and moose but with inconsistency at some pixel densities regarding the relative proximity of the peccary to the zebra and the moose. However, both observers found the zebra to have significantly fewer large pits than the other species, with insignificant differences between the moose and peccary.
 Magnification versus Pixel Density
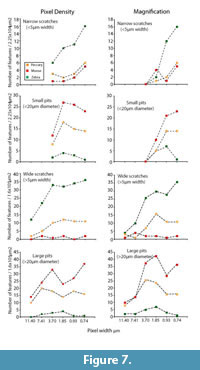
Figure 2 suggests that changes in magnification have more profound effect on resolution than equivalent changes in pixel density. Figure 7 demonstrates the differential consequences to microwear data for observer one when resolution is degraded by reducing magnification versus reducing pixel density for three images. Surprisingly, higher frequencies of features, particularly pits, were occasionally recorded at lower resolutions. We did find similar instances in the larger data set of 30 images (Figure 6) where pit counts occasionally increased with reduced pixel density, however, the standard errors for the mean values suggest that this phenomenon is statistically insignificant. Reduction of pixel density did not have a major impact on the proportional differences between the three images. Reducing magnification resulted in more inconsistent proportional differences between the specimens. Observer one rapidly lost the ability to see differences in small microwear features between these specimens when magnification was less than 80% of initial magnification. Large microwear features were less sensitive to magnification changes, and the observer found similar differences between the three specimens as the magnification was 20% or more of the highest setting.
DISCUSSION
Comparisons with Prior LDM Studies
Before answering the three questions set forth in the final paragraph of the introduction regarding resolution in dental microwear analysis, it is important to consider how the range of resolutions tested here compare to those of prior LDM studies. The lowest resolution images tested in this study are clearly cruder than any prior LDM study. As far as we can ascertain, the highest resolution images tested in our study are either more finely resolved or similar to the resolutions of most prior LDM studies. Stereoscopic LDM studies, where microwear features are quantified through the eyepieces of the stereomicroscope without digital photography typically adopt a magnification of 35X (Solounias and Semprebon, 2002; Semprebon et al., 2004). One stereoscopic LDM study on rodents used higher magnification (70X) (Nelson et al., 2005). Because optical and digital magnification are non-analogous, comparison of resolutions for these two methods is subjective. We visually examined specimens through the eyepieces using magnifications adopted by other stereoscopic LDM studies and compared them to our digital images. Smaller microwear features and greater numbers of microwear features were visible in our digital images than were visible through the eyepieces at 35x or 70x.
The microphotographic method introduced by Merceron et al. (2005a, 2005b) reports an optical magnification of 30x. Digital density was reported in two ways: 300dpi (dots per inch) and 1 pixel/μm. It is unclear what is meant by “dpi” in this context or how it relates to image resolution. However, a pixel density of 1 pixel/μm (pixel width = 1 μm) is slightly less resolved than our maximum digital density of 1.35 pixels/μm (pixel width = 0.74 μm). Rodrigues et al. (2009) and Firmat et al. (2011) conducted microphotographic LDM studies on small rodents at a magnification reported to be 100x. Details of digital resolution were not reported in these studies. It is important to clarify at this point that light diverted to typical microscope cameras does not pass through the eyepiece, therefore the magnification of the eyepiece is generally not a factor in the magnification of the digital images (Figure 4). It is unclear if the reported magnifications of any microphotographic studies refer to the magnification afforded the human eye (i.e., objective x eyepiece) or that of the digital camera (objective x coupler). Rodrigues et al. (2009) recognized pits <5μm in diameter even though they ignored pits of that size. We readily observed pits <5μm but ignored them due to their poorly resolved appearance even at our highest resolution setting. Ultimately, because methods have been incompletely reported, we are uncertain how our resolutions relate specifically to prior microphotographic LDM studies.
Is There an Optimal Resolution for Recognizing Dietary Differences?
We were unable to find an optimal resolution for maximally differentiating microwear patterns. There was a wide range of resolution within which differences between the three species could be readily differentiated. Even at the crudest resolutions tested, we were able to find statistically significant differences in average pit and scratch frequencies. Nonetheless, resolution clearly influenced the interpretation of individual images and mostly reduced the frequencies of observed features. Resolution influences both the number of observable features and the apparent size distribution of features (i.e., the relative numbers of large and small features) by eliminating small features faster than large features. The size of features and the relative frequencies of differently sized microwear features have been unanimously recognized as important aspects of dental microwear data. We arbitrarily divided microwear features into two size categories (large and small) although microwear feature size is continuous. The resolution with which wear surfaces are viewed will determine the lower size limit of observable features. Therefore the apparent size distribution of microwear features (the proportion of large and small features), and possibly to a lesser extent, the proportion of pits to scratches, are resolution dependent.
While magnification and pixel density both influenced the frequency of observed features, magnification changes had a more dramatic impact. The species-specific trend lines produced by magnification changes crossed in Figure 7, whereas the trend lines did not cross when only pixel density was altered. Therefore, changes in magnification did distort the proportional differences in the numbers of pits and scratches in these images, although changes in pixel density did not dramatically alter the perception of proportional differences. Therefore, it appears that variation in magnification may have a greater tendency to alter and distort the perceived differences in microwear patterns between images or between samples. This might suggest that proportional differences in observed raw frequency data (pit and scratch counts) may not have equivalent paleoecological significance at all resolutions adopted in LDM studies.
How Does Observer Bias Interact with Resolution?
Our attempts to measure observer error here and elsewhere (Mihlbachler et al., 2012) leave us with little hope that different observers can recover equivalent microwear data. Nonetheless, interobserver correlation is consistently significant and suggests that dimensionless aspects of microwear data (proportional differences in scratch frequency from tooth to tooth, for example) are more repeatable than raw frequency data. For this reason, there may be little value in paleodietary interpretations based on raw frequencies of pits and scratches. For similar reasons, statistical analyses of raw frequency data are questionable when collected by multiple observers, or single observers over extended intervals of time, or when data are borrowed from pre-published extant microwear databases. However, because microwear data from different observers are virtually always significantly correlated, dimensionless differences (proportional differences in the numbers of scratches, for example) are more robust to observer bias, even if the raw frequencies of microwear features are often unequal.
It might at first seem more probable that higher resolution would minimize observer bias because finer details are visible, thereby diminishing ambiguity in how individual microwear features can be interpreted. On the contrary, we found interobserver correlation coefficients to be higher at reduced resolution. Maximal observer correlation occurred at 20% of initial pixel density for large microwear features and at 40% of initial pixel density for small microwear features. One possible explanation for higher observer correlation at lower resolutions might be that worn overprinted features that are likely to be interpreted differently by different observers are eliminated rapidly as resolution is decreased while newer, higher contrast microwear features whose boundaries are less ambiguous may be eliminated less rapidly. This is one plausible explanation for the observer correlation peaks in Figure 5, although we are uncertain at this point if these results are a robust pattern or if they are the result of random eccentricities of the observers or the images used in the study. Further testing is needed.
Are There Advantages to Using Different Resolutions?
Microwear features may be more appropriately studied at different resolutions according to their size. The maximal interobserver correlation for small microwear features occurred at double the pixel density of maximal interobserver correlation for large microwear features. Moreover, we found lower levels of observer correlation for small microwear features at all resolutions in comparison to large microwear features. The higher observer error and sensitivity of small microwear features to resolution is clearly a product of resolution limitations. The weaker association of small microwear features with diet (Rodrigues et al., 2009; Mihlbachler et al., 2012) may also relate to resolution limitations rather than a true lack of association between diet and small dental microwear features.
Although a minority of LDM studies excludes the smallest observable microwear features (Rodrigues et al., 2009; Firmat et al., 2011), most studies seem to include all observable features. However, higher error rates and poorer association with diet suggest that the smallest, most poorly resolved microwear features introduce noise. If the data from the 30 images analyzed in this paper had been used for paleodietary interpretation, inclusion of only large, well-resolved microwear features (pits > 20 μm diameter and scratches > 5 μm width) would have minimized observer error and increased correlation with diet. Although pixel density had an effect on the frequency of both pits and scratches, there is no sign in our data that increased pixel density, beyond the range tested here, would have improved the quality of data from small features. However, the benefit of higher magnifications for analysis of small features is open to question.
CONCLUSION
There is a strong need for a standardized methodology for LDM. Repeatability will be maximized when aspects of methodology, such as magnification and pixel density, are based on tests that consider the interaction of resolution, the observer, and microwear feature size. Although different resolutions did not strongly impact the ability of either observer to identify microwear differences related to diet, we found repeatability to be highest within a very specific range of pixel densities, 20% of initial resolution (pixel width = 3.70 μm) for large microwear features, and 40% of initial resolution (pixel width = 1.85 μm) for small microwear features. This suggests that the optimal resolution for microwear analysis is dependent on the sizes of the microwear features. For the relatively low resolutions possible with light microscopy, inclusion of microwear features with a minimum dimension of ~20 μm maximizes observer correlation. Microwear features below this size produce higher error rates and are more sensitive to resolution changes. Exclusion of the smallest microwear features will amplify repeatability.
Exclusion of microwear features based on physical dimensions is most feasible for microphotographic LDM (e.g., Merceron, 2005 a, 2005b; Mihlbachler et al., 2012) and will be impractical for stereoscopic LDM methods (Solounias and Semprebon, 2002; Semprebon et al., 2004), where microwear features are subjectively categorized without standardized size criteria. Our particular study was based on large species, and it is almost certain that for smaller species, such as rodents, small microwear features may be important for paleodietary inferences. Given our results, it is doubtful that higher magnifications, above the range tested here, will produce higher quality data for small microwear features. It is probable that reliable quantification of the smallest microwear features exceeds the limits of light microscopy, and that more complex and costly methods, such as SEM or confocal texture analysis, may ultimately be necessary for reliable quantification of small microwear features.
ACKNOWLEDGMENTS
We thank M. Ayoub and N. Solounias for assistance with molding and casting of microwear specimens. E. Westwig (American Museum of Natural History) granted access to specimens. We thank NSF (grant EAR-0824657) for support to MCM. We thank N. Solounias for fruitful discussions leading up to this research.
REFERENCES
DeMiguel, D., Azanza, B., and Morales, J. 2011. Paleoenvironments and paleoclimate of the Middle Miocene of central Spain: A reconstruction from dental wear of ruminants. Palaeogeography, Palaeoclimatology, Palaeoecology, 302:452-463.
Firmat, C., Rodrigues, H.G., Hutterer, R., Rando, J.C., Alcover, J.A., and Michaux, J. 2011. Diet of the extinct Lava mouse Malpaisomys insularis from the Canary Islands: insights from dental microwear. Naturwissenschaften, 98:33-37.
Fraser, D., Mallon, J.C., Furr, R. and Theodor, J.M. 2009. Improving the repeatability of low magnification microwear methods using high dynamic range imaging. Palaios, 24:818-825.
Gordon, K.D. 1982. A study of microwear on chimpanzee molars: implications for dental microwear analysis. American Journal of Physical Anthropology, 63:195-215.
Gordon, K.D. 1984. Hominoid dental microwear: Complications in the use of microwear analysis to detect diet. Journal of Dental Research, 63:1043-1046.
Gordon, K.D. 1988. A review of methodology and quantification in dental microwear analysis. Scanning Microscopy, 2:1139-1147.
Green, J.L. 2009. Dental microwear in the orthodentine of the Xenarthra (Mammalia) and its use in reconstruction the paleodiet of extinct taxa: the case study of Nothrotheriops shastensis (Xenarthra, Tardigrada, Nothrotheriidae). Zoological Journal of the Linnaean Society, 165:201-222.
King, T., Andrews, P., and Boz, B. 1999. Effect of taphonomic processes on dental microwear. American Journal of Physical Anthropology, 108:359-373.
Merceron, G., Blondel, C., de Bonis, L., Koufos, G.D., and Viriot, L. 2005a. A new method of dental microwear analysis: Application to extant primates and Ouranopithecus macedoniensis (Late Miocene of Greece). Palaios, 20:551-561.
Merceron, G., de Bonis, L., Viriot, L., and Blondel, C. 2005b. Dental microwear of fossil bovids from northern Greece: paleoenvironmental conditions in the eastern Mediterranean during the Messinian. Palaeogeography, Palaeoclimatology, Palaeoecology, 217:173-185.
Merceron, G., Escarguel, G., Angibault, J.-M., and Verheyden-Tixier, H. 2010. Can dental microwear textures record inter-individual dietary variations? PLoS ONE, 5:e9542.
Mihlbachler, M.C., Beatty, B.L., Caldera-Siu, A., Chan, D., Lee, R. 2010. Exploring the influence of observer bias in dental microwear analysis. Journal of Vertebrate Paleontology 29:(Abstracts) 134A.
Mihlbachler, M.C., Beatty, B.L., Caldera-Siu, A., Chan, D., Lee, R. 2012. Error rates in dental microwear analysis using light microscopy. Palaeontologia Electronica Vol. 15, Issue 12A, 22p; palaeo-electronica.org/content/2012-issue-1-articles/195-microwear-observer-error
Nelson, S.V., Badgley, C., and Zakem E. 2005. Microwear in modern squirrels in relation to diet. Palaeontologia Electronica, Vol. 8; Issue 14A:1-15 p.
palaeo-electronica.org/2005_1/nelson14/issue1_05.htm
Perneger, T. 1998. What’s wrong with Bonferonni adjustments. BMJ 316:1236.
Rivals, F. and Semprebon, G.M. 2012. Paleoindian subsistence strategies and late Pleistocene paleoenvironments in the northeastern and southwestern United States: a tooth wear analysis. Journal of Archaeological Science, 39:1608-1617.
Rivals, F., Solounias, N., and Schaller, G.B. 2011. Diet of Mongolian Gazelles and Tibetan antelopes from steppe habitats using premaxillary shape, tooth mesowear and microwear analysis. Mammalian Biology, 76(3):358-364.
Rodrigues, H.G., Merceron, G., and Viriot, L. 2009. Dental microwear patterns of extant and extinct Muridae (Rodentia, Mammalia): ecological implications. Naturwissenschaften, 96:537-542.
Schubert, B., Ungar, P.S., and DeSantis, L.R.G. 2010. Carnassial microwear and dietary behaviour in large carnivorans. Journal of Zoology, 280:257-263.
Scott, R., Schubert, B., Grine, F.E., and Teaford, M.F. 2008. Low magnification microwear: Questions of precision and repeatability. Journal of Vertebrate Paleontology, 28 (Abstracts):139A.
Scott, R.S., Teaford, M.F., and Ungar, P.S. 2012. Dental microwear texture and anthropoid diets. American Journal of Physical Anthropology, in press.
Scott, Robert S., Ungar, Peter S., Bergstrom, Torbjorn S., Brown, Christopher A., Childs, Benjamin E., Teaford, Mark F., Walker, Alan, 2006. Dental microwear texture analysis: technical considerations. Journal of Human Evolution, 51:339-349.
Semprebon, G., Godfrey, L., Solounias, N., Sutherland, M.R., and Jungers, W.L. 2004. Can low-magnification stereomicroscopy reveal diet? Journal of Human Evolution, 47:115-144.
Solounias, N. and Semprebon, G. 2002. Advances in reconstruction of ungulate ecomorphology with applications to early fossil equids. American Museum Novitates, 3366:1-49.
Solounias, N., Rivals, F., and Semprebon, G.M. 2010. Dietary interpretation and paleoecology of herbivores from Pikermi and Samos (late Miocene of Greece). Paleobiology, 36:113-136.
Teaford, M.F. 1991. Dental microwear: what can it tell us about diet and dental function?, p. 341-356. In M.A. Kelley and C.S. Larsen (eds.), Advances in Dental Anthropology. Alan R. Liss, New York.
Townsend, K.E. and Croft, D.A. 2008a. Diets of Notoungulates from the Santa Cruz Formation, Argentine: New Evidence from enamel microwear. Journal of Vertebrate Paleontology, 28(1):217-230.
Townsend, K.E. and Croft, D.A. 2008b. Enamel microwear in caviomorph rodents. Journal of Mammalogy, 89(3):730-743.
Ungar, P.S., Scott, R.S., Grine, F.E., and Teaford, M.F. 2010. Molar microwear textures and the diets of Australopithecus anamensis and Australopithecus afarensis. Philosophical Transactions of the Royal Society of London B, 365:3345-3354.
