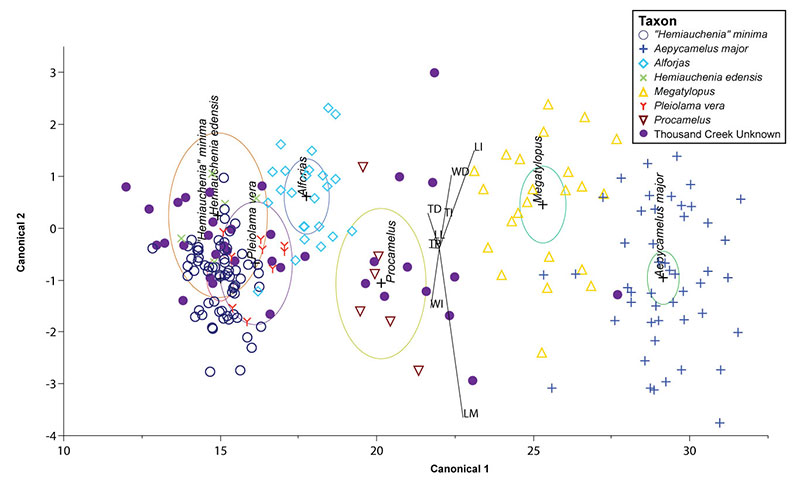
FIGURE 1. Illustration of astragali showing the dimensions used in this study. After DeGusta and Vrba (2003). 1.1, medial view; 1.2, lateral view; 1.3, anterior view. Abbreviations: LM= medial length; LI= intermediate length; LL= lateral length; TD= distal thickness; TI= intermediate thickness; TP= proximal thickness; WD= distal width; WI= intermediate width.
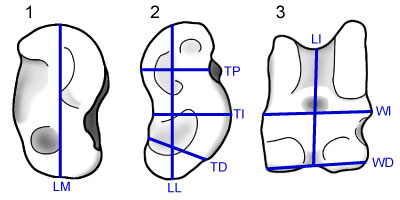
FIGURE 2. Principal Components of known astragali and Thousand Creek astragali illustrating the array of specimens along PC1, but no obvious differences along PC2. While a qualitative examination of PC2 produces no distinction, Tukey's HSD test indicates two separate groups (see Table 3). The Thousand Creek specimens show a single clear break in size, but without the DFA it would be impossible to quantify the certainty of group membership of specimens near the breaks between taxa.
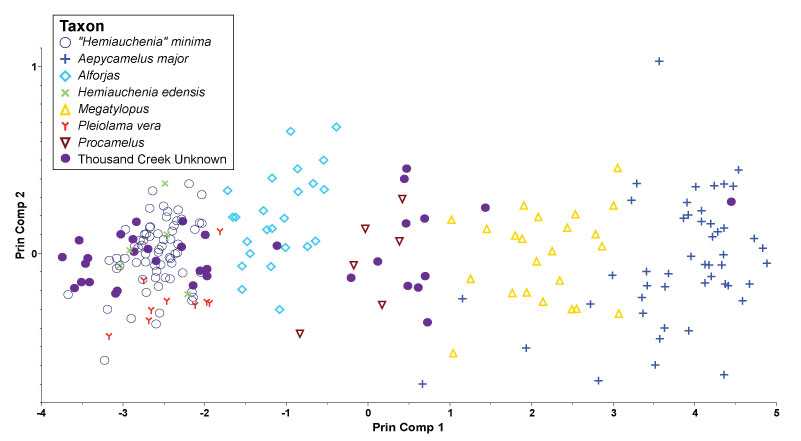
FIGURE 3. First two discriminant axes from species-level analysis. Camel taxa from the training set are indicated by the same shapes and colors as Figure 2. Ellipses show the 95% confidence interval of the true mean.