Direct ESR dating of the Pleistocene vertebrate assemblage from Khok Sung locality, Nakhon Ratchasima Province, Northeast Thailand
TABLE S1. Lithologic descriptions of the Khok Sung sand pit in Nakhon Ratchasima Province, Northeastern Thailand.
| Lithostratigraphic unit | Thickness (cm) | Sedimentary structure | Sedimentary composition (e.g., color, texture, sorting, roundness) |
| A | 10-15 | Homogeneous bedding | Dark brownish-silty mud, homogeneous texture, very poor sorting, abundant plant remains (root, root traces, wood fragments). |
| B | 80-100 | Horizontal bedding | Brownish-silty mud, very poor sorting, plant remains (root and wood fragments) |
| C | 100-150 | Slickenside | Brownish yellow to dark brownish color, fine-sandy mud with humic substances, very poor sorting, black Mn and Fe isolites, carbonate concretions and plant remains (about 20%). |
| D | 120-220 | Fining upward sequence, trough and tabular cross-lamination | Light brownish to dark brownish color, fine to coarse sand, well sorting, sub-rounded to rounded shape, plant remains (root and wood fragments). |
| E | 80-100 | Fining upward sequence, high angle planar and trough cross-lamination | Light pinkish gray to dark gray color, fine to medium sand, moderate to well sorting, subangular to subrounded shape, gray carbonate mud clasts, mud lenses, abundant petrified wood fragments and trunks. |
| F | 50-70 | Horizontal bedding, fining upward sequence | Gray to dark gray color, coarse to very coarse sand and matrix-supported gravel (quartz and silicified rocky grains), well sorting, sub-rounded to rounded shape, layered silty-muddy lenses interbedded at the upper part, plant (leaves and seeds at the silty mud layers) and vertebrate remains (abundant at the lowermost part). |
| G | 10-20 | Horizontal bedding, coarsening upward sequence | Gray to dark gray color, grained supported gravel (rich calcareous mud clasts, slightly quartz and silicified rocky grains, 1-3 cm in sizes), very poor sorting, sub-angular to sub-rounded shape. |
| H | 80-100 | Horizontal bedding, fining upward sequence | Dark gray silty mud, moderate to well sorting, interbedded fine-sandy lenses, plant remains (abundant at the upper part). |
| I | 25-80 | Fining upward sequence with underlying sharp contact, trough cross-lamination | Pinkish gray fine to medium sand, well sorting, sub-angular to sub-rounded shape, and gray to dark gray grained supported gravel at the lowermost part (slightly calcareous mud clasts, abundant quartz and silicified rocky grains, 1-3 cm in sizes), poor to very poor sorting, sub-angular to sub-rounded shape. |
TABLE S2. ESR data collected from the six samples. Fitting results derived from the use of Dmax = 4019 Gy are given for comparison. Note that the De errors used for age calculation includes an additional 2.3% error on the gamma source dose rate (Table 3 and Table 5).
| Sample | D max (Gy) |
D E value (Gy) |
D max /D E | Adj. r-Square |
D max (Gy) |
D E value (Gy) |
D max /D E | Adj. r-Square |
D E ratio |
| 3545 | 642 | 73.2 ± 3.9 | 8.8 | 0.9972 | 4019 | 72.0 ± 1.8 | 55.8 | 0.9987 | 1.02 |
| 3546A | 642 | 99.4 ± 3.6 | 6.5 | 0.9988 | 4019 | 101.7 ± 1.7 | 39.5 | 0.9994 | 0.98 |
| 3546B | 1005 | 131.5 ± 4.1 | 7.6 | 0.9990 | 4019 | 136.6 ± 2.8 | 29.4 | 0.9991 | 0.96 |
| 3547 | 1005 | 135.7 ± 5.5 | 7.4 | 0.9983 | 4019 | 143.1 ± 3.4 | 28.1 | 0.9988 | 0.95 |
| 3548 | 2009 | 313.0 ±11.4 | 6.4 | 0.9983 | 4019 | 313.0 ± 7.7 | 12.8 | 0.9988 | 1.00 |
| 3549 | 1005 | 124.0 ± 4.2 | 8.1 | 0.9988 | 4019 | 132.6 ± 3.1 | 30.4 | 0.9988 | 0.94 |
TABLE S3. Initial combined US-ESR dating results obtained from using a gamma dose rate derived from mean concentration values of the 13 sediment samples.
| SAMPLE | 3545 | 3546A | 3546B | 3547 | 3548 | 3549 |
| Internal dose rate (μGy/a) | 110 ± 35 | 12 ± 5 | 11 ± 4 | 18 ± 7 | 80 ± 49 | 44 ± 13 |
| Beta dose rate, tissue 1 (dentine) (μGy/a) | 39 ± 11 | 3 ± 0 | 2 ± 0 | 92 ± 31 | 884 ± 351 | 151 ± 31 |
| Beta dose rate, sediment or tissue 2 (μGy/a) | 13 ± 3 | 44 ± 9 | 224 ± 63 | 61 ± 17 | 54 ± 13 | 61 ± 12 |
| Gamma dose rate (μGy/a) | 470 ± 79 | 470 ± 79 | 470 ± 79 | 470 ± 79 | 470 ± 79 | 470 ± 79 |
| Cosmic dose rate (μGy/a) | 109 ± 12 | 109 ± 12 | 109 ± 12 | 109 ± 12 | 109 ± 12 | 109 ± 12 |
| Total dose rate (μGy/a) | 742 ± 87 | 639 ± 79 | 816 ± 101 | 751 ± 85 | 1598 ± 363 | 836 ± 86 |
| p-enamel | -0.64 | 0.97 | 1.07 | 0.89 | 0.28 | 0.81 |
| p-tissue 1 (dentine) | 0.00 | 1.66 | 3.36 | 2.09 | 0.13 | 2.32 |
| p-tissue 2 | - | - | 3.01 | - | - | - |
| Combined US-ESR age (ka) | 98 +16 -12 | 155 +26 -18 | 161 +24 -21 | 180 +26 -19 | 195 + 51 -32 | 148 +19 -14 |
| Combined CSUS-ESR age (ka) | 105 ± 15 | 156 ± 21 | 176 ± 25 | 202 ± 27 | 280 ± 41 | 175 ± 23 |
FIGURE S1. Pictures of the cross-sections from the five fossil teeth analysed by LA-ICP-MS analyses (ablation spots are visible). The same scale applies to all pictures.
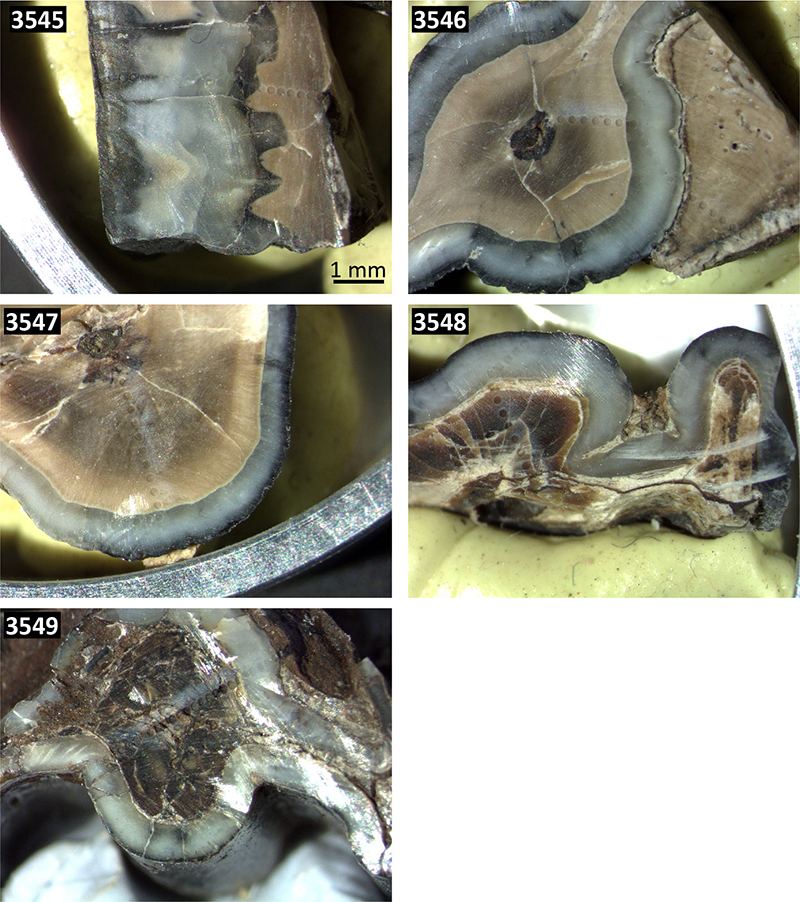
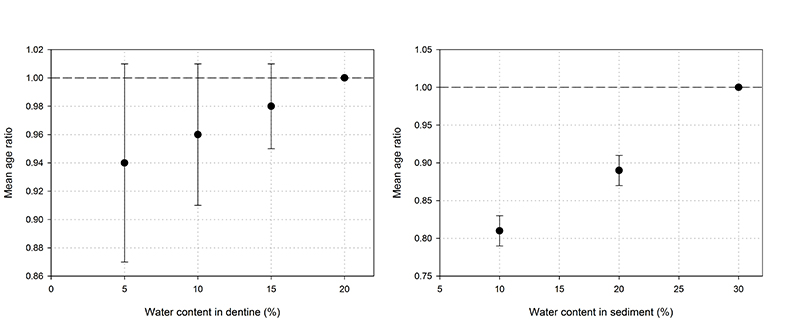
FIGURE S2. Impact of the water content on the calculated US-ESR ages. Age results obtained for 20% water in dentine and 30% water in sediment are taken as references. Simulations were performed for the 6 samples with 5, 10, 15 % water in dentine. Mean value and associated standard deviation (vertical error bar) were extracted and compared with reference values. A similar procedure was employed for the water content in sediment (simulations performed with 10 and 20% water).