FIGURE 1. Map showing the locations of the considered sites, which are numbered according to Table 1.
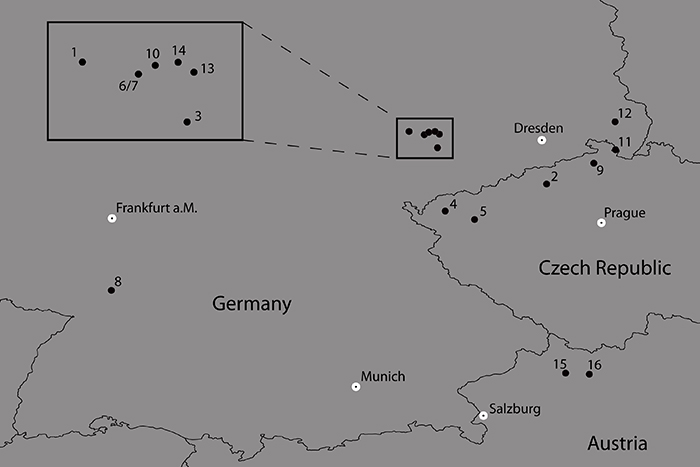
FIGURE 2. Plasticity index (PI) of various leaf traits, for the considered sites and taxa. 2A: PI for lamina area. 2B: PI for lamina length. 2C: PI for lamina perimeter. 2D: PI for lamina width. 2E: PI for lamina circularity. 2F: PI for lamina centroid. Squares: Platanus neptuni. Circles: Daphnogene cinnamomifolia. Triangles: Eotrigonobalanus furcinervis. Colors indicate deposit type. Green: fluviatile. Red: volcanic. Blue: marine. Lines delimit age groups. LE: Late Eocene. EO: Early Oligocene. LO: Late Oligocene. EM: Early Miocene. For site numbers and dating see Table 1.
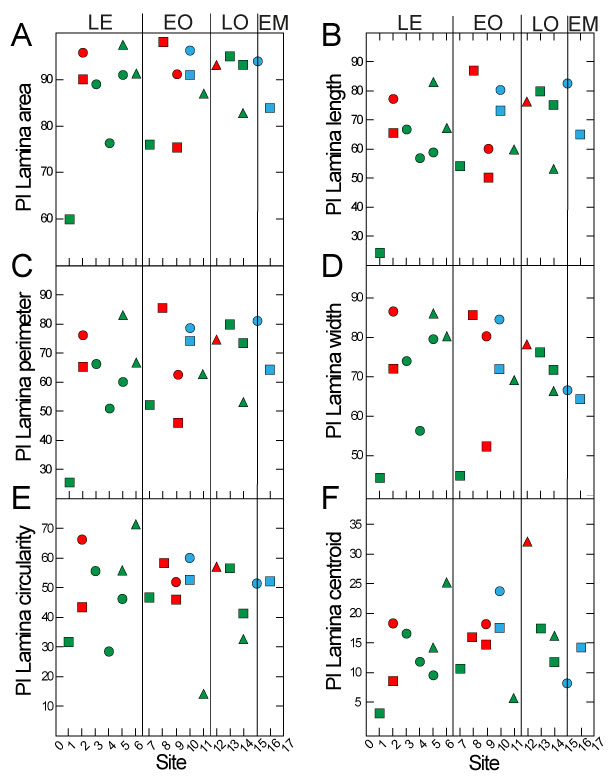
FIGURE 3. Site-specific data for lamina area and lamina perimeter plotted for each taxon. 3A: Lamina area for P. neptuni. 3B: Lamina perimeter for Platanus neptuni. 3C: Lamina area for Eotrigonobalanus furcinervis. 3D: Lamina perimeter for E. furcinervis. 3E: Lamina area for Daphnogene cinnamomifolia. 3F: Lamina perimeter for D. cinnamomifolia. The boxes span the 50% interquartile. The horizontal lines within the boxes indicate the median values. The “whiskers” mark the highest and lowest values. Outliers located at a distance of up to 1.5 times the quartile span outside the whiskers are drawn as asterisks, and extreme outliers are drawn as circles. Different minuscule letters indicate statistically significant differences among sites. Colors indicate deposit type. Green: fluviatile. Red: volcanic. Blue: marine. Lines delimit age groups. LE: Late Eocene. EO: Early Oligocene. LO: Late Oligocene. EM: Early Miocene. For site numbers and dating see Table 1.
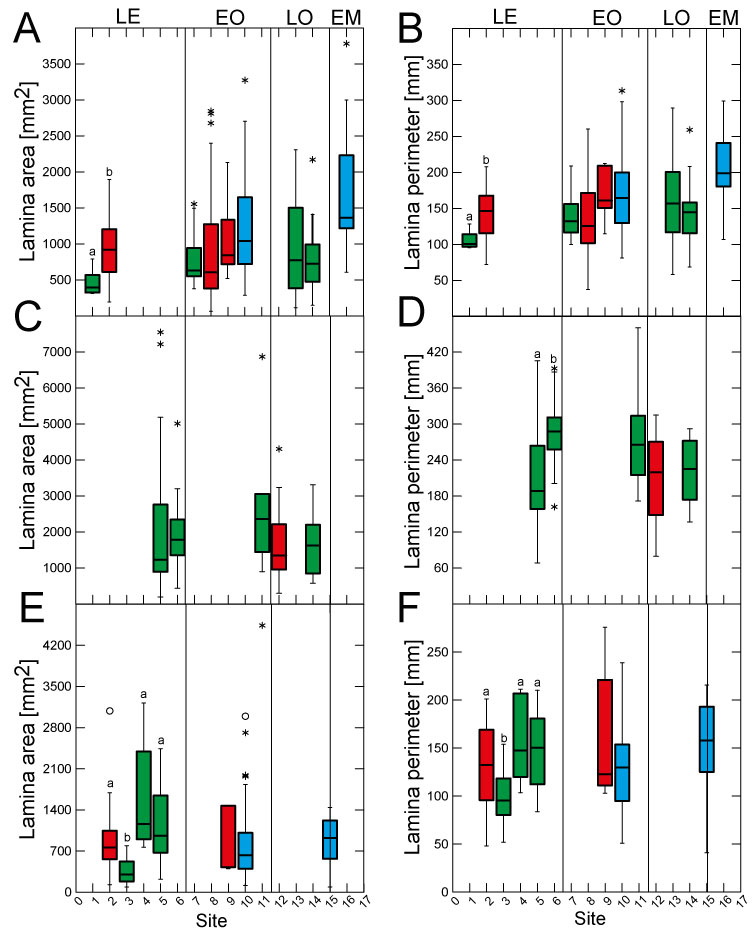
FIGURE 4. Site-specific data for lamina length and lamina width plotted for each taxon. 4A: Lamina length for P. neptuni. 4B: Lamina width for Platanus neptuni. 4C: Lamina length for Eotrigonobalanus furcinervis. 4D: Lamina width for E. furcinervis. 4E: Lamina length for Daphnogene cinnamomifolia. 4F: Lamina width for D. cinnamomifolia. The boxes span the 50% interquartile. The horizontal lines within the boxes indicate the median values. The “whiskers” mark the highest and lowest values. Outliers located at a distance of up to 1.5 times the quartile span outside the whiskers are drawn as asterisks, and extreme outliers are drawn as circles. Different minuscule letters indicate statistically significant differences among sites. Colors indicate deposit type. Colors indicate deposit type. Green: fluviatile. Red: volcanic. Blue: marine. Lines delimit age groups. LE: Late Eocene. EO: Early Oligocene. LO: Late Oligocene. EM: Early Miocene. For site numbers and dating see Table 1.
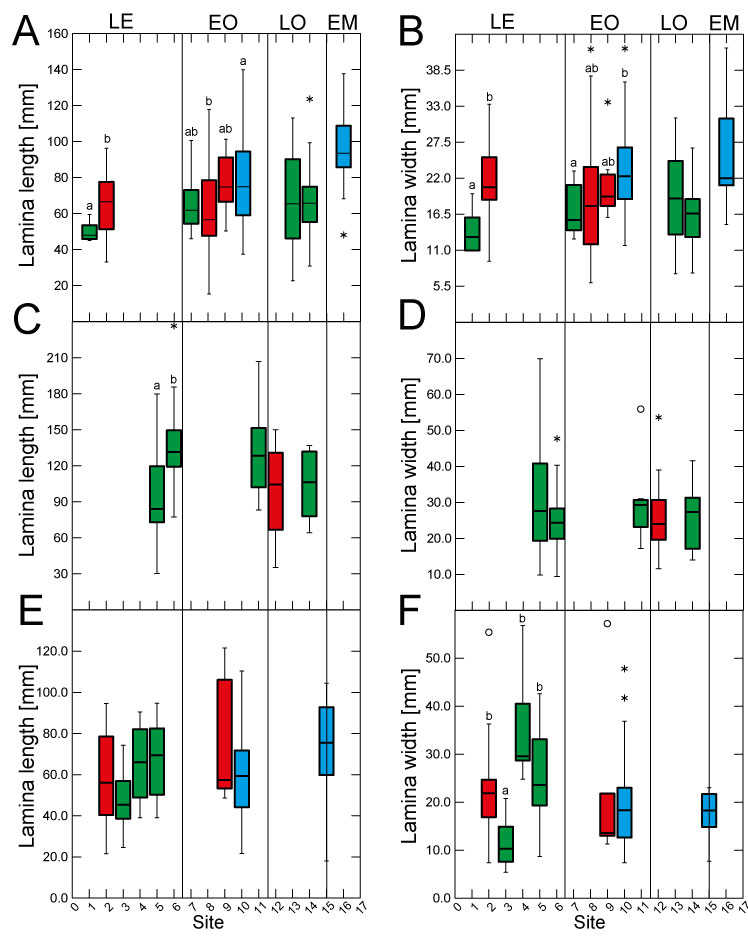
FIGURE 5. Site-specific data for lamina circularity and lamina roundness plotted for each taxon. 5A: Lamina circularity for Platanus neptuni. 5B: Lamina roundness for P. neptuni. 5C: Lamina circularity for Eotrigonobalanus furcinervis. 5D: Lamina roundness for E. furcinervis. 5E: Lamina circularity for Daphnogene cinnamomifolia. 5F: Lamina roundness for D. cinnamomifolia. The boxes span the 50% interquartile. The horizontal lines within the boxes indicate the median values. The “whiskers” mark the highest and lowest values. Outliers located at a distance of up to 1.5 times the quartile span outside the whiskers are drawn as asterisks, and extreme outliers are drawn as circles. Different minuscule letters indicate statistically significant differences among sites. Colors indicate deposit type. Colors indicate deposit type. Green: fluviatile. Red: volcanic. Blue: marine. Lines delimit age groups. LE: Late Eocene. EO: Early Oligocene. LO: Late Oligocene. EM: Early Miocene. For site numbers and dating see Table 1.
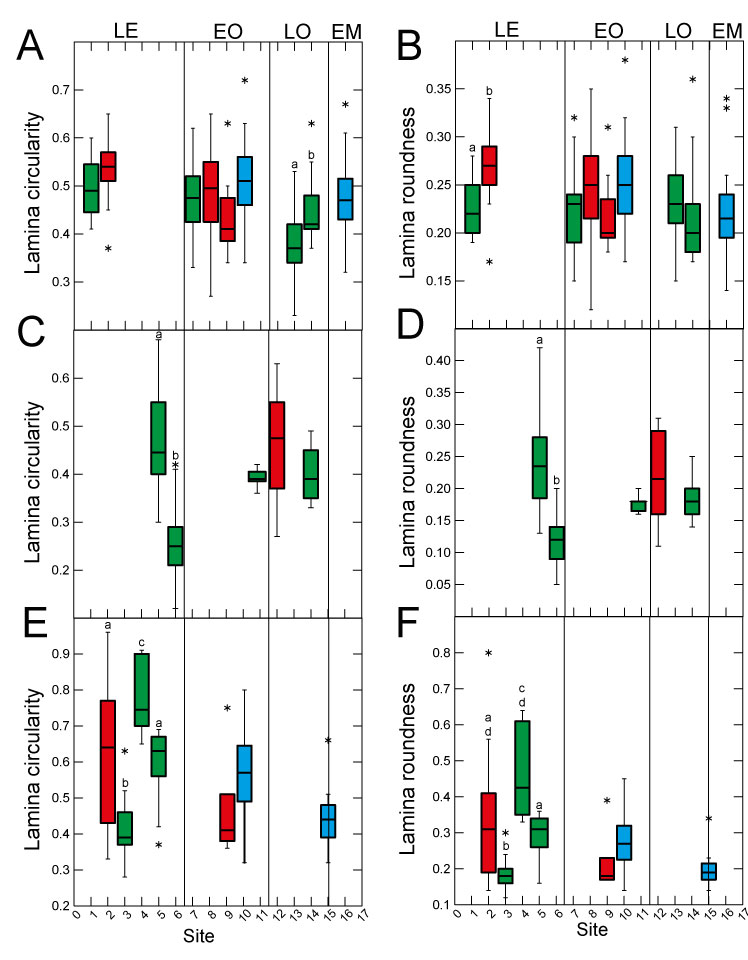
FIGURE 6. Site-specific data for lamina centroid and leaf length-to-width ratio (LWR) plotted for each taxon. 6A: Lamina centroid for Platanus neptuni. 6B: LWR for P. neptuni. 6C: Lamina centroid for Eotrigonobalanus furcinervis. 6D: LWR for E. furcinervis. 6E: Lamina centroid for Daphnogene cinnamomifolia. 6F: LWR for D. cinnamomifolia. The boxes span the 50% interquartile. The horizontal lines within the boxes indicate the median values. The “whiskers” mark the highest and lowest values. Outliers located at a distance of up to 1.5 times the quartile span outside the whiskers are drawn as asterisks, and extreme outliers are drawn as circles. Different minuscule letters indicate statistically significant differences among sites. Colors indicate deposit type. Colors indicate deposit type. Green: fluviatile. Red: volcanic. Blue: marine. Lines delimit age groups. LE: Late Eocene. EO: Early Oligocene. LO: Late Oligocene. EM: Early Miocene. For site numbers and dating see Table 1.
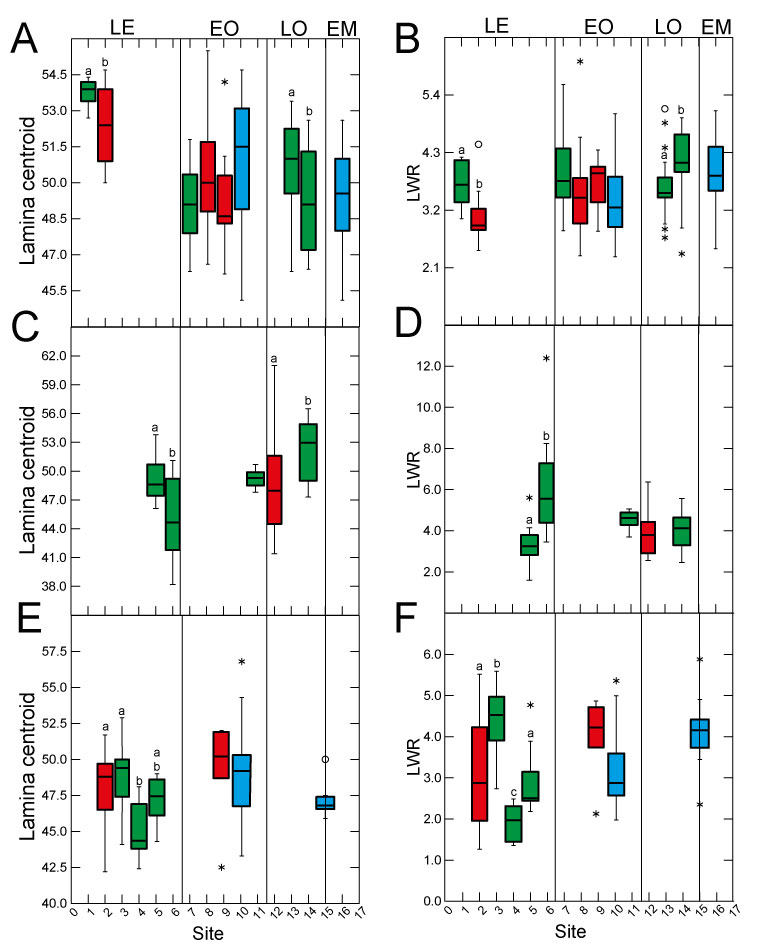
FIGURE 7. Age-specific discriminant analysis using all morphometric parameters for all sites. 7A: Eocene. 7B: Oligocene. Triangles: Platanus neptuni. Squares: Eotrigonobalanus furcinervis. Circles: Daphnogene cinnamomifolia.
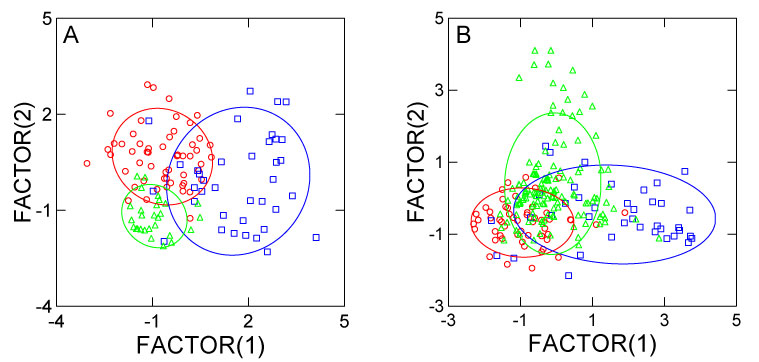
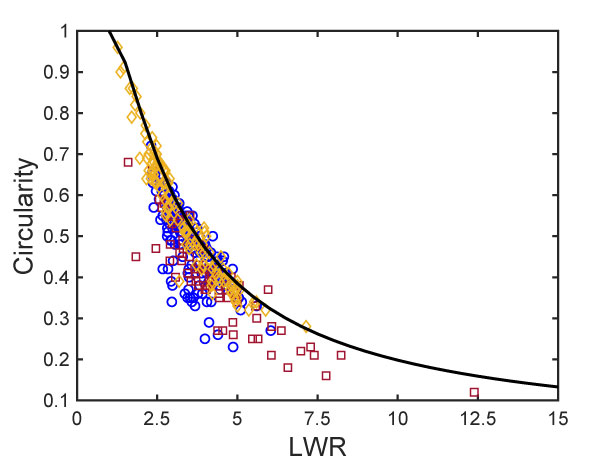
FIGURE 8. Circularity plotted against LWR. Blue circles: Platanus neptuni. Red squares: Eotrigonobalanus furcinervis. Yellow diamonds: Daphnogene cinnamomifolia. Black line: Relationship between circularity and length-to-width ratio of an ellipse. Please note that this relationship was calculated by using an approximate equation for the perimeter of an ellipse, which causes the slight deflection of the curve for high circularity values. As approximation, the following equation for the ellipse perimeter (EP) was used:
EP = π* [2 * (a2 + b2) 1/2].