FIGURE 1. Geological context of the site studied. A, General field photograph of the upper part of the Totland Bay Member, including the How Ledge Limestone, and overlying Colwell Bay Member, SW Headon Hill, Isle of Wight. B; detailed photograph of bed TB30-34, with scale divisions measuring 10 cm; C, location map of coastal Hampshire and the western half of the Isle of Wight, with period level geology and sites mentioned in the text; D, Lithic log of the How Ledge Limestone and adjacent beds. Bed numbers are from Hooker (2021).
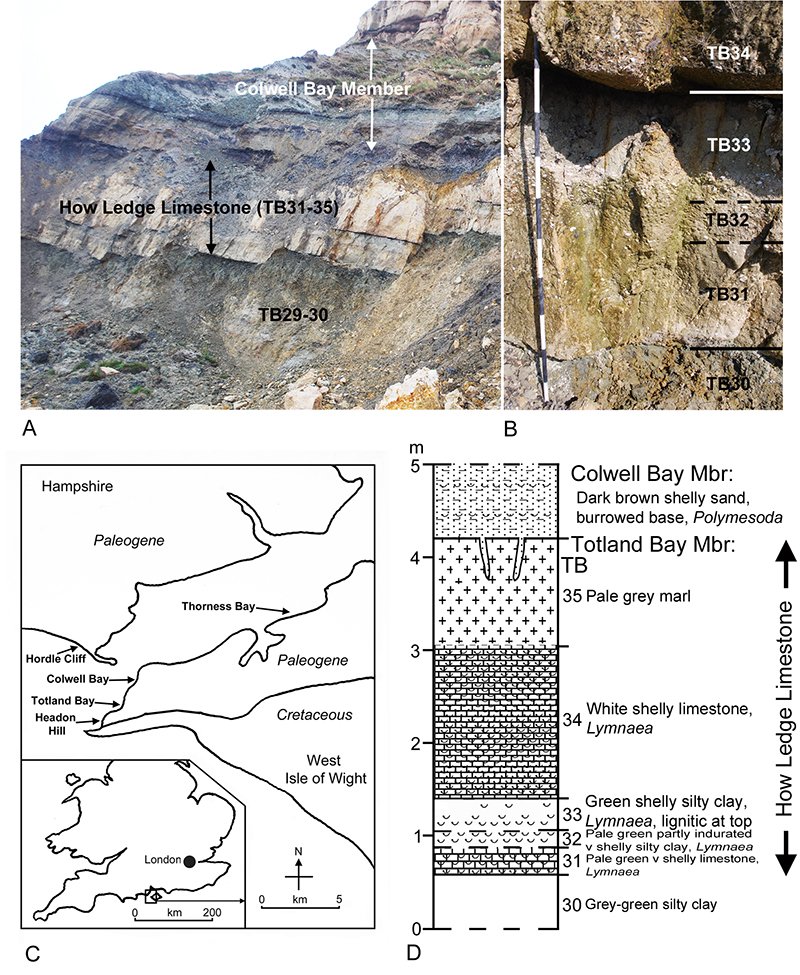
FIGURE 2. Percentages of the minimum numbers of individuals (MNI) of each family of micromammals from bed TB33, How Ledge Limestone, SW Headon Hill. See Table 1 for numerical data.
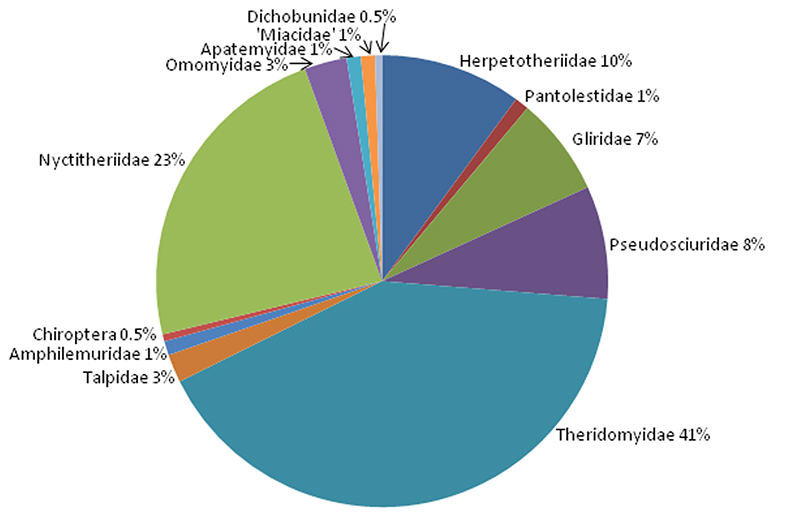
FIGURE 3. Percentages of etched bones and teeth (left Y axis and left two X axis plots) and breakage types of elongate bones (right Y axis and right three X axis plots) for the four best represented micromammalian families in bed TB33, How Ledge Limestone. Fresh bones are those broken while still fresh, showing irregular spiral breakage. Rounded indicates bones with rounded (etched) broken edges. Dry indicates bones with broken edges perpendicular to their long axes. See Table 5, Table 6, Table 7 for numerical data.
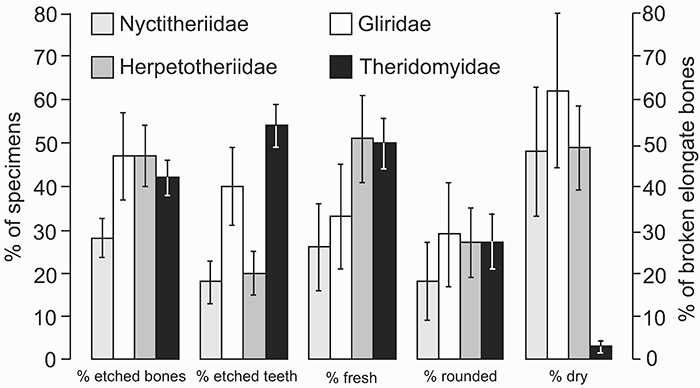
FIGURE 4. Scanning electron micrographs of teeth and bones of Theridomyidae and teeth of Pseudosciuridae, from bed TB33, How Ledge Limestone, SW Headon Hill, showing damage. A-C, Thalerimys fordi; D-F, ? Thalerimys; G, Treposciurus mutabilis; H-I, Tarnomys quercyi vectisensis. A, Right M1/2 (M67681) in etching group 2; B, left M1/2 (M67682) in etching group 3; C, right M1/2 (M67683) in etching group 4; D, proximal radius (M61425), showing etching on the epiphysis and parallel grooves perpendicular to the long axis; E, proximal metapodial (M61438) with multiple fine parallel grooves perpendicular to the long axis on both edges; F, enlarged detail of E; G, left M1/2 (M61749) in etching group 2; H, right M1/2 (M61753) in etching group 2; I, right M3 (M61754) in etching group 4. Arrows highlight areas of maximum etching on A-C, G-I. Scale equals 0.5 mm for A-D, F-I, 1 mm for E.
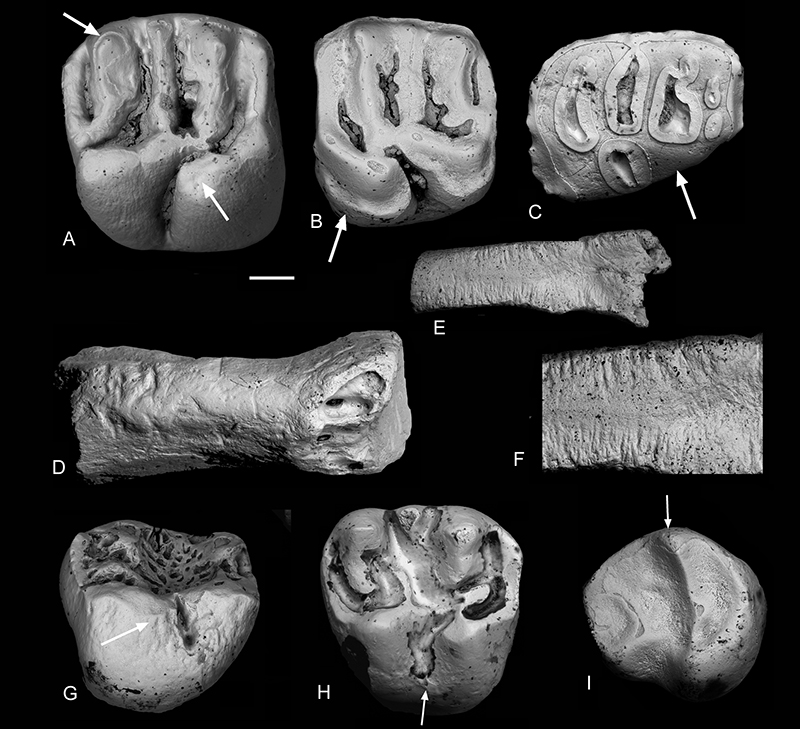
FIGURE 5. Scanning electron micrographs of teeth and bones of Gliridae from bed TB33, How Ledge Limestone, SW Headon Hill, showing damage. A, right M3 (M67699) of Bransatoglis bahloi in etching group 5 (arrows); B-C, right P4 (M67684) of Glamys priscus, showing very fine irregular grooves on the root (B is enlarged detail); D, left lower incisor (M67685) of Gliridae, showing splitting from weathering stage 1; E, proximal phalanx 1 (M67686) of Gliridae, showing rounded breakage and grooves perpendicular to the long axis (arrows); F, proximal metatarsal III (M67687) of Gliridae, showing spiral rounded fracture; G, proximal left femur (M61428) of Gliridae, showing etching (arrows) and spiral breakage without rounding. Scale bars equal 0.2 mm for A, C-E, 0.5 mm for F-G, 0.1 mm for B.
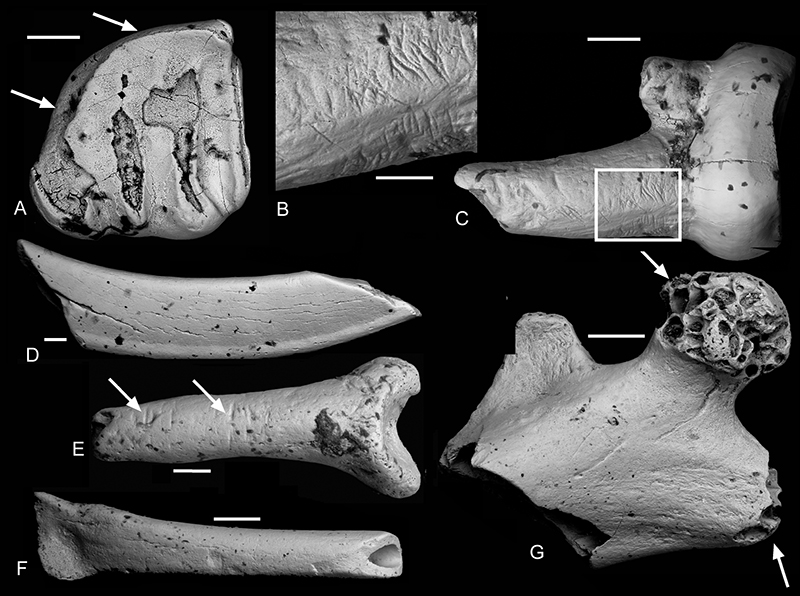
FIGURE 6. Scanning electron micrographs of teeth and bones of Herpetotheriidae from bed TB33, How Ledge Limestone, SW Headon Hill, showing damage. A, right M3 (M67688) of Amphiperatherium species B, in etching group 1; B, enlarged detail of A; C, right M2 (M67689) of Amphiperatherium species A, in etching group 2; D, left M4 (M67690) of Amphiperatherium species A, in etching group 4; E, right calcaneum (M67691) of Herpetotheriidae, showing etching on the sustentaculum edge and tuber tip; F, left upper incisor (M67680) of Herpetotheriidae, showing two puncture marks on its root; G, enlarged detail of F. Arrows highlight areas of maximum etching on C-E. Scale bars equal 0.3 mm for A, C-E, 0.1 mm for B, G.
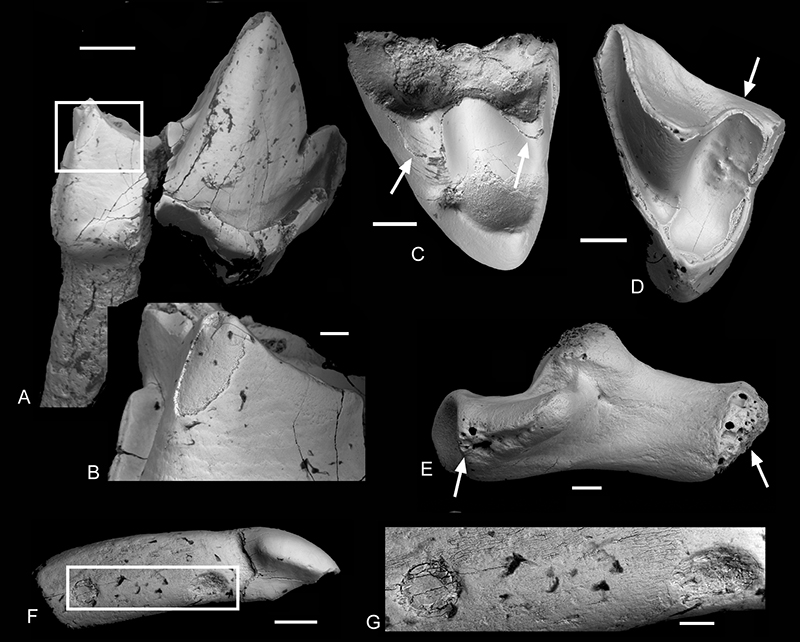
FIGURE 7. Scanning electron micrographs of teeth and bones of Nyctitheriidae and teeth of Omomyidae, Apatemyidae and Amphilemuridae from bed TB33, How Ledge Limestone, SW Headon Hill, showing damage. A, right dentary with M2 (M67692) of Cheilonyctia lawsoni, showing etching group 5 and rounded breakage anteriorly, sharp breakage posteriorly; B, right I2 (M67693) of C. lawsoni, showing dentine exposure of etching group 5; C, distal left humerus (M67694) of Nyctitheriidae, showing sharp spiral irregular breakage; D, right M1/2 (M62126) of Vectipithex smithorum, showing almost total loss of enamel, of etching group 5; E, right M1 (M67695) of Heterohyus nanus, showing etching group 4; F, left P2 (M61711) of Gesneropithex latidens, showing etching group 2; G, enlarged detail of F. Arrows highlight areas of maximum etching on A-B, E and the only remaining enamel on D. Scale bars equal 1 mm for A and C, 0.5 mm for D-F, 0.25 mm for G and 0.2 mm for B.
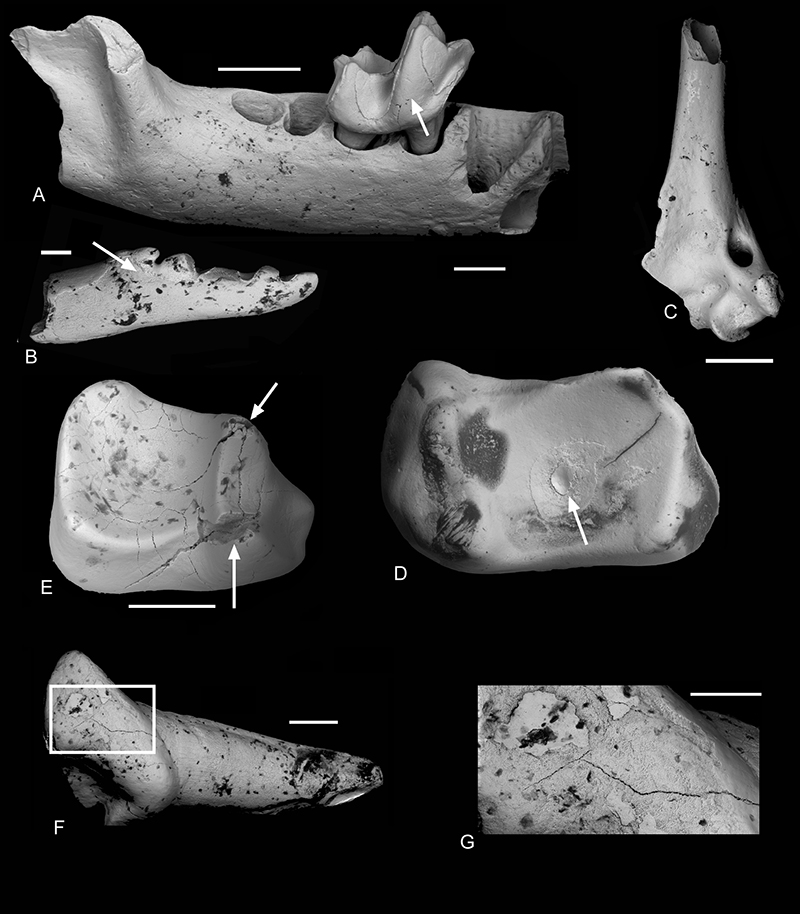
FIGURE 8. Percentages of teeth of the theridomyid Thalerimys fordi and the three other best represented families in each etching group (Vasileiadou et al., 2007a), numbered on X axes, from bed TB33, How Ledge Limestone, and bed O3, Osborne Member. The teeth of T. fordi and Gliridae are restricted to the cheek teeth. N = total number of etched teeth in each taxon for each bed.
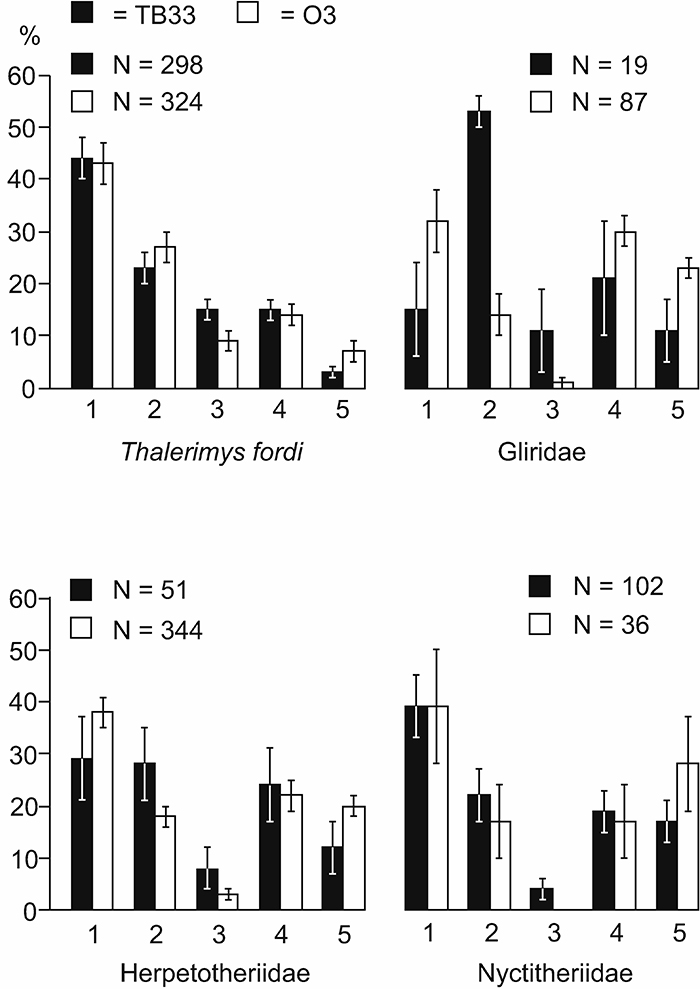
FIGURE 9. Scanning electron micrographs of teeth of the carnivoran Paramiacis sp. and puncture marks on theridomyid bones from bed TB33, How Ledge Limestone, SW Headon Hill. A, two puncture marks on distal right tibia (M67679) of Thalerimys fordi; B, enlarged detail of A, the large puncture mark (a) and small puncture mark (b) labelled; C, puncture mark on ?Thalerimys distal metapodial (M62154); D, right M1 (carnassial) (M67697) of Paramiacis sp., in occlusal view; E, left P3 (M67697) of Paramiacis sp.; F, puncture mark on ?Thalerimys proximal metapodial (M62171); G, enlarged detail of F; H, puncture mark on ? Thalerimys phalanx 2 (M62253); I, enlarged detail of H. Scale bars equal 1 mm for A-F, H and 0.2 mm for G and I.
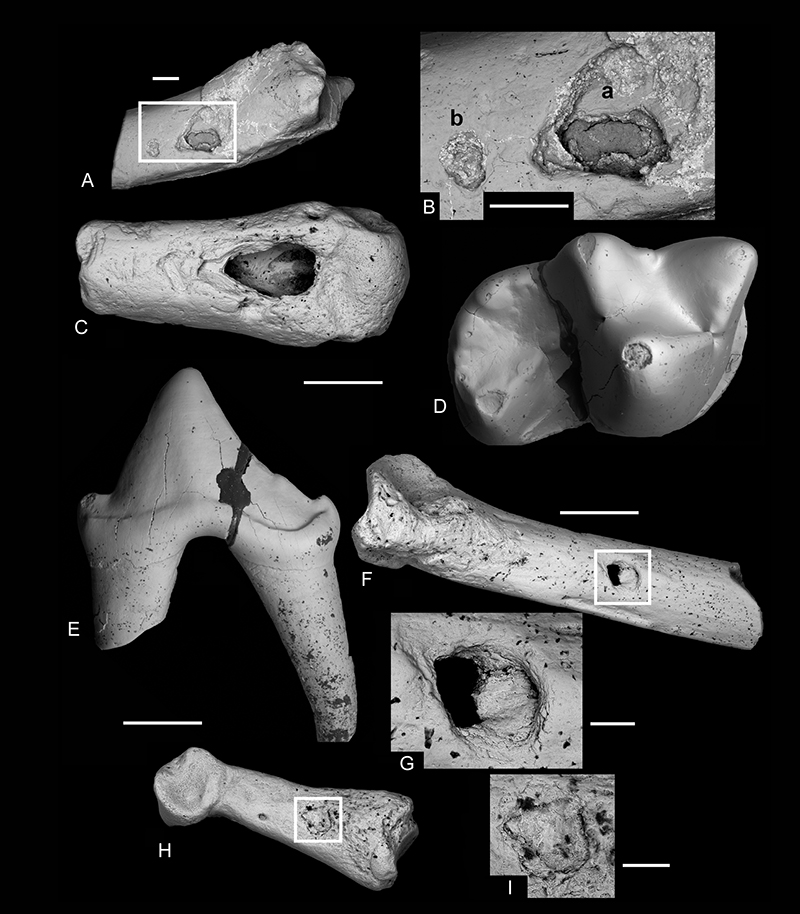
FIGURE 10. Dimensions of the long (L) and short (W) axes in millimetres of the seven oval puncture marks on fossil theridomyid bones from bed TB33, How Ledge Limestone, compared with the means with one standard deviation of those on fossil theridomyid bones from bed O3, Osborne Member (from Vasileiadou et al., 2009), of those made by jackals (Canis aureus) on modern ungulate bones (from Dominguez-Rodrigo and Piqueras, 2003) and of those made by leopards (Panthera pardus) on fossil bones of mammals of 4.5-104 kg weight (from Pickering et al., 2004). 1, M67679; 2, M62154.
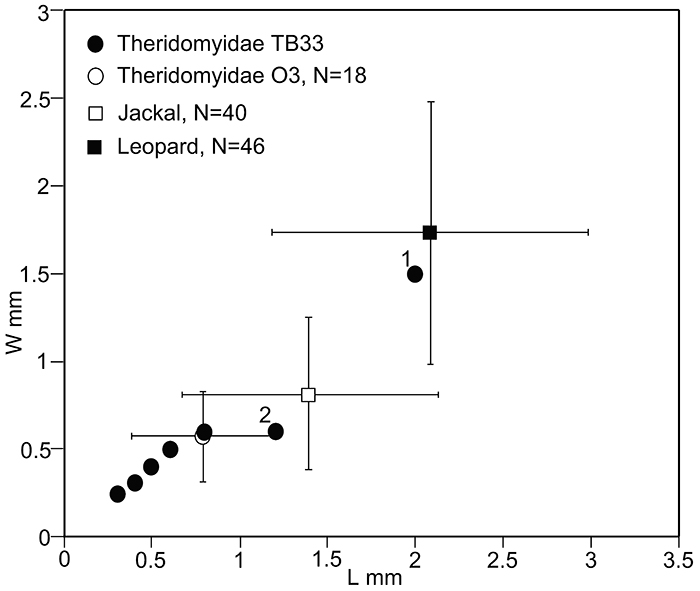
FIGURE 11. Scanning electron micrographs of teeth of the pantolestid Cryptopithecus major (A-B) and tooth and bones of the carnivoran Paramiacis sp. (C-F) from bed TB33, How Ledge Limestone, SW Headon Hill, showing damage. A, left DP 4 (M61688) in etching group 5, arrows indicating the only islets of enamel left on the crown; B, lower right premolar (M62331) in etching group 5, devoid of all enamel, the dentine core also penetrated by etching; C, left M2 (M67697) in etching group 2, broken with fracture edges rounded; D, phalanx 2 shaft (M67697), showing distal etching and rounded proximal fracture edge (arrowed); E-F, phalanx 1 (M67697) broken into a distal articulatory part (E) and the shaft and proximal articulation (F), with rounded fracture edges (arrowed), but closely fitting broken surfaces. Scale bars equal 0.5 mm for A-B, 0.3 mm for C-D and 1 mm for E-F.
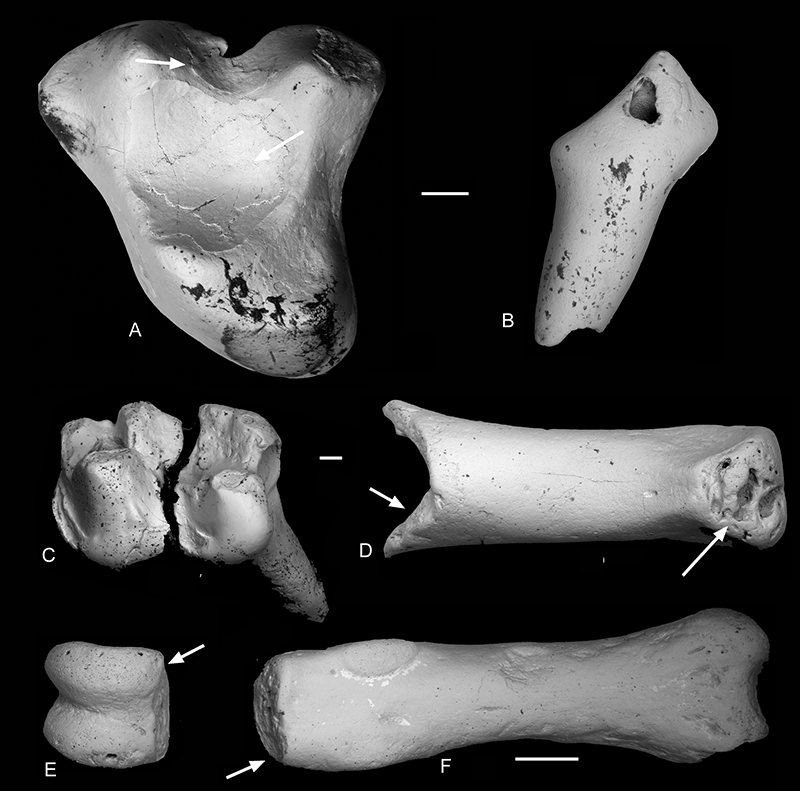
FIGURE 12. Scanning electron micrographs of associated near complete lower right dentition (M67678) of the omomyid Microchoerus erinaceus from bed TB33, How Ledge Limestone, SW Headon Hill, showing crowns with group 4 etching and post-voiding scavenging bite and gnaw marks. A, H, J, P4; B, G, P3; C, F, canine; D, E, I, I1; K, M3; L, M 2. Views are: buccal (A-D), mesial (E, I), lingual (F-H), and occlusal (J-L). C shows gnaw marks on the ventral edge of the root of the canine; I shows an enlarged ventral portion of the root of I1 (E shows the whole tooth), with a bite mark on the side and parallel gnaw marks on the medioventral edge. The horizontal crease on the buccal enamel wall of P3 (B) is a developmental pathology. Scale bar equals 0.5 mm for I, 1 mm for the rest.
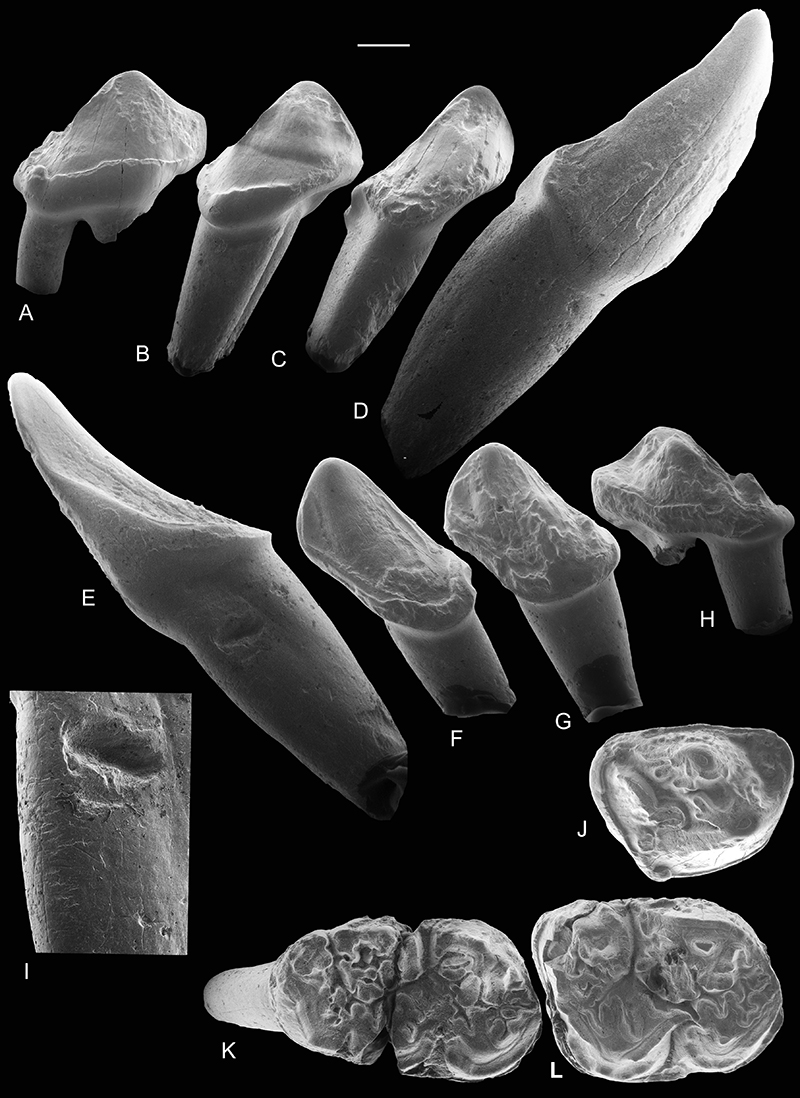
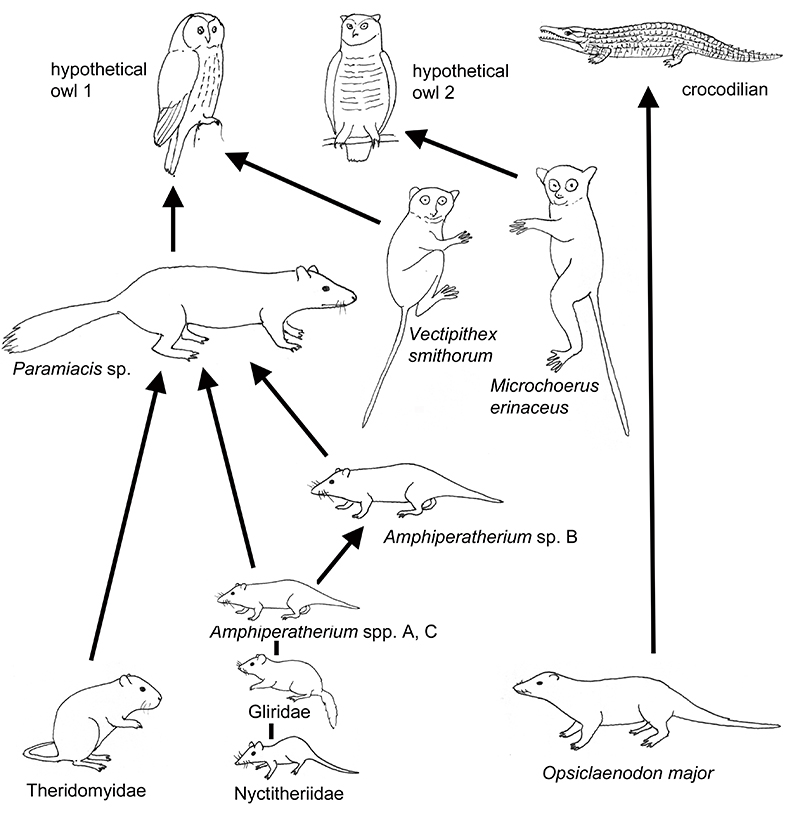
FIGURE 13. Trophic relationships between predators and prey derived from damage patterns of bones and teeth of the best represented micromammals in bed TB33, How Ledge Limestone, SW Headon Hill. The two hypothetical owls and the crocodilian are drawn at smaller scales than the rest.