FIGURE 1. Late Miocene through Late Pleistocene fossil localities of Castor across North America. Locality points obtained from NOW database of Fossil Mammals.
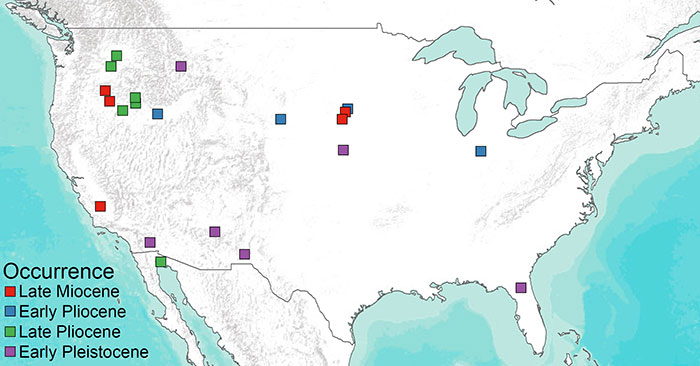
FIGURE 2. Landmark placement for craniums in dorsal (A), lateral (B), and ventral (C) views and dentaries (D) in lateral view on Castor canadensis MVZ 80744. Definitions of landmarks are outlined in Table 1 for the cranium and Table 2 for the dentary.
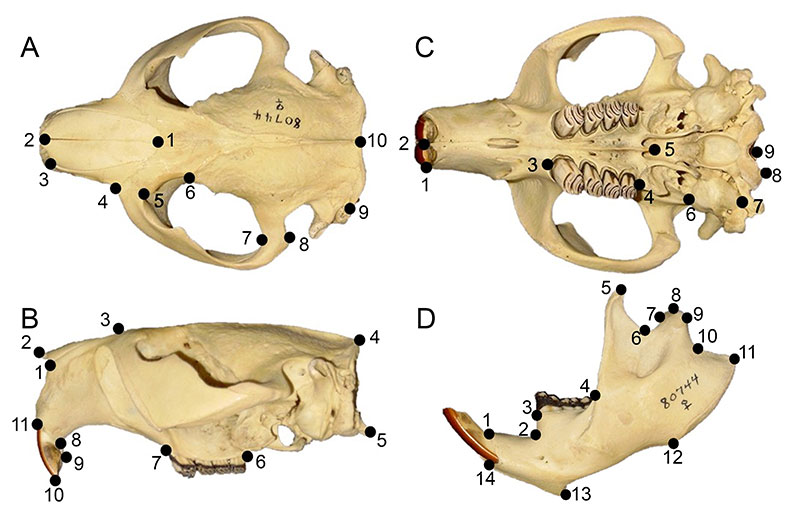
FIGURE 3. Relative warp plot for the dorsal view of the cranium. Axes depict shape variation, associated with landmark deformations, indicated by thin plate splines deformation grids.
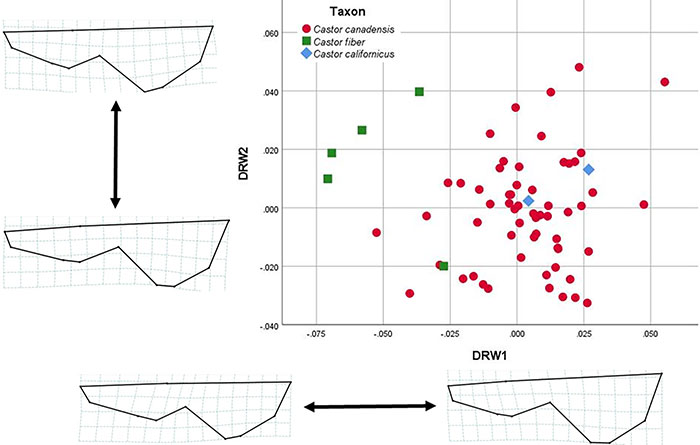
FIGURE 4. Relative warp plot for the lateral view of the cranium. Axes depict shape variation, associated with landmark deformations, indicated by thin plate splines deformation grids.
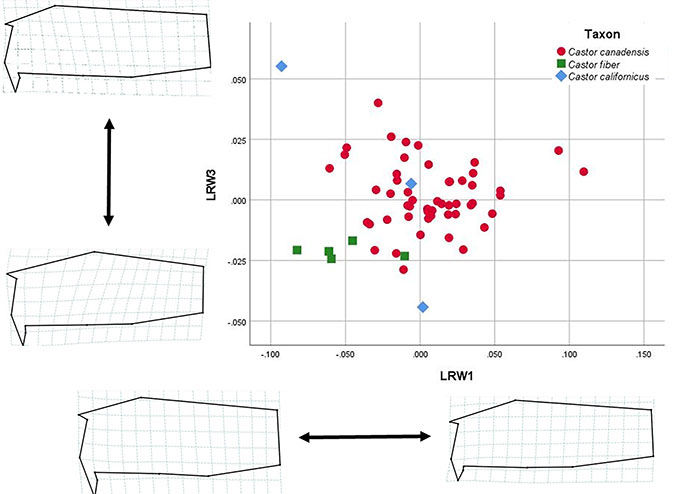
FIGURE 5. Relative warp plot for the dentary. Axes depict shape variation, associated with landmark deformations indicated by thin plate splines deformation grids.
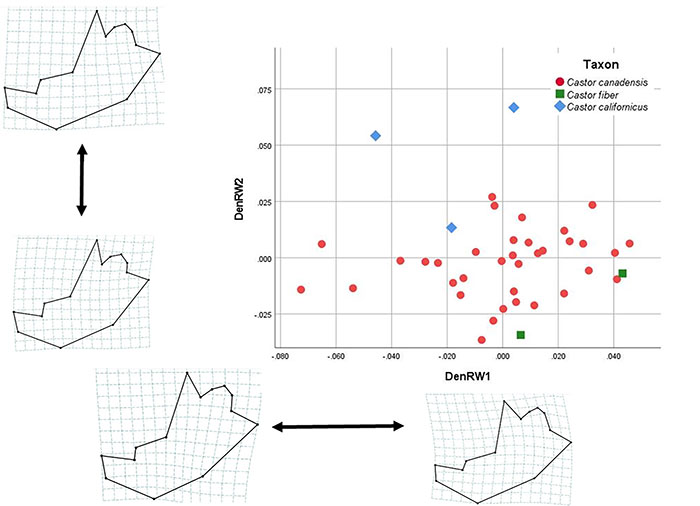
FIGURE 6. Histogram of canonical variate scores for analysis of cranial data with Castor californicus treated as an unknown. The x axis depicts shape variation, associated with landmark deformations, indicated by thin plate splines deformation grids. The y axis indicates the frequency of canonical variate scores among studied taxa.
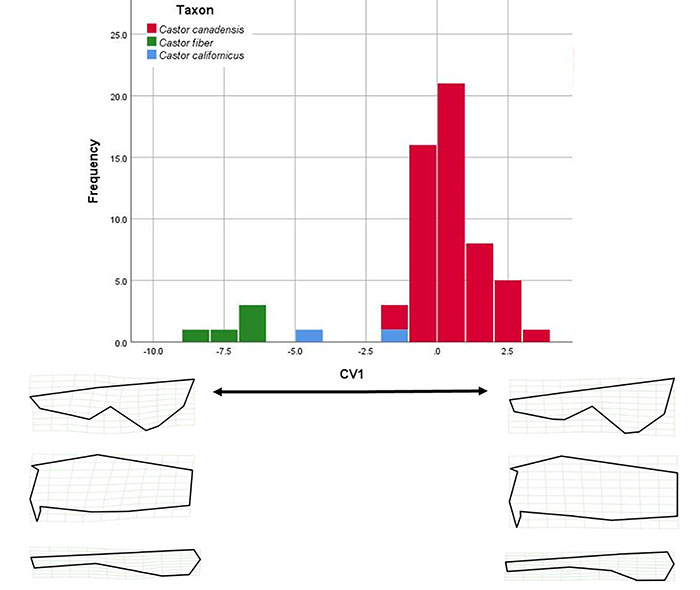
FIGURE 7. Canonical variate plot for analysis of cranial data with Castor californicus treated as a distinct taxon a priori. Axes depict shape variation, associated with landmark deformations, indicated by thin plate splines deformation grids.
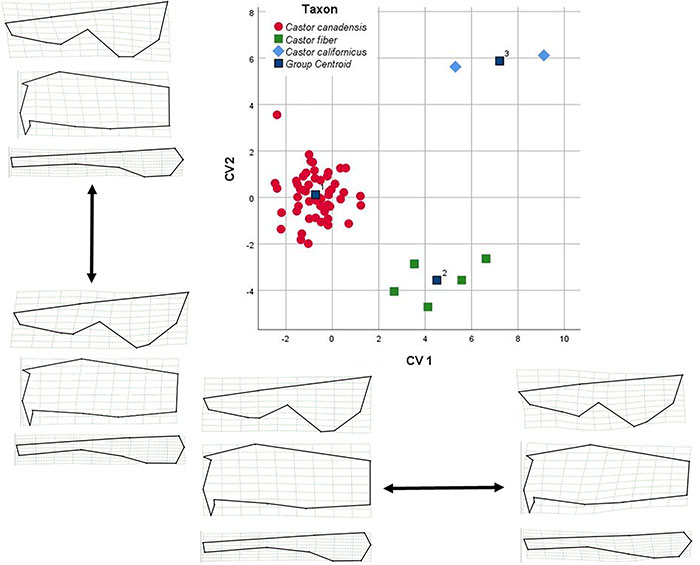
FIGURE 8. Histogram of canonical variate scores for analysis of dentary data with Castor californicus treated as an unknown. The x axis depicts shape variation, associated with landmark deformations, indicated by thin plate splines deformation grids. The y axis indicates the frequency of canonical variate scores among studied taxa.
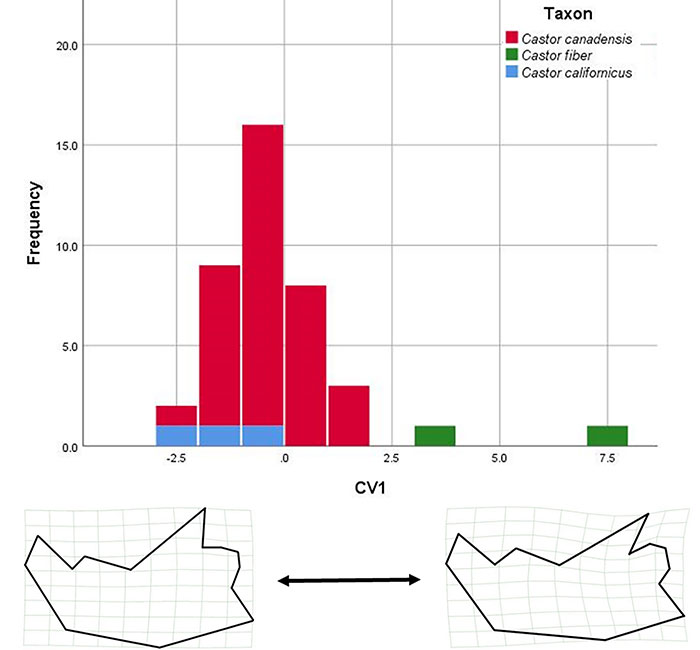
FIGURE 9. Canonical variate plot for analysis of dentary data with Castor californicus treated as a distinct taxon a priori. Axes depict shape variation, associated with landmark deformations, indicated by thin plate splines deformation grids.
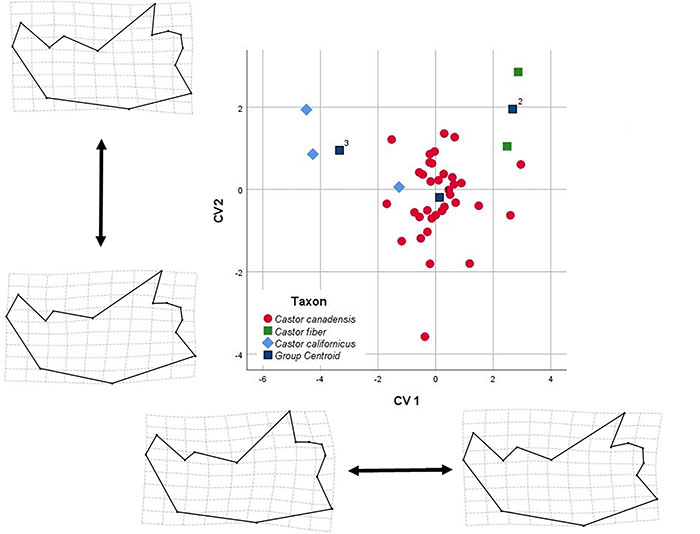
FIGURE 10. Dendrogram of cranial hierarchical cluster analysis. Specimens used in analysis are labeled by species and catalog number.
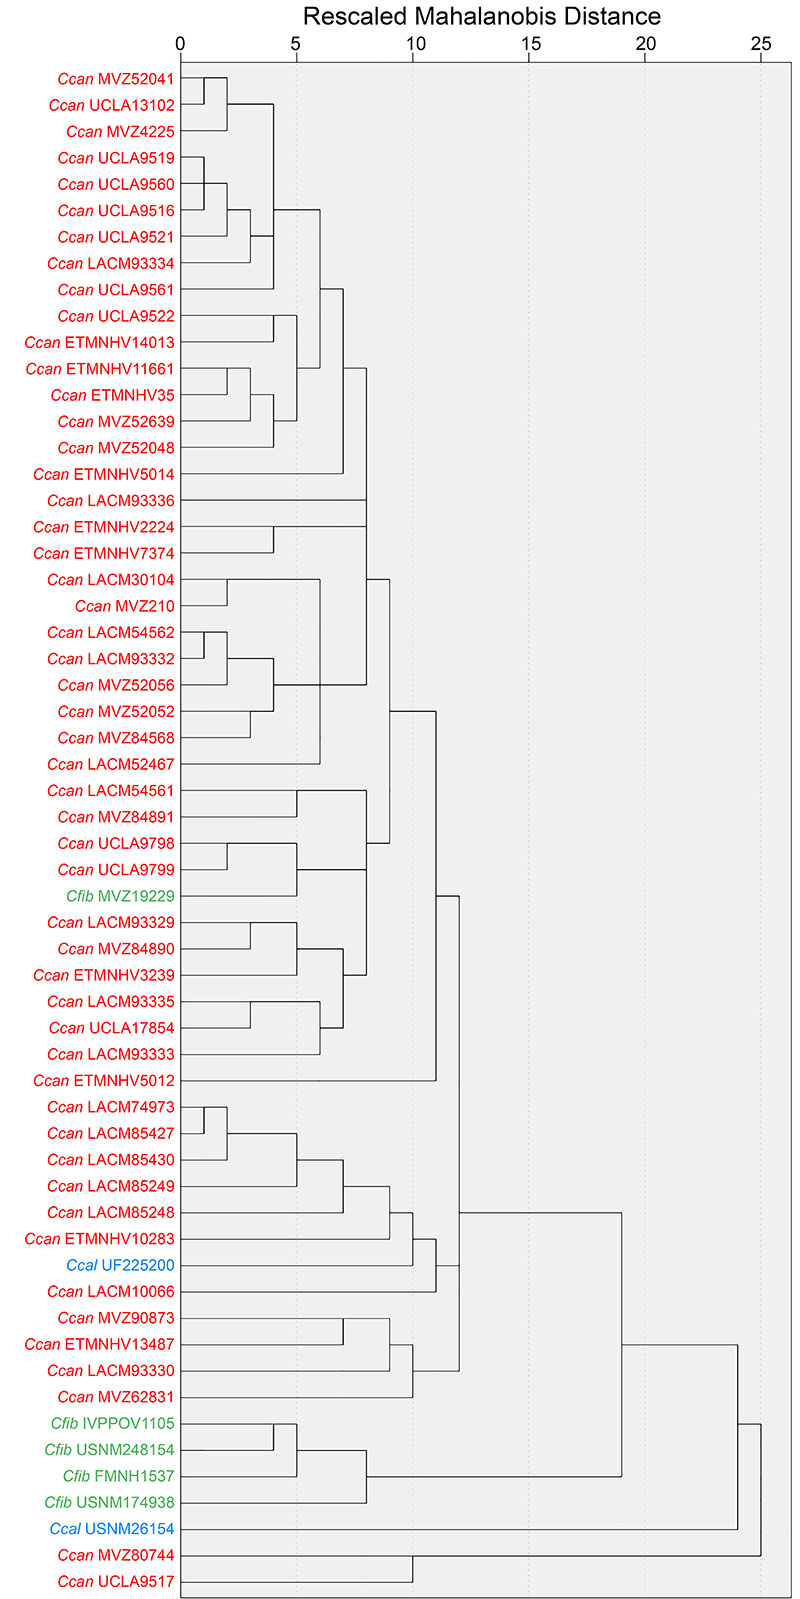
FIGURE 11. Dendrogram of dentary hierarchical cluster analysis. Specimens used in analysis are labeled by species and catalog number.
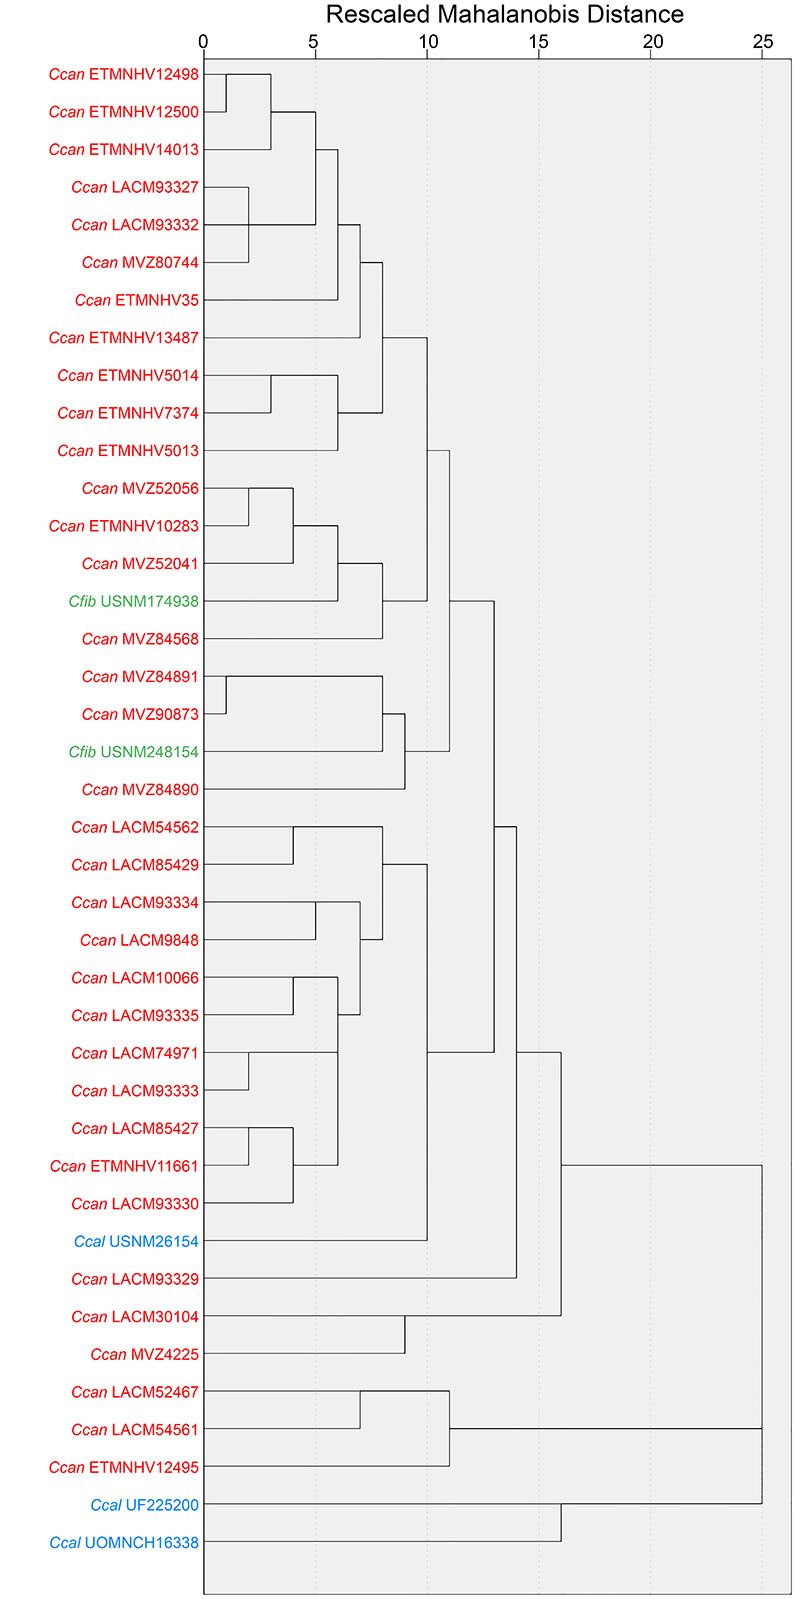
FIGURE 12. Boxplots for (A) anteroposterior diameter of femur (FeAPD) and (B) mediolateral diameter of tibia distal epiphysis (TDEMLD) of Castor canadensis and C. californicus, which exhibit differences in mean values and minimal overlap in range values. See Table 17 for descriptive statistics, coefficients of variation, and ANOVA results.
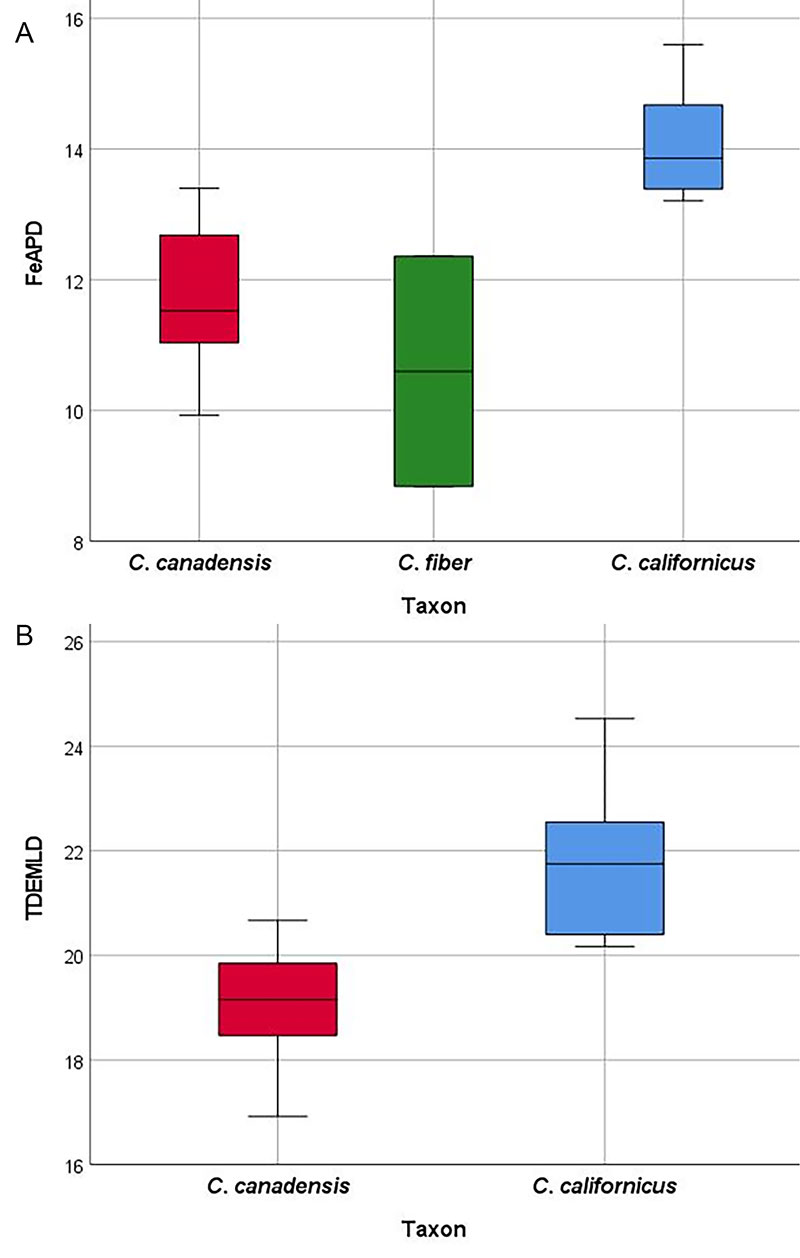
FIGURE 13. Boxplots for (A) articular width of humeral distal end (HDAW), (B) femoral epicondylar breadth (FeEB), (C) anteroposterior diameter of tibia distal epiphysis (TDEAPD), (D) anteroposterior diameter of third metatarsal (MT3APD), and (E) mediolateral diameter of fourth metatarsal (MT4MLD) of Castor canadensis and C. californicus, which exhibit differences in mean values and no overlap in range values. See Table 17 for descriptive statistics, coefficients of variation, and ANOVA results.
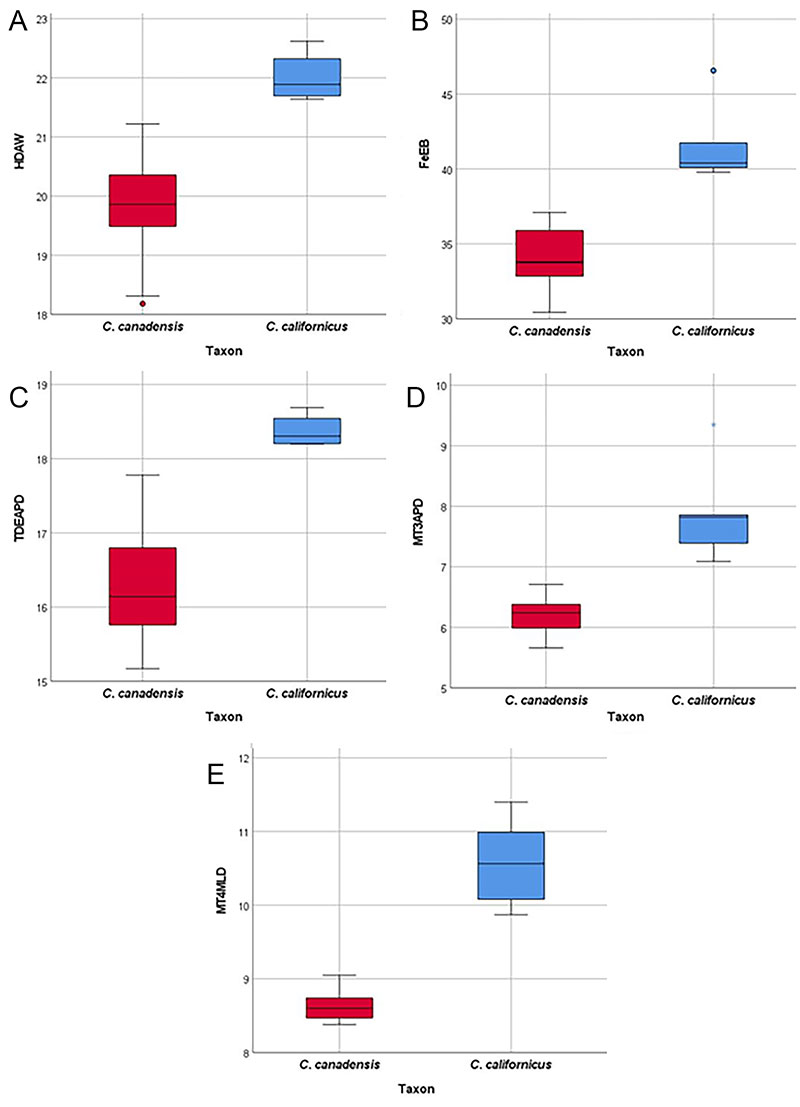
FIGURE 14. Variation line graph calculated by coefficients of variation with sample size correction for Castor canadensis and C. californicus postcranial measurements. Note that C. fiber is excluded due to limited sampling. Castor canadensis and C. californicus both contains high levels of variation in postcranial elements. See Table 17 for descriptive statistics, coefficients of variation, and ANOVA results.
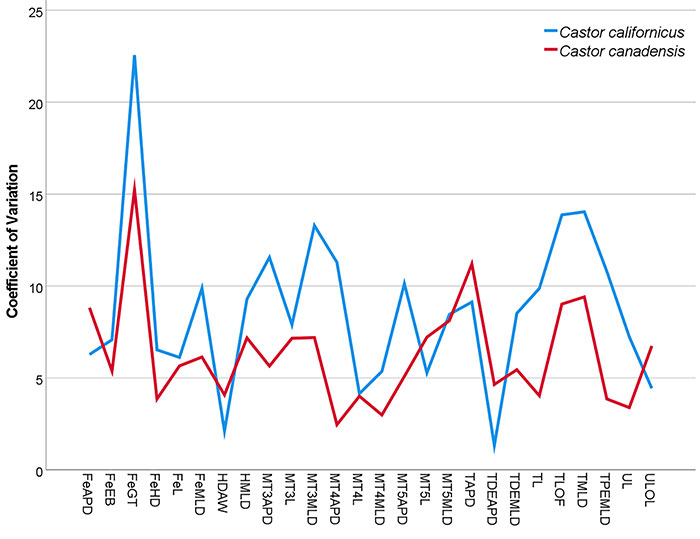
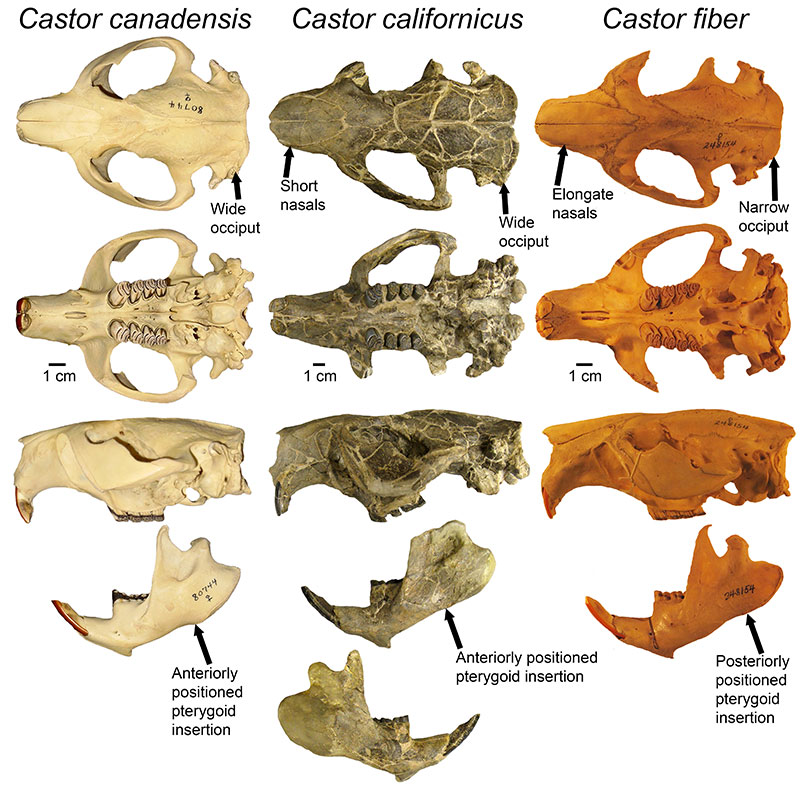
FIGURE 15. Comparison of the skull and dentary of extant Castor canadensis (MVZ 80744) and C. fiber (USNM 248154) to fossil C. californicus (USNM 26154). Note that the North American species C. canadensis and C. californicus share shorter nasals, wider occiput, and more posteriorly positioned orbits than Eurasian C. fiber; both also display more anterior placement of the anterior margin of the pterygoid insertion and greater spread of the posterior processes (coronoid, condylar, angular) than C. fiber.