FIGURE 1. The phylogenetic sampling of dinocephalian taxa considered in this study. Pictures of endocast within transparent life reconstructions are not to scale. Phylogeny after Fraser-King et al. (2019) and Neumann (2020).
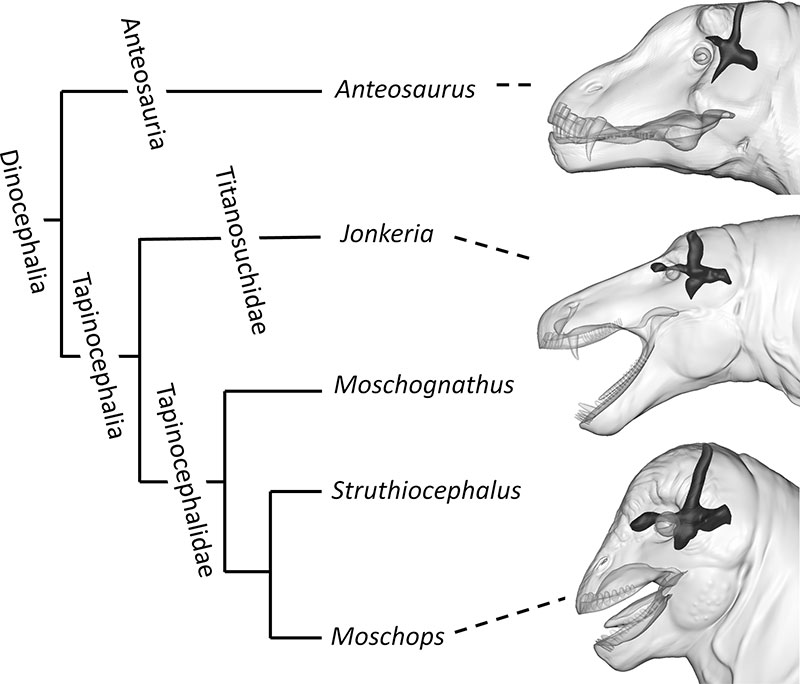
FIGURE 2. 3D digital life reconstructions of Anteosaurus (A), Jonkeria (B), and Moschops (C). Scale bar equals 50 cm.
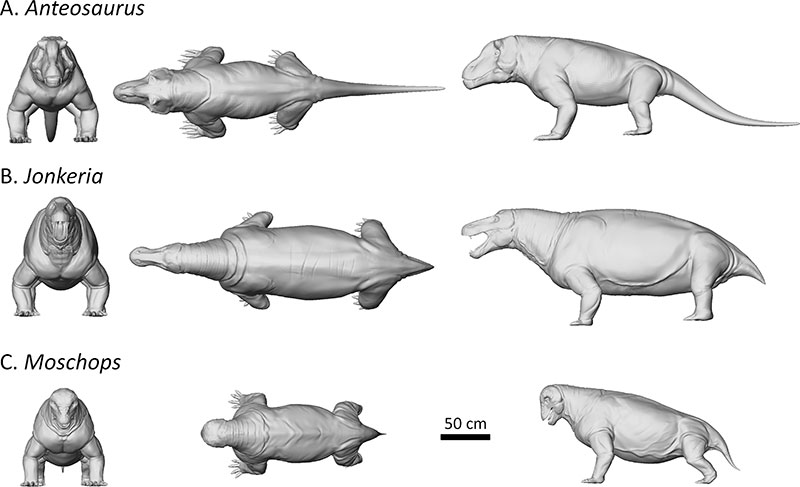
FIGURE 3. 3D digital reconstructions of the endocasts of Anteosaurus (A), Jonkeria (B), and Moschops (C). Scale bar equals 5 cm.
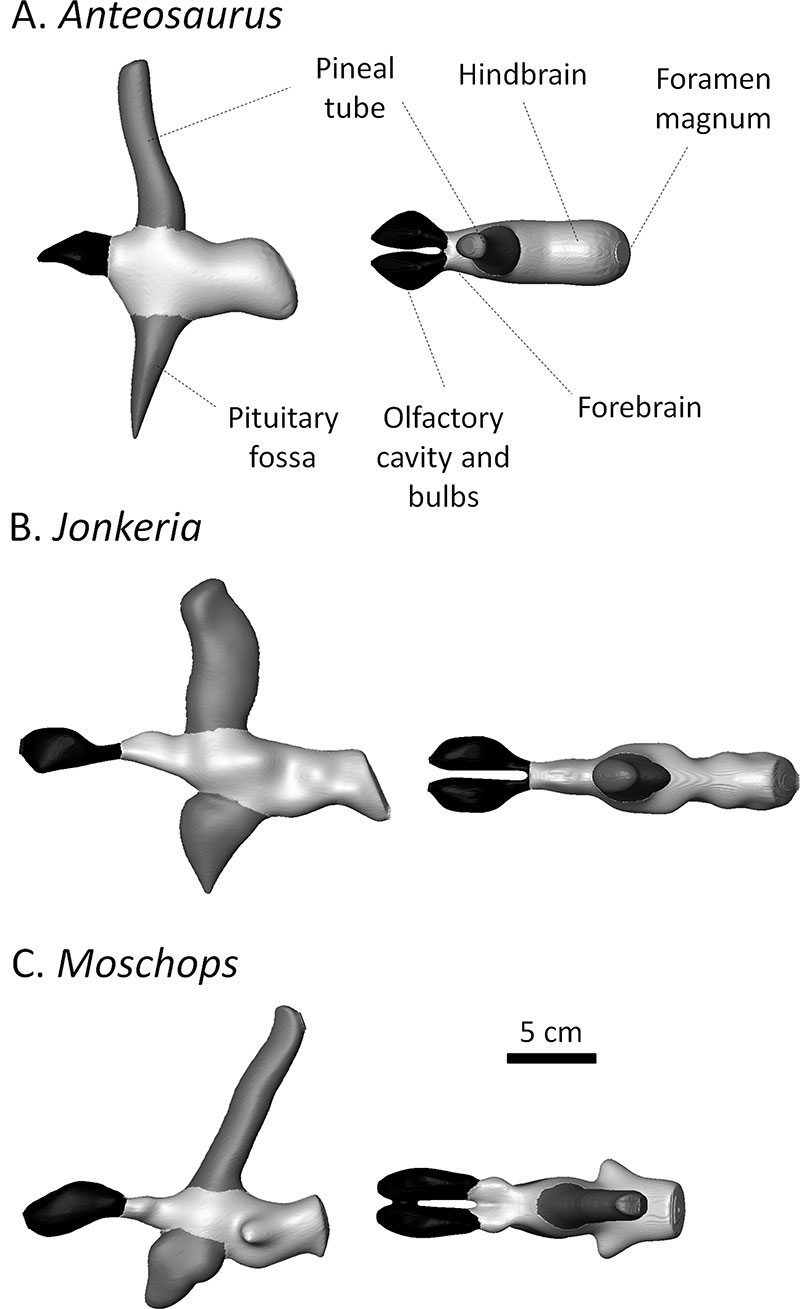
FIGURE 4. 3D digital reconstructions of the endocast of Moschognathus specimen AM4950 in lateral (top) and dorsal (bottom) views, comparing the endocast reconstructed by Benoit et al. (2017a) (A) to the 3D sculpted reconstruction made here for validation (B). Scale bar equals 5 cm.
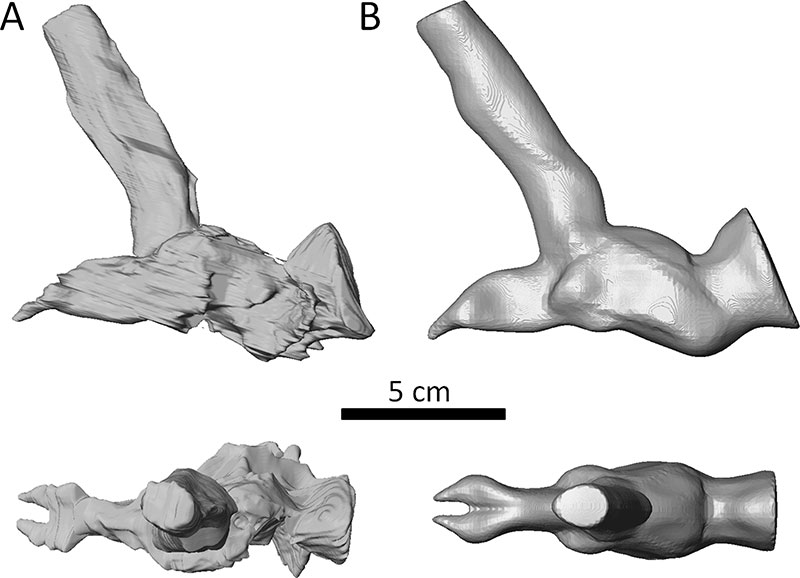
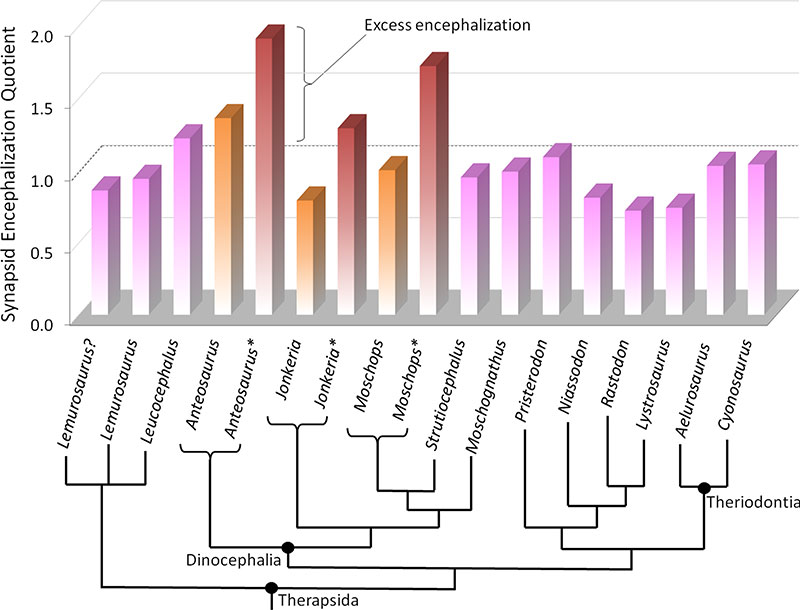
FIGURE 5. The synapsid Encephalization Quotient in non-theriodont therapsids. Data from Benoit et al. (2023a) and Table 1. Phylogeny after Fraser-King et al. (2019), Neumann (2020), and de Simão-Oliveira (2020). For Anteosaurus, Jonkeria, and Moschops, measurements including (marked with an *) and excluding the pineal canal and pituitary fossa are provided.