

 Using X-ray computed tomography analysis tools to compare the skeletal element morphology of fossil and modern frog (Anura) species
Article number: 19.1.1T
https://doi.org/10.26879/557
Copyright Palaeontological Association, February 2016
Author biographies
Plain-language and multi-lingual abstracts
PDF version
Submission: 9 April 2015. Acceptance: 6 December 2015
{flike id=1382}
ABSTRACT
Computed tomography (CT) analysis software has predominantly been developed for medical and industrial use. Thus far there have not been detailed reports in the palaeontological literature of CT analysis tools utilizing automatic analysis functions for visual 3D comparisons between different taxa/species in order to assess and quantify differences. This paper presents the methodology for the general morphological comparison and analysis of fossil and modern bones-in this case frog femora are show-cased. Industrial X-ray computed tomography analysis functions are applied to the analysis, and specifically, the comparison, of bone morphologies and micro-anatomical differences (e.g., cortical wall thickness) of differentially sized frog taxa. In contrast to traditional landmark analysis, this method makes use of the higher detail of the full surface data in the form of a CAD (Computer-aided drafting) data set output from the microCT scan. The application of these industrial analysis functions is shown to be useful for viewing of qualitative, as well as quantitative, differences. Differences are highlighted using 3D nominal/actual comparisons, and wall thickness is compared using the wall thickness analysis function applied to both samples side by side. Single bones as well as complete frog specimens were scanned and, in the case of the latter, femora were virtually extracted (segmented) for the purposes of comparison with other specimens. These techniques may be used for the effective identification and quantification of morphological differences between fossil and extant taxa.
Thalassa Matthews. Iziko South African Museum, 25 Queen Victoria Street, Cape Town 8000, South Africa
and DST-NRF Centre of Excellence in Palaeosciences, Evolutionary Studies Institute, University of the Witwatersrand, Private Bag 3, Wits, 2050, South Africa. tmatthews.matthews@gmail.com
Anton du Plessis. CT Scanner Facility, Central Analytical Facilities, Paul Sauer Building, Bosman Street, University of Stellenbosch, Stellenbosch, 7602, South Africa/Physics Department, University of Stellenbosch, Stellenbosch, 7602, South Africa. anton2@sun.ac.za
Keywords: X-ray tomography; bone morphology; anatomy; CT scan; Anura; frog
Final citation: Matthews, Thalassa and du Plessis, Anton. 2016. Using X-ray computed tomography analysis tools to compare the skeletal element morphology of fossil and modern frog (Anura) species. Palaeontologia Electronica 19.1.1T: 1-46. https://doi.org/10.26879/557
palaeo-electronica.org/content/2016/1382-fossil-ct-scan-data-analyses
INTRODUCTION
Comparisons are made between fossil and extant taxa in order to elucidate ontogeny, phylogeny and evolution, and numerous techniques are used to assess and describe the morphology and shape of the teeth and bones of fossil taxa. Fourier analysis, which uses an outline analysis based on Fourier transform has been used to investigate variability in size and shape of fossil murid molars (Renaud, 1999; Renaud et al., 1999). Geometric morphometrics is frequently used to quantify and compare morphological characteristics of the crania and postcrania of fossil and extant taxa (Zelditch et al., 2012). This technique takes into account both shape and size and two dimensional (2D) or three dimensional (3D) images may be analysed using landmarks, or sliding landmarks (Matthews and Stynder, 2011a, b; Edwards et al., 2013; Dollion et al., 2015). Landmarks may be positioned on 2D photographs, 3D CT scans, or directly on the fossil itself.
The non-destructive nature of CT scanning greatly impacts and boosts the research potential of specimens in museum collections in terms of global scientific collaboration and public communication. Micro-CT and other 3D imaging techniques are increasingly utilized to facilitate data sharing among scientists and have contributed widely to education and outreach projects. The increasing use of 3D printing is another recent development, which is enhancing the areas of research and education in the Earth Sciences.
Though initially CT scans were used mainly for industrial, engineering, and medical purposes (McColl et al., 2006; Kuwazuru et al., 2008; Nicoletto et al., 2010, 2012; Wan et al., 2014) X-ray micro computed tomography from micro-CT scanners and X-ray synchrotron imaging has become increasingly popular as a diagnostic and analytical tool for palaeontologists, archaeologists, and other Natural Science disciplines as it is entirely non-destructive and provides detailed 3D images of the structure of whole animals or plants, the remains of fossils buried in amber, rock, or hard substrate, and the interior of fossil bones and teeth (Tafforeau et al., 2006; Kearney et al., 2005; Lak et al., 2008; Sutton, 2008; Jasinoski et al., 2010; Jasinoski and Chinsamy, 2012; Huttenlocker et al., 2013; Holloway et al., 2014; Dollion et al., 2015; Wichura et al., 2015).
In addition, CT scanners and techniques have become more efficient over time and have provided an increasingly high degree of resolution of materials being scanned (Sanchez et al., 2012). This has led to CT scanning becoming an increasingly well-known materials characterization and measurement tool, especially useful for quantitative 3D measurements (Maire and Withers, 2014). The detailed 3D histological information obtained from bones and teeth enables the investigation and analysis of features such as structure, growth rings, and density (Spoor et al., 1993: Jones et al., 2007; Ronan et al., 2010).
Industrial CT analysis software tools and their functions are designed mainly for the comparison of mechanical components to their design CAD data, for visualizing wall thicknesses in parts, and for comparing scanned parts with one another. An example is a recent case study of a titanium cast of a part for the aerospace industry, where defect analysis, wall thickness analysis, and a nominal/actual comparison was carried out (du Plessis and Rossouw, 2015). CT analysis software has predominantly been developed for medical and industrial use and thus far there have not been detailed reports in the palaeontological literature of CT analysis tools utilizing automatic analysis functions for visual 3D comparisons between different taxa/species in order to assess and quantify micro-anatomical differences, although other methodologies have been described in the literature. For example, Abel et al. (2012) and Ni et al. (2012) describe how to convert a 3D CT volume (a stack of digital slices) into a virtual image of a scanned fossil, and how to render/segment out the bones from the matrix and the skeleton. Spoor et al. (1993) describe how to take linear measurements of fossil tooth enamel and cortical bone thickness. Sanchez et al. (2010) used the rendering facilities of VGStudio MAX to determine differential degrees of hard-tissue mineralisation in a 300 million-year-old tetrapod fossil, and also to quantify the volume and orientation of bone cell lacunae in extant and fossil vertebrate bones (Sanchez et al., 2013).
This paper outlines a simple method for making a morphological comparison of bones of different sizes, and representing different taxa, with one another in 3D, both in terms of the external morphology of bones, and relative wall thickness. This project involved the comparison of fossil and modern frog femora (upper leg bones). The fossil frog femora concerned belong to an aquatic frog, Xenopus sp., and come from the early Pliocene fossil site of Langebaanweg, which is situated on the west coast of South Africa (at 32° 57′ 23.8″ S, 18° 06′ 58.2″ E), and is approximately 5.1 million years old. Further details of the frog community from Langebaanweg, including Xenopus sp., are available in Matthews et al. (2015) and are not relevant to this paper. The issue under investigation was whether the fossil femora resembled either of the two extant, sympatric Xenopus species living in the Western Cape today, namely Xenopus laevis (which is endemic to southern Africa) and Xenopus gilli (endemic to the south-western Cape) (Evans et al., 1998). Comparisons were also made between modern Xenopus laevis (African clawed frog) of different sizes and sexes, between Xenopus laevis and Xenopus gilli (Cape Platanna), and between the latter two species and the fossil taxa.
MATERIALS
Both microCT and nanoCT scanners were used in this study: the General Electric Phoenix V|Tome|X L240, and the Nanotom S, both housed at the Stellenbosch CT Scanner Facility at Stellenbosch University, Cape Town, South Africa. X-ray scan settings were 60 kV, 240 µA, with 2200 images acquired in one full rotation of the sample for full frog specimens, while nanoCT scan settings used fast scan settings for high throughput, at approximately 20 minutes per sample. CT scan analysis was carried out using Volume Graphics VGStudio Max 2.2.6.
In the case of the fossil bones, scans were made of individual frog femora using the nanoCT scanner. The femora of extant species were scanned as individual dislocated bones, and also as an articulated part of a specimen in the case of the complete frog corpses. All the complete frog specimens came from the Iziko South African Museum and were stored in a solution of 70% ethanol. These were dealt with as described in the following section for the purposes of scanning. The fossil frog bones mentioned in this paper are also currently housed in the Iziko South African Museum, Cape Town, and each bone reported on has been allocated an identifying acquisition number.
METHODOLOGY
Scanning
Modern, whole frog specimens (i.e., an articulated skeleton and associated soft tissues) were removed from the alcohol in which they were stored and were then thickly wrapped in porous muslin cloth, placed on a plastic petri dish (note that the dish must be large enough for the wrapped specimen to be stable and well-supported during scanning), and thoroughly soaked in alcohol. The petri dish was then fixed on the top of a mount for microCT scanning. The alcohol-wet wrappings were necessary to prevent sample movement of the specimen during scanning as a result of drying out. This was also facilitated by using short (approximately 20 minute) scan times. NanoCT scans of individual modern and fossil frog bones were done using fast scans to allow high throughput of samples.
Segmenting
Frog femora had to be segmented out from the body scans for the purposes of analysis. The segmenting tools of VGStudio Max 2.2.6 enable the user to select out areas of interest from the scan and to define a so-called ‘region of interest’ (ROI). A ROI is a 3D mask which defines a region of interest within a CT dataset. The rendering properties of a ROI can be set independently of the main dataset by adding ‘volume rendering settings’ to the dataset, and a CT dataset may have a number of segmented ROIs, which are associated with their own individual analyses and render settings.
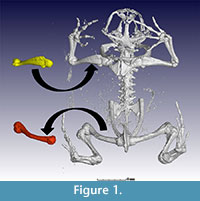 Supplementary Information, Part 1, illustrates the toolbars of Volume Graphics VGStudio Max 2.2.6. CT data segmentation was performed using VGStudio Max’s region growing tool and continuously adding sections to the ROI until the entire bone was virtually isolated (see Supplementary Information, Part 2.1-6 and 3.1-4). Abel et al. (2012) and Ni et al. (2012) provide further information on this procedure. After segmentation, a bone can be highlighted in 3D and extracted (Supplementary Information, Part 3.4). Figure 1 shows the results of a body scan of a complete Breviceps montanus (Mountain rain frog) and demonstrates segmentation of the humerus (coloured yellow) and femur (coloured red) from the original scan.
Wall Thickness Comparison
A wall thickness analysis may be done on a specific region of a CT dataset, that is, a ROI. The wall thickness analysis function available in VGStudio MAX 2.2.6 requires an initial surface determination of the material of interest, in this case, the bone. The surface determination function finds the best threshold value between bone and surrounding material, to provide sub-voxel accuracy for this surface data (Supplementary Information, Part 4.1-4). The surface data of both internal and external walls is then used in the wall thickness analysis function, which can be applied with search tolerances to find the minimum distance between the surfaces, within a given search angle (Supplementary Information, Part 5.1). Once an analysis is completed, each point on the surface has an associated wall thickness value, which can be represented by a colour-coded view in 3D (Supplementary Information, Part 5.2-3). This gives an overview and provides visual information, which makes it easier to identify small differences between samples. The wall thickness analysis also provides a thickness distribution histogram (Supplementary Information, Part 5.2). A requirement for applying a surface determination is that bones-only material is incorporated, which was possible in all cases reported here. Note that this may be problematic in the case of fossil bones, which have been in-filled with material of similar density to the surrounding bone. Measurements may also be made using the distance measurement tools (virtual calipers) in 2D slice views (Supplementary Information, Part 6.1-3).
Morphological Comparison
After scanning the single bones, and rendering out femora from the scans of the complete skeletons, comparisons between the various taxa were carried out. The aim of this work was the morphological comparison of two femora in 3D, and for this purpose the simplest methodology was to select a reference or so-called ‘nominal’ bone, to which various other ‘actual’ bones could be compared. The first step after selecting and opening a reference or ‘nominal’ bone was importing the second data set — this almost always involved importing a bone which was of a different size to the nominal bone. For the purposes of comparative morphological assessment, the second bone size was adjusted to match that of the first through a trial and error process based on approximate bone length. When importing the data set, the voxel size can be artificially adjusted. If the imported bone is too large, it is imported again with a smaller voxel size or, vice versa, if it is too small. This trial and error process is followed until the bones are of approximately similar dimensions. They are then manually aligned and orientated by overlapping and rotating them by 360° until they are proximally and distally aligned and any significant features are roughly superimposed one on top of the other. If the nominal and actual bones were not from the same side (e.g., left side versus right side), the import process could be adjusted to compensate for this by selecting the ‘mirror axis’ option for the Z-axis (Supplementary Information, Part 7.1-4). After the data import and manual alignment, both data sets require a surface determination (Supplementary Information, Part 8.1-5). The basic surface determination includes both internal and external surfaces of the bone, which allows bone thickness to be measured using the wall thickness analysis function. The surface determination ‘advanced’ function should be selected and manual inspection used to verify the correct choice of surface in slice views (Supplementary Information, Part 8.1-5). In other words, you have to check that you have the correct threshold, and that the correct surface is being selected (be careful of ‘noise’ and extraneous particles being selected).
Only outer surfaces of bones should be considered when comparing exterior comparative morphology and, for the nominal/actual comparison, internal surfaces need to be removed to prevent outer surfaces erroneously being compared to internal surfaces. This is likely to occur when a portion of a bone is considerably larger than that to which it is being compared. For example, in the case of the frog femora, proximal or distal epiphyses tended to be relatively more expanded/contracted relative to one another, resulting in a gap between the two bones in this area. In the case of hollow bones (such as the frog femora which had a medullary cavity running the length of the bone) manual infilling of the bone is necessary to ensure that only external surfaces are used in the comparative calculations. The manual infilling procedure is a tedious process but can be overcome under certain conditions by using the ‘Advanced surface determination’ function while using a lower threshold as starting contour and selecting the ’Remove particles and all voids’ function (Supplementary Information, Part 8.1-5). The resulting surface excludes all interior void regions and should be checked and verified manually. A surface determination can also be further improved by selecting a ROI using the surface as a starting contour in a new surface determination. In this way no internal surfaces are included but the exterior surfaces are improved using the advanced optimization function (Supplementary Information, Part 8.5). If this procedure fails due to very thin bone thickness and large void areas, it can be done manually by using the drawing tool and adding the interior void regions to the region of interest.
Once a surface determination has been done and a manual alignment is completed, a ’Best-fit’ registration is employed to best align the two samples with one another automatically (Supplementary Information, Part 9.1-3). This process is then followed by a nominal/actual comparison analysis, which can take up to 30 minutes to process (Supplementary Information, Part 10.1-4).
RESULTS AND DISCUSSION
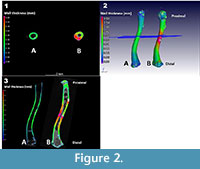 The results of a cortex bone thickness analysis on a male Xenopus laevis (CP001) and a fossil Xenopus specimen (ZM 71336) are depicted side by side in Figure 2. Included are the 3D and slice views showing a colour coded analysis. The graded colour scale on the left depicts bone thickness areas of ~0.1 mm as blue, ~0.3 mm as green, and ~0.6 mm as red/pink, and is applicable to both bones.
As indicated by the colour variation, these two bones clearly have a significant difference in mid-shaft thickness. Note that as the bones being compared have been normalized in terms of nominal bone length (size), the thickness differential is a relative one. Another feature absent in the nominal bone (A) is the fact that the fossil bone (B) is thicker on one side than the other. The bottom figure shows variation in bone cortex thickness along the length of the two femora.
The epiphyses of specimens were ignored in the analyses as these were generally missing, or incomplete due to their cartilaginous nature, and preservation of these areas was variable between specimens. Differences in these areas are therefore not significant and should be ignored in the following figures.
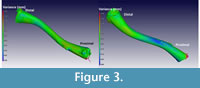 The results of a nominal/actual comparison of a male (CP001) and female (CP003) X enopus laevis (the male being the ‘nominal’ bone and the female the ‘actual’ bone) is depicted in Figure 3. The 3D views, as seen from two sides, are illustrated and show a colour-coded variance analysis. Maximum variance is set at 0.3 and -0.3 mm, respectively. Much of the bone is coloured green, indicating zero variance, and no significant morphological differences are indicated. The blue-shaded areas indicate that the female Xenopus is slightly smaller in these areas than the male.
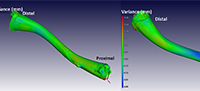
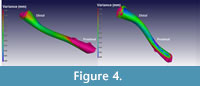 Figure 4 illustrates a comparison between a male Xenopus laevis (the ‘nominal’ bone [CP001]) and the fossil Xenopus sp. (the ‘actual’ bone [ZM 71336]) by superimposing the ‘actual’ over the ‘nominal’ bone. The scale depicts areas of no difference as green, while blue regions have a negative variance of up to -0.3 mm, depicting areas where the actual bone (the fossil) is within/underneath the nominal bone (i.e., it is smaller). The positive red variance of up to 0.3 mm indicates regions where the fossil projects above the nominal bone (i.e., it is larger). Images from both sides show relatively large deviations on the proximal and distal parts of the bone, most markedly on the proximal portion of the femur, indicating morphological differences in these areas.
CONCLUSION
This analysis shows how the comparative morphology and anatomy of bones of fossil and extant animals can be investigated using microCT advanced visualization functions. In particular, bone-cortex thickness analyses, and nominal/actual comparisons, are shown to be very powerful, and may be used to indicate areas and features, which are morphologically different between different taxa/specimens. An advantage of this approach is that very subtle shape and/or size differences may be ascertained, which may not be picked up in a geometric morphometric analysis. This technique can be used in conjunction with geometric morphometrics as well as it can be usefully employed to identify areas of morphological variation, which can then be further quantified using geometric morphometrics. Importantly, it also enables one to morphologically contrast fossil and extant species, which were originally of different sizes (and sides). This technique leads to the effective identification and quantification of differences between fossil and extant taxa and thus contributes to elucidating their relationship with one another, as well as the evolution of fossil lineages.
It is suggested that the 3D surface CAD data, which contains all relevant information for such comparisons, may be used for the long-term digital archiving and sharing of such data for further research. This would be a much more efficient way of storing and sharing data as opposed to using complete 3D microCT data sets because the volume data set sizes can range from 2-30 Gb per scan, while surface data are about 50-500 Mb per scan. In addition, the spreadsheet data generated by analyses such as wall-thickness or nominal-actual comparisons, can be stored in small data files, which can be more easily be used, or shared, in further microstructural research and investigations.
ACKNOWLEDGEMENTS
The support of the Centre of Excellence in Palaeosciences (CoE in Palaeosciences) towards this research is hereby acknowledged. The National Research Foundation (NRF) of South Africa funded the sorting of fossil material and also supported this research under the auspices of the Professional Development Program. Image processing support from Volume Graphics GmbH is acknowledged. Thank you to the two reviewers who provided constructive comments.
REFERENCES
Abel, R.L., Laurini, R.C., and Richter, M. 2012. A palaeobiologist’s guide to ‘virtual’ micro-CT preparation. Palaeontologia Electronica, 15.2.6T:17pp, 3.7MB; palaeo-electronica.org/content/issue-2-2012-technical-articles/233-micro-ct-workflow
Dollion, A.Y., Cornette, R., Tolley, K.A., Boistel, R., Euriat, A., Boller, E., Fernandez, V., Stynder, D., Herrel, A. 2015. Morphometric analysis of chameleon fossil fragments from the Early Pliocene of South Africa: a new piece of the chamaeleonid history. The Science of Nature, 1 02:1-14.
du Plessis, A. and Rossouw, P. 2015. X-ray computed tomography of a titanium aerospace investment casting. Case Studies in Nondestructive Testing and Evaluation, 3:21-26.
Edwards, S., Tolley, K.A., Vanhooydonck, B., Measey, G.J., and Herrel, A. 2013. Is dietary niche breadth linked to morphology and performance in Sandveld lizards Nucras (Sauria: Lacertidae)? Biological Journal of the Linnean Society, 10:674-688.
Evans, B.J., Morales, J.C., Picker, M.D., Kelley, D.B., and Melnick, D.J. 1998. Absence of extensive introgression between Xenopus gilli and Xenopus laevis laevis (Anura: Pipidae) in south-western Cape Province, South Africa. Copeia , 2:504-509.
Holloway, R.L., Broadfield, D.C., and Carlson, K.J. 2014. New high-resolution computed tomography data of the Taung partial cranium and endocast and their bearing on metopism and hominin brain evolution. Proceedings of the National Academy of Sciences of the United States of America, 11(36):13022-13027.
Huttenlocker, A.K., Pardo, J.D., Small, B.J., and Anderson, J.S. 2013. Cranial morphology of recumbirostrans from the Permian of Kansas and Nebraska, and early morphological evolution inferred by micro-computed tomography. Journal of Vertebrate Paleontology, 33:540-552.
Jasinoski, S.C. and Chinsamy, A. 2012. Mandibular histology and growth of the nonmammaliaform cynodont Tritylodon. Journal of Anatomy, 220(6):564-579.
Jasinoski, S.C., Rayfield, E.J., and Chinsamy, A. 2010. Functional implications of Dicynodont cranial suture morphology. Journal of Morphology, 271:705-728.
Jones, A.C., Arns, C.H., Sheppard, A.P., Hutmacher, D.W., Milthorpe, B.K., and Knackstedt, M.I. 2007. Assessment of bone in growth into porous biomaterials using Micro-CT. Biomaterials, 28:2491-2504.
Kearney, M., Maisano, J.A., and Rowe, T. 2005. Cranial anatomy of the extinct worm-lizard Rhineura hatcherii (Squamata, Amphisbaenia) based on High-Resolution X-ray Computed Tomography. Journal of Morphology, 264:1-33.
Kuwazuru, O., Murata, Y., Hangai, Y., Utsunomiya, T., Kitahara, S., and Yoshikawa, N. 2008. X-ray CT inspection for porosities and its effect on fatigue of die cast aluminium alloy. Journal of Solid Mechanics and Materials Engineering, 2:1220-1231.
Lak, M., Nèraudeau, D., Nel, A., Cloetens, P., Perrichot, V., and Tafforeau, P. 2008. Phase contrast X-ray synchrotron imaging: opening access to fossil inclusions in opaque amber. Microscopy and Microanalysis, 14, 251-259.
Maire, E. and Withers, P.J. 2014. Quantitative X-ray tomography. International Materials Reviews, 59: 1-43.
Matthews, T. and Stynder, D. 2011a. An analysis of two Myosorex species (Soricidae) from the Early Pliocene site of Langebaanweg (West coast, South Africa) using geometric morphometrics and linear measurements. Geobios, 44:87-99.
Matthews, T. and Stynder, D. 2011b. An analysis of the Aethomys (Murinae) community from Langebaanweg (Early Pliocene, South Africa) using geometric morphometrics. Palaeogeography, Palaeoclimatology, Palaeoecology, 302:230-242.
Matthews, T., van Dijk, E., Roberts, D.L., and Smith, R.M.H. 2015. An early Pliocene (5.1 Mya) fossil frog community from Langebaanweg, south-western Cape, South Africa. African Journal of Herpetology, 64(1):39-53.
McColl, D.J., Abel, R.L., Spears, I.R., and Macho, G.A. 2006. Automated method to measure trabecular thickness from microcomputed tomographic scans and its application. Anatomical Record,Part A, Discoveries in Molecular, Cellular and Evolutionary Biology, 288:982-988.
Ni, X., Flynn, J.J., and Wyss, R.A. 2012. Imaging the inner ear in fossil mammals: High-resolution CT scanning and 3-D virtual reconstructions. Palaeontologia Electronica, 15.2.18A:10pp, 1.09MB; palaeo-electronica.org/content/2012-issue-2-articles/251-mammal-inner-ear
Nicoletto, G., Anzelotti, G., and Konecná, R. 2010. X-ray computed tomography vs. metallography for pore sizing and fatigue of cast Al-alloys. Procedia Engineering , 2:547-554.
Nicoletto, G., Konecná, R., and Fintova, S. 2012. Characterization of microshrinkage casting defects of Al-Si alloys by X-ray computed tomography and metallography. International Journal of Fatigue, 41:39-46.
Renaud, S. 1999. Size and shape variability in relation to species differences and climatic gradients in the African rodent Oenomys. Journal of Biogeography, 26:857-865.
Renaud, S., Benammi, M., and Jaeger, J. 1999. Morphological evolution of the murine rodent Paraethomys in response to climatic variations (Mio-Pleistocene of North Africa). Paleobiology, 25(3):369-382.
Ronan, R., Abel, R.L., Johnson, K., and Perry, C. 2010. Quantification of porosity in Acropora pulchra (Brook 1891) using X-ray micro-computed tomography techniques. Journal of Experimental Marine Biology and Ecology, 396:1-9.
Sanchez, S., Ahlberg, P.E., Trinajstic, K.M., Mirone, A., and Tafforeau, P. 2012. Three-dimensional synchrotron virtual paleohistology: A new insight into the world of fossil bone microstructures. Microscopy and Microanalysis , 18:1095-1105.
Sanchez, S., Dupret, V., Tafforeau, P., Trinajstic, K.M., Ryll, B., and Gouttenoire, P.-J. 2013. 3D microstructural architecture of muscle attachments in extant and fossil vertebrates revealed by synchrotron microtomography. PloS ONE, 8:e56992.
Spoor, C.F., Zonneveld, F.W., and Macho, G.A. 1993. Linear measurements of cortical bone and dental enamel by computed tomography: Applications and problems. American Journal of Physical Anthropology, 91:469-484.
Sutton, M.D. 2008. Tomographic techniques for the study of exceptionally preserved fossils. Proceedings of the Royal Society of London B, 275:1587-1593.
Tafforeau, P., Boistel, R., Boller, E., Bravin, A., Brunet, M., Chaimanee, Y., Cloetens, P., Feist, M., Hoszowska, J., Jaegers, J.J., Kay, R.F., Lazzaris, V., Marivaux, L., Nel, A., Nemozi, C., Thibault, X., Vignaud, P., and Zabler, S. 2006. Applications of X-ray synchrotron microtomography for non-destructive 3D studies of paleontological specimens. Applied Physics A - Materials Science & Processing, 83:95-202.
Wan, Q., Zhao H., and Zou, C. 2014. Effect of micro-porosities on fatigue behavior in aluminum die castings by 3D X-ray tomography inspection. ISIJ International, 54(3):511-515.
Wichura, H., Jacobs, L.L., Lin, A., Polcyn, M.J., Manthi, F.K., Winkler, D.A., Strecker, M.R., and Clemens, M. 2015. A 17-My-old whale constrains onset of uplift and climate change in east Africa. Proceedings of the National Academy of Sciences of the United States of America, 112:3910-3915.
Zelditch, M.L., Swiderski, D.L., and Sheets, H.D. 2012. Geometric Morphometrics for Biologists, Second Edition: A Primer. Elsevier, San Diego.
