

 Identifying tooth position of isolated teeth of sparassodonts (Mammalia: Metatheria) using geometric morphometrics
Article number: 25.1.a8
https://doi.org/10.26879/1111
Copyright Society of Vertebrate Paleontology, February 2022
Author biographies
Plain-language and multi-lingual abstracts
PDF version
Submission: 17 July 2020. Acceptance: 1 February 2022.
ABSTRACT
Isolated teeth make up much of the mammalian fossil record. The scientific value of these specimens is maximized when their specific locus can be identified, which permits precise comparisons with more complete specimens. However, identifying tooth locus can be challenging, particularly in metatherians, as these animals have multiple molar loci (M1-3/m1-4) that typically differ only in relatively subtle aspects. In this study, we use geometric morphometrics to analyze the first three upper molars (M1-3) of the metatherian clade Sparassodonta to determine whether it is possible to classify isolated teeth to locus using linear discriminant analysis. Discriminant analyses return high cross-validation reclassification rates of 72-83% and classify several specimens of unknown locus with high posterior probabilities, suggesting that they can be used to confidently identify tooth locus in metatherians. The morphological features that best distinguish tooth loci from each other are the shape of the stylar shelf and development of the ectoflexus and parastylar lobe. Specifically, the parastylar lobe is labiolingually narrower than the width of the stylar shelf at the midpoint of the tooth on M1, equal in width on M2, and greater than width on M3, forming an ectoflexus. Our study provides an open-access morphometric dataset that other researchers can use to determine tooth loci of isolated sparassodont teeth, such as those collected by screen-washing or surface collecting.
Russell K. Engelman. Department of Biology, Case Western Reserve University, 10900 Euclid Ave., Cleveland, Ohio 44106, U.S.A. neovenatoridae@gmail.com
Darin A. Croft. Department of Anatomy, Case Western Reserve University School of Medicine, 10900 Euclid Ave., Cleveland, Ohio 44106-4930, U.S.A. dcroft@case.edu
Keywords: geometric morphometrics; discriminant analysis; Sparassodonta; Marsupialia; dentition
Final citation: Engelman, Russell K. and Croft, Darin A. 2022. Identifying tooth position of isolated teeth of sparassodonts (Mammalia: Metatheria) using geometric morphometrics. Palaeontologia Electronica, 25(1):a8. https://doi.org/10.26879/1111
palaeo-electronica.org/content/2022/3552-sparassodont-morphometrics
Copyright: February 2022 Society of Vertebrate Paleontology.
This is an open access article distributed under the terms of the Creative Commons Attribution License, which permits unrestricted use, distribution, and reproduction in any medium, provided the original author and source are credited.
creativecommons.org/licenses/by/4.0creativecommons.org/licenses/by-nc-sa/4.0/
INTRODUCTION
Teeth are the most frequently recovered remains in the mammalian fossil record and, due to their complex morphology, often preserve significant phylogenetic and ecological information (Rose, 2006; Ungar, 2010). Mammalian molars are frequently diagnostic to species, even if recovered as isolated elements, and many taxa have been named based on isolated molars (e.g., Antoine et al., 2012; Beck, 2013; Bond et al., 2015). Character lists in phylogenetic analyses of mammals are dominated by dental characters (Brocklehurst and Benevento, 2020; Sansom et al., 2017), and isolated molars can be used to determine dietary habits and estimate body mass (e.g., Zimicz, 2012).
The taxonomic, phylogenetic, and paleobiologic utility of a tooth is maximized when it can be assigned to the correct locus, as this allows for direct comparisons among taxa. Assigning a tooth to class (e.g., premolar, molar) is often straightforward, particularly when it is preserved in situ in the cranium or dentary (but see Billet et al., 2010). By contrast, correct locus identification can be challenging when a tooth that could belong to one of several morphologically similar loci is found in isolation, as often happens with screen washing or surface collecting. Misidentification of tooth locus can result in incorrect taxonomic or paleobiological interpretations (for examples, see Billet et al., 2010; Borths and Stevens, 2017; Zack, 2012). In such situations the conservative and frequently exercised option is to refer the tooth only to class, such as premolar or molar. However, this can result in the loss of critical morphological information and/or preclude the recognition of new species. Although it is possible to assign a tooth to a particular locus based on personal experience/knowledge, a less subjective and independently repeatable method is preferable and often achievable, as demonstrated by Naylor and Marcus (1994) for carcharhinid sharks.
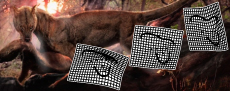
 Properly identifying a tooth to locus is a particularly challenging issue in studies of metatherians (marsupials and their extinct relatives). Metatherians have four upper and lower molars, typically annotated as M/m1-4, that are often quite similar except in size, especially in species with relatively unspecialized, tribosphenic molars (Kielan-Jaworowska et al., 2004; Reig et al., 1987; Werdelin, 1987). The few differences that do exist among loci are often shape gradients rather than discrete features that distinguish a particular locus. Among tribosphenic metatherians, M/m4 and, to a lesser degree, M/m1, are generally recognizable, but it is often difficult to distinguish M/m2 from M/m3 (e.g., Beck, 2013; Goin et al., 2020). This is even more problematic in metatherians such as sparassodonts that have a secondarily simplified dentition; the trigon, talon, metaconid, and stylar shelf and its cusps are frequently reduced or lost as a result of specializations for carnivory (Muizon and Lange-Badré, 1997; Solé and Ladevèze, 2017). In sparassodonts, many of the morphological gradients that vary from M1 to M3, such as a smaller paracone and larger metacone, wider stylar shelf, and longer postmetacrista in M3s are also used to diagnose taxa. However, these features also correlate with both phylogeny and paleobiology. The most basal sparassodonts are characterized by a smaller metacone, wider stylar shelf, larger talon, and shorter postmetacrista and, as a result, are inferred to be the least specialized for carnivory (Marshall, 1981; Zimicz, 2012). This can make it difficult to determine whether an isolated upper molar represents the M3 of an earlier-diverging (and less carnivorous) sparassodont or the M2 of a later-diverging taxon with a more specialized dentition (e.g., compare the M2 of Figure 1A with the M3 of Figure 1B, or the M1/M2 of Figure 1B with the M2/M3 of Figure 1C). Nevertheless, as mentioned above, sparassodont taxa are frequently diagnosed by features such as the relative length of the postmetacrista or width of the stylar shelf between homologous teeth (e.g., Marshall, 1979; 1981). Therefore, assigning an isolated tooth to locus is important for taxonomic purposes.
In this study, we examine several undescribed isolated sparassodont teeth of middle Eocene age that were collected by personnel of the American Museum of Natural History Scarritt Expedition to Patagonia in 1930. These teeth pertain to geologically old, apparently early-diverging sparassodonts with many plesiomorphic features. As a result, the features that distinguish the first three upper molars from one another are less pronounced than in later species. However, the degree to which the features that distinguish these teeth from those of other sparassodonts are taxonomically distinctive or phylogenetically significant cannot be determined without identifying their locus. Here we use discriminant function analysis (i.e., canonical variates analysis) to identify the loci of these unknown teeth based on a large, diverse sample of sparassodont teeth of known position. Our results suggest that it is possible to identify isolated sparassodont teeth to locus using geometric morphometrics and canonical variates analysis and provide a foundation and resource for identifying isolated teeth in future studies.
MATERIALS AND METHODS
Data Collection
Two-dimensional geometric morphometric data were collected from 119 sparassodont upper molars (M1-3) of known locus (34 M1s, 42 M2s, and 43 M3s) representing 48 individuals and 37 taxa (Appendix 1). Landmark data from these specimens can be found in the Supplementary Information. This training dataset includes representatives of every major group of sparassodonts (in a categorical, non-cladistic sense), including basal sparassodonts (e.g., Patene, Hondadelphys), hathliacynids (e.g., Sipalocyon, Cladosictis), basal borhyaenoids (e.g., Lycopsis, Prothylacynus), borhyaenids (e.g., Borhyaena, Arctodictis), proborhyaenids (e.g., Callistoe, Proborhyaena), and thylacosmilines (e.g., Patagosmilus, Thylacosmilus). The term “basal sparassodont” refers here to all sparassodonts basal to the split between Hathliacynidae and Borhyaenoidea, and “basal borhyaenoid” refers to all borhyaenoids outside the clade formed by Borhyaenidae and Proborhyaenidae, similar to previous studies (e.g., Forasiepi, 2009). In almost all cases, the measured teeth were located in situ in the maxilla, and their locus could be determined objectively. Only six teeth in the training dataset were not in situ in the maxilla; the positions of these teeth were identified through comparisons with other members of the same taxon in which tooth positions are known.
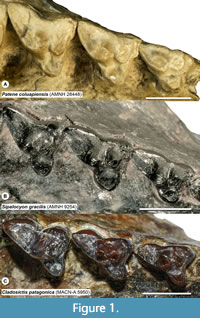
 Forty-seven points were digitized on two-dimensional occlusal images of sparassodont molars: 11 fixed landmarks and two semilandmark curves of 13 and 22 points (Figure 2, Table 1). Landmark data were collected in tpsDig 2.31 (Rohlf, 2017) and tpsUtil 1.76 (Rohlf, 2018). Two-dimensional landmarks were used instead of three-dimensional ones as data in the z-axis of sparassodont teeth are highly dependent on the degree of tooth wear and hence are not comparable across specimens. In worn teeth, the apices of the paracone and metacone were considered to be at the center of their wear facets. These cusps are conical in most sparassodonts (except for Allqokirus australis, Mayulestes ferox, Hondadelphys fieldsi, Thylacosmilus atrox, and at least one specimen assigned to Patene simpsoni; Engelman pers. obs.; Forasiepi, 2009; Forasiepi and Carlini, 2010), and their wear facets are mostly apical, meaning the apex of the cusp is located at the center of the cusp in occlusal view in most taxa. More landmarks were used to capture the morphology of the stylar shelf than the talon (25 versus 15) because the former is a more complex structure with multiple features of interest (such as the shape of para/metastylar lobes, ectoflexus), whereas the lingual border of the talon is a simple curve.
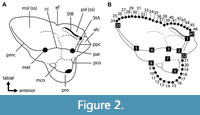
 All of the fixed landmarks used are type I or type II landmarks (sensu Bookstein, 1991) except landmark 47, which is the anterior end of the stylar shelf. This point is defined here as the point where each tooth contacts the preceding tooth, typically the parastylar corner. The parastylar corner is unambiguously identifiable in most metatherians, including many sparassodonts included in this analysis (see Figure 1A), where it takes the form of a distinct ridge that extends anteriorly from the parastyle (the preparastyle) to create a sharp corner in the anterior outline of the tooth. However, in other sparassodonts, the parastylar corner is reduced and rounded (Figure 3). As a result, landmark 47 was measured in these taxa as the anteriormost point of the parastylar lobe. Therefore, landmark 47 is a type II landmark in sparassodonts with a well-developed parastylar corner (e.g., Allqokirus australis, Patene spp.) but a type III landmark in others (most hathliacynids and borhyaenoids). The use of type III landmarks is typically discouraged due to difficulties in replication across specimens, but it was necessary to define an anterior end of the stylar shelf in order to define the shape of this structure using a semilandmark curve. Examinations of the semilandmark curves in tpsDig 2.31 (Rohlf, 2017) found that this point was generally consistent across specimens.
Semilandmarks were not used to determine the morphology of the major crests of the teeth (e.g., the shape of the postmetacrista), as the morphology of these structures can be heavily influenced by wear and therefore cannot easily be compared between specimens of different wear stages. The positions of missing landmarks were estimated using a thin-plate spline (Gunz et al., 2009) using the ‘estimate.missing’ function in geomorph 3.1.0 package (Adams et al., 2019) in R 3.6.1 (R Core Team, 2020). Missing landmarks were only estimated for seven specimens, not counting specimens missing the talon, which were excluded from the total landmark analysis. All other specimens had complete landmark data.
Preliminary efforts were also made to investigate potentially confounding covariance between shape data and phylogeny/dietary habits. Higher-level taxonomy of sparassodonts follows the previously published literature (e.g., Forasiepi, 2009). Dietary habits were inferred based on the relative grinding area of the last lower molar (RGA), which has been used to infer dietary habits in sparassodonts following the methodology of Prevosti et al. (2013). RGA was mainly taken from Prevosti et al. (2013), with RGA calculated for additional sparassodonts based on the previously published literature. RGA for Allqokirus australis was calculated from Muizon et al. (2018), Cladosictis centralis from Marshall (1981), Lycopsis longirostrus from Suarez (2019), Mayulestes ferox from Muizon (1998), Patene simpsoni from Rangel et al. (2018), and Sallacyon hoffstetteri from Petter and Hoffstetter (1983). Correlations between taxonomic group and/or RGA and principal components of variation were examined using ANOVA/MANOVA and linear methods.
Allometry was not removed a priori from the analysis because of the potential covariance between allometric shape variation and other variables of interest like tooth locus, diet, or phylogeny (Thomson and Curran, 2013). However, because allometry can be measured just by considering the tooth in a vacuum (size being a directly measurable characteristic), whereas dietary habits and taxonomy must be inferred from study and comparison, we also performed permutations of the trigon + talon and trigon only discriminant analysis with signal from allometry removed, as well as investigated the effects of allometric shape variation on the present dataset. Correlations between specimen size (= centroid size) and principal components of variation were examined using ANOVA/MANOVA and linear methods.
Geometric Morphometric Analysis
The locus of an unknown sparassodont tooth was determined using canonical variates analysis (hereafter CVA), a type of discriminant analysis in which more than two groups are present (Dunn, 2018). CVA is well-suited for identifying isolated teeth to locus, as tooth loci are unambiguous, distinct categories that correspond to real biological variation among teeth. Using CVA rather than methods such as between-group PCA has been criticized for exaggerating separation between groups (Chemisquy et al., 2015; Curran, 2018), as it weights variables that maximally separate predefined groups. However, since our goal is classification rather than exploration of morphological shape variation, we judge CVA to be more appropriate in this case. The landmark geometric morphometric data were examined in R 3.6.1 (R Core Team, 2020) using the packages geomorph 3.1.0 (Adams et al., 2019), Morpho 2.7 (Schlager, 2017), and MASS (Venables and Ripley, 2002). An initial, exploratory principal components analysis (PCA) was performed using geomorph to examine the distribution of the data prior to CVA. Additional analyses looking at covariance between the first four principal components and variables such as centroid size, RGA, or taxonomic group were performed using ANOVA/MANOVA and linear models. Prior to the CVA, the landmark data were transformed in geomorph using a generalized Procrustes analysis to remove the effects of isometric size, position, and orientation. Semilandmarks were aligned along curves using minimum bending energy in geomorph; using Procrustes distance produced morphologically inaccurate results that did not accurately capture the shape of the specimen. The resulting Procrustes coordinates were subjected to a PCA in geomorph to explore the morphospace and reduce the number of variables, and the CVA was performed on a reduced number of the resulting principal components (PCs) in Morpho and MASS. Performing the CVA on the PCs rather than the Procrustes coordinates is necessary because Procrustes analyses of landmarks typically produce high numbers of variables, but CVA requires more specimens in each group than variables to accurately classify unknowns (Kovarovic et al., 2011). PCA resummarizes sample variation to express most of the variance in the first few variables, allowing many of the remaining axes that represent little variation to be ignored, which helps prevent overfitting. Following the methodology of Sheets et al. (2006) and Curran (2018), we used the lowest number of PCs that retained the highest reclassification rate but represented less than 99% of the cumulative variation of the dataset to avoid overfitting. Morphological disparity between specimens was calculated via Procrustes distance (Zelditch et al., 2012). Pairwise analyses of Procrustes variance between tooth loci were conducted via the morphol.disparity function in geomorph.
Prior probabilities for each of the three tooth loci were considered equal (0.33). Statistical significance of the ability of the CVA to discriminate among tooth loci was tested by permutations tests using Mahalanobis distances of group centroid versus randomly resampled data in the R package morpho. Accuracy of the CVA training models was determined through cross-validation (“leave one out”) analysis: removing one specimen, recalculating the CVA, and then classifying the known, removed specimen to a group. This is done for each specimen in turn, and is used to calculate an overall reclassification rate accuracy for the model. Resubstitution, the other method frequently used to evaluate CVA model accuracy in the literature, was not used because it typically overestimates accuracy in discriminant functions (Kovarovic et al., 2011; Sheets et al., 2006; Solow, 1990), as it does not exclude specimens when calculating the percent accurate reclassification rate.
Because several of the teeth examined here (five specimens of known locus and three of unknown locus) lack the talon, we performed permutations of the CVA both including and excluding talon data. Specimens lacking the talon were not included in the total dataset analysis. Additionally, we conducted versions of the analysis excluding taxa that exhibited high errors in reclassification rates and represented outliers to the rest of the dataset. These included the basal sparassodonts from Tiupampa, Bolivia (Allqokirus and Mayulestes), borhyaenids, and thylacosmilines (see Results for more details). Because the unknown taxa of interest in this study seem to represent early-diverging sparassodonts and therefore might be expected to be morphologically more similar to Allqokirus or Mayulestes than borhyaenids or thylacosmilines, we also performed versions of the analysis excluding the latter clades but including the former taxa.
The training models were used to classify four isolated sparassodont teeth of unknown position from the middle Eocene (Vacan and Barrancan South American Land Mammal “Ages”) from the collections of the American Museum of Natural History. The detailed descriptions and taxonomic diagnoses of these specimens are in progress (Engelman and Croft, in prep). We also included an isolated sparassodont tooth (MPEF-PV 4345) from the early Oligocene site of La Cancha (described by Goin et al., 2010), due to its resemblance to some of the unknown teeth examined here.
Institutional Abbreviations
AC, Beneski Museum of Natural History, Amherst, U.S.A.; AMNH, American Museum of Natural History, New York, U.S.A.; FMNH, The Field Museum, Chicago, U.S.A.; LIEB-PV, Colección Paleontología de Vertebrados, Laboratorio de Investigaciones en Evolución y Biodiversidad; MACN-A, Ameghino collection, Museo Argentino de Ciencias Naturales “Bernardino Rivadavia”, Buenos Aires, Argentina; MLP, Museo de La Plata, La Plata, Argentina; MMP, Museo Municipal de Ciencias Naturales de Mar del Plata, Mar del Plata, Argentina; MNHC, Museo de Historia Natural de Cochabamba, Cochabamba, Bolivia; MNHN, Muséum National d’Histoire Naturelle, Paris, France; MNRJ, Museu Nacional e Universidade Federal do Rio de Janeiro, Rio de Janeiro, Brazil; MPEF-PV, Museo Paleontológico Edigio Ferugulio, Trelew, Argentina; MUN, Mapuka Museum of Universidad del Norte, Barranquilla, Colombia (repository); PVL, Paleontología Vertebrados Lillo, Tucumán, Argentina; STRI, Smithsonian Tropical Research Institute, Panama City, Panama; UATF-V, Universidad Autónoma Tomás Frías, Potosí, Bolivia; UCMP, University of California Museum of Paleontology, Berkeley, California, U.S.A.; UF, Florida Museum of Natural History, University of Florida, Gainesville, U.S.A.; YPM-VPPU, Princeton University Collection, Yale Peabody Museum, New Haven, U.S.A.
Anatomical abbreviations. Upper and lower molar loci are abbreviated as M/m1-4, respectively.
RESULTS
Initial Principal Components Analysis
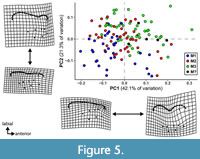
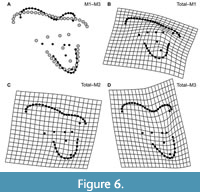
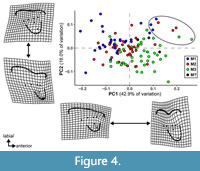 The results of the PCA of the landmark geometric morphometric data are roughly comparable across all datasets. Therefore, this section presents the results of the analysis of the total (trigon + talon) dataset including all taxa, unless otherwise noted. The first two PCs summarize 58.4% of the total variation (PC1 = 42.7%; PC2 = 15.7%). A plot of the first two PCs shows only slight clustering by locus and significant overlap among the morphospaces of each locus (Figure 4). A plot of the first two PCs of the trigon-only dataset shows a similar pattern (Figure 5). In the results presented here, M1s tend to exhibit negative values on PC1 and positive values on PC2, whereas M3s show the opposite trend. M2s plot between M1s and M3s, with the centroid of M2 close to the centroid of the entire dataset; the mean shape of M2 and the entire dataset are almost identical (Figure 6C). The centroids of M2 on PC1-4 plot close to the midpoints of a line connecting the centroids of M1 and M3, and on PC1-2, the positions of the centroids of M1 and M3 relative to the origin are nearly identical to one another but opposite in magnitude, resulting in M1 plotting in the upper left quadrant and M3 is in the lower right. Differences between M2 and other loci are of the same relative magnitude, and no unique features distinguish M2s from the other two loci. That is, the same features that distinguish M1 from M2 also distinguish M2 from M3, and vice versa. Morphological disparity (measured as Procrustes variance) is highest for M1 (0.0221) and lowest for M2 (0.0146), even though M1 is represented by the fewest specimens (N = 34). The difference in variance between M1 and M2, measured via pairwise analysis, is statistically significant (p = 0.022), but differences between M2 and M3 (p = 0.147) and M1 and M3 (p = 0.356) are not (see Appendix 2-Appendix 3).
 Positive values on PC1 are correlated with: 1) a narrow stylar shelf with 2) smaller ectoflexus and 3) narrow parastylar lobe; 4) short preparacrista that is 5) almost parallel to the axis formed by the paracone and metacone; 6) more obliquely oriented postmetacrista; 7) larger metacone; and 8) labiolingually narrow protocone. Negative values on PC1 are correlated with: 1) labiolingually wide stylar shelf with 2) well-developed ectoflexus and 3) labiolingually wide parastylar lobe; 4) long preparacrista that is 5) almost perpendicular to the long axis of the tooth; 6) more transversely oriented postmetacrista; 7) smaller metacone; and 8) labiolingually wide protocone. Specimens at the extreme positive end of PC1 are primarily M1s of taxa with highly carnassialized anterior molars, such as Borhyaenidium spp., Pseudolycopsis cabrerai, and Thylacosmilus atrox. Specimens at the extreme negative end of PC1 are molars with some of the least-pronounced carnivorous features, such as the M2-3 of Allqokirus australis and Mayulestes ferox and the M3 of Sipalocyon gracilis.
 Positive values on PC2 are correlated with: 1) distolingually elongate metastylar lobe and 2) long postmetacrista; 3) more pronounced ectoflexus; 4) longer, more anterolabially oriented preparacrista; 5) wider stylar shelf; and 6) a small, anteroposteriorly narrow, eccentric protocone. Negative values on PC2 are correlated with: 1) short metastylar lobe and 2) short postmetacrista; 3) deeper ectoflexus; 4) shorter, more anteroposteriorly oriented preparacrista; 5) narrower stylar shelf; and 6) a large, anteroposteriorly wide, non-eccentric protocone. This affects the overall outline of the tooth such that teeth with low values on PC2 resemble a scalene triangle whereas those with high values on PC2 resemble an equilateral triangle. Specimens exhibiting extreme positive values on PC2 are primarily anterior molars (M1 and sometimes M2) of taxa with plesiomorphic dentitions such as Allqokirus australis, Mayulestes ferox, Patene coluapiensis, Hondadelphys fieldsi, and Stylocynus paranensis. However, some posterior teeth exhibit high positive PC2 values: the M3s of Hondadelphys fieldsi have some of the highest positive values on PC2. Similarly, the highest value on this axis does not correspond to a basal sparassodont but to the M1 of the borhyaenoid Lycopsis longirostrus. Specimens with extreme negative values on PC2 are primarily M3s of taxa with highly sectorial molars, though the M1 of Thylacosmilus atrox also has a highly negative PC2 score.
PC3, which represents 13.5% of the total variation, primarily separates teeth that are 1) gracile with 2) narrow stylar shelves and 3) especially narrow, anteroposteriorly long parastylar lobes; 4) larger paracones; 5) smaller metacones; 6) more anteroposteriorly oriented preparacristae; and 7) labiolingually wider protocones at the extreme negative end from teeth that are 1) less angular with relatively rounded parastylar and metastylar lobes; 2) comparatively wide stylar shelves; 3) anteroposteriorly narrower but labiolingually wider parastylar lobes and more pronounced ectoflexi; 4) smaller paracones; 5) larger metacones; 6) more transverse preparacristae; and 7) labiolingually shorter protocones on the extreme positive end. Variation in this axis is noteworthy, as specimens with the most positive values primarily include M2-3 of borhyaenids and the basal borhyaenoid Prothylacynus patagonicus, all of which have relatively globose teeth.
PC4, which represents 6.9% of the total variation, represents very subtle differences in tooth shape compared to PC1-3. Differences in this PC primarily reflect the width of the stylar shelf and associated features (length of the preparacrista and length and orientation of the postmetacrista), with extreme negative values on PC4 correlating with labiolingually wide shelves with long cristae and positive values correlating with narrower shelves. Specimens with extreme negative values on PC1 also exhibit more pronounced ectoflexi and labiolingually narrower protocones than extreme positive values.
The Tiupampa sparassodonts Mayulestes ferox and Allqokirus australis are characterized by highly positive values on both PC1 and PC2 and plot outside the area occupied by the remaining sparassodont taxa (see the eight points plotting in the extremes of PC1 and PC2 circled in Figure 4), reinforcing the qualitative observation that these animals are morphologically very different from remaining sparassodonts. However, M1-3 of Patene simpsoni and M1 of Fredszalaya hunteri plot between M1-3 of the Tiupampa sparassodonts and the corresponding loci of other sparassodonts. The teeth of Allqokirus and Mayulestes, particularly M2-3, exhibit high Procrustes distances from the mean of the sample and plot above the upper quartile of the sample. The Procrustes distance from the mean is also high for the M1 of Thylacosmilus atrox, Borhyaenidium musteloides, Hondadelphys fieldsi, Lycopsis longirostrus, Pseudolycopsis cabrerai, and the M3 of Procladosictis anomala (the latter of which also plots above the upper quartile of the sample).
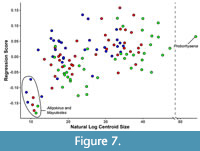 There is significant allometric variation in the shape data (Figure 7), regardless of whether tooth locus is treated as an additional independent variable (MANOVA, F = 13.542, p < 0.0001) or not (MANOVA, F = 10.964, p < 0.0001). A slight clustering of teeth by locus is visible when shape data are plotted against log centroid size (Figure 7), as might be expected given that the general size relationship in sparassodonts is M3 > M2 > M1. This is especially evident when comparing different tooth loci in a single specimen. For example, the nine points in the bottom left corner of Figure 7 pertain to the Tiupampa sparassodonts Allqokirus australis and Mayulestes ferox as well as the M1 of Patene simpsoni. For Allqokirus and Mayulestes, which are circled in Figure 7, these taxa are both represented by a single individual with all tooth loci represented. In A. australis and M. ferox, anterior tooth loci always have a smaller log centroid size and a more positive shape score. Testing for interaction between centroid size and locus (i.e., do different teeth loci exhibit different allometric patterns) indicates that allometric shape changes do not differ significantly between tooth loci (df = 2, F = 0.9934, p = 0.4226). Shape differences on the extremes of PC1-4 between allometrically corrected and non-corrected coordinates are minor (being slightly more noticeable on PC3).
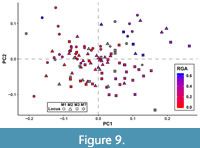
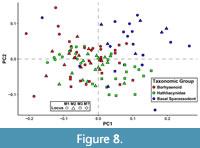 Many of the shape axes that separate teeth by locus also covary with phylogeny or dietary habits to some degree. Color-coding a graph of the first two PCs based on broad-scale taxonomy (as many taxa in this analysis have not been considered in a phylogenetic context and have only been assigned to very broad taxonomic groups) reveals three distinct clusters: one for hathliacynids, borhyaenoids, and basal sparassodonts outside the clade of Hathliacynidae + Borhyaenoidea (Figure 8). Basal sparassodonts are the best distinguished cluster, with most basal sparassodonts plotting more positively on PC1 and PC2 than either hathliacynids or borhyaenoids. Basal sparassodonts that are thought to be more specialized for carnivory (i.e., may be closer to the clade of Hathliacynidae + Borhyaenoidea on the sparassodont stem), such as Patene coluapiensis and Procladosictis anomala actually plot within hathliacynid + borhyaenoid morphospace (Figure 8). Borhyaenoids and hathliacynids show more overlap, but hathliacynid teeth tend to plot more positively on PC1 and negatively on PC2 than borhyaenoid teeth of a homologous locus. An ANOVA of group versus PC score finds group to be significantly correlated with both PC1 (df = 2, F = 23.631, p < 0.001) and PC2 (df =2, F = 12.235, p < 0.001). A Tukey’s HSD test finds the differences in PC scores on PC1-2 to be non-significant between hathliacynids and borhyaenoids (PC1, p = 0.058; PC2, p = 0.112), but significant between basal sparassodonts and all other sparassodonts both on PC1 (basal sparassodont-hathliacynid, p < 0.001; basal sparassodont-borhyaenoid, p = 0.001) and PC2 (basal sparassodont-hathliacynid, p < 0.001; basal sparassodont-borhyaenoid, p = 0.004). A similar pattern can be seen when color-coding taxa based on inferred dietary habit (based on RGA of the lower molars). Taxa with higher RGA values plot more positively on PC1 and PC2, and taxa with lower RGA values plot more negatively (Figure 9). The relationship of the slope is significant between RGA and both PC1 (t = 6.226, df = 92, p < 0.001) and PC2 (t = 3.658, df = 92, p < 0.001), but the correlation coefficients are low (PC1, r2 = 0.296; PC2, r2 = 0.127).
 When further testing for allometric signal in the data by regressing natural log centroid size against the first four principal components (see Appendix 3 for more details), log centroid size was found to significantly correlate with PC1 (t = -3.544, p < 0.001), PC2 (t = -2.533, p = 0.013), and PC3 (t = 5.749, p < 0.01), though not PC4 (t = -0.100, p = 0.921). However, adding RGA as an additional independent variable resulted in centroid size no longer being statistically meaningful for PC1 (t = -0.789, p = 0.432) and PC2 (t= -0.051, p = 0.960); instead RGA was recovered as statistically significant (PC1: t= 4.158, p < 0.01; PC2: t = 2.705, p= 0.008). Adding in taxonomic group as a third independent variable resulted in the only significant correlation with PC1 to be whether a sparassodont was a basal form versus a hathliacynid or borhyaenid (t = 2.434, p = 0.017). For PC2 adding taxonomy resulted in no variable correlating with PC score, and for PC3 it resulted in only RGA, not centroid size or taxonomic group, correlating with the PC to a statistically detectable degree. These results indicate a significant amount of covariation between phylogeny, dietary habits, and allometry, and further support the idea that removing allometric variation to make conclusions may obscure variation from other sources of data.
Canonical Variates Analysis
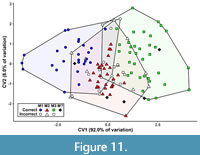
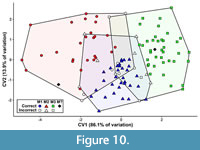 The first canonical variate (CV1) of the total (trigon + talon) dataset including all taxa summarizes 86.1% of the variation, with CV2 only representing 13.9% of the variation (Figure 10). The CVAs of the all-taxon trigon + talon and all-taxon trigon-only datasets shows some clustering by locus but also sizeable overlap (Figure 10, Figure 11). Most of the taxa that plot far outside their respective tooth locus clusters are borhyaenids or Tiupampa sparassodonts. CVAs of reduced-taxon datasets generally show much better separation among tooth loci than all-taxon datasets (compare Figure 10 to Figure 12), though the morphospaces of the three tooth loci are not well-separated from one another.
 Permutation tests for all datasets indicate differences between group centroids are significant for all tooth loci (Table 2). Mahalanobis distances are generally comparable among the various reduced-taxon datasets (though highest in the most restrictive dataset that excludes borhyaenids, thylacosmilines, and the Tiupampa taxa), but are much lower in all-taxon datasets. Mahalanobis distances are slightly lower for trigon-only datasets than for trigon + talon datasets with comparable taxonomic composition, though the Mahalanobis distances of the all-taxon, trigon-only dataset are particularly low. Mahalanobis distances for the dataset with allometric signal removed are much lower than for all other analyses.
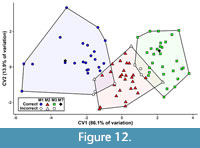 All of the training set-tested discriminant functions (Table 3) return high reclassification rates (> 75% accuracy except for the all-taxon, trigon-only dataset), which is significantly higher than would be expected if these functions were unable to discriminate between tooth loci and classified teeth randomly (33.3%). Reduced-taxon datasets return higher reclassification rates than all-taxon datasets, and the highest reclassification score (84%) is from the trigon + talon dataset without borhyaenids, whereas the next highest comes from the trigon + talon, reduced-taxon dataset without thylacosmilines, borhyaenids, or the Tiupampa sparassodonts. The high reclassification rate of the dataset excluding borhyaenids suggests that these taxa introduce a significant source of error into analyses of tooth locus in sparassodonts. The high reclassification rate of trigon + talon, reduced-taxon dataset without thylacosmilines, borhyaenids, or the Tiupampa sparassodonts is to be expected, as this dataset has the greatest number of landmarks yet the narrowest taxonomic scope. Similarly, the trigon-only, all-taxon dataset returns the lowest reclassification rate (73%) of the non-allometrically-controlled datasets and is the dataset with the broadest taxonomic scope and fewest landmarks. Datasets in which allometric signal was removed beforehand performed substantially worse than all other datasets. M1s are rarely misclassified as M3s and vice versa; most incorrect classifications are M2s (or other molars identified as M2). Reclassification rates for M3s are generally higher than for M1s and M2s.
In cases of misclassification, certain loci of particular taxa are more likely than others to be misclassified in the CVA, regardless of dataset. The anterior molars of Allqokirus australis, Mayulestes ferox, and Procladosictis anomala are frequently misidentified as more posterior loci (e.g., M1 misidentified as M2 or M3). By contrast, M2-3 of Pseudolycopsis cabrerai and the M2 of Chasicostylus castroi and Stylocynus paranensis are frequently misidentified as more anterior loci. (M3s of the latter two taxa are not represented in the present dataset.) Teeth of borhyaenids (with the notable exception of Acrocyon sectorius) are invariably misclassified, typically (but not always) as M2. A similar pattern is observed for M1 and M3 of Prothylacynus patagonicus and M1 of Fredszalaya hunteri (the crown of M3 is unknown).
Classification of Eocene Teeth of Unknown Locus
Of the five Eocene teeth of unknown locus examined here, two are complete (AMNH 28415 and AMNH 28439) and the remaining three preserve only the trigon (AMNH 28413, AMNH 28416, and MPEF-PV 4345). AMNH 28415 is classified as an M1 in all analyses, with a high posterior probability (p > 0.90) in all non-allometry controlled analyses except the all taxon, trigon-only analysis (Table 4). In the allometry controlled analyses, it is also returned as an M1, but with much lower posterior probabilities (p = ~0.5-0.6). AMNH 28439 is classified as an M3 with high posterior probability (p > 0.90) in all analyses (Table 4) except the all taxa, allometry-controlled, trigon + talon analysis, in which it is slightly lower (0.87).
Of the teeth that only preserve the trigon, AMNH 28413 is classified as an M2 in all analyses, with relatively high probabilities (> 0.80) for the analyses that do not consider allometry and a lower probability (0.63) for the analysis that includes allometry. AMNH 28416 is classified as an M3 with moderately high probability in the all-taxon analysis (0.75) and an M3 with high probabilities (> 0.90) in the reduced-taxon analyses. However, in the analysis that accounts for allometric signal it is classified as an M3 with relatively high posterior probability (0.74). MPEF-PV 4345 is classified as an M3 with low posterior probability (0.65) in the all-taxon analysis, but classified as an M2 with moderately high posterior probabilities (> 0.8) in all other analyses.
DISCUSSION
Interlocus Molar Variation
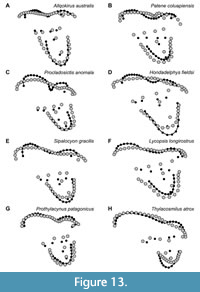 Some morphological features traditionally considered to differentiate M1, M2, and M3 in Sparassodonta based on direct observations and traditional morphometrics are captured by the present geometric morphometric analysis, though others are not (Figure 13). Based on direct observations and physical measurements of the sparassodont molars included in this analysis, the paracone decreases and the metacone increases in both absolute and relative occlusal area serially in the tooth row (that is, the paracone of M3 is much smaller than the paracone of M1 and the metacone of M3 is much larger than the metacone of M1). This makes the difference in size between paracone and metacone even more pronounced in posterior tooth loci. In the same vein, the centrocrista usually decreases in length from M1 to M3, largely due to the paracone decreasing in size and becoming increasingly subsumed into the base of the metacone. The stylar shelf, particularly the parastylar lobe, becomes wider from M1 to M3, the labial edge of the tooth is less oblique to the tooth row, and the ectoflexus becomes more pronounced. The preparacrista and postmetacrista increase in relative size from M1 to M3 and are typically oriented slightly more transverse to the tooth row in posterior tooth loci, though this difference is not as pronounced as other differences between tooth loci (the difference between M1 and M2/3 is often noticeable, whereas any difference between M2 and M3 is very slight). With regards to the talon, from M1 to M3, the protocone becomes anteroposteriorly narrower and labiolingually wider, and in many species, it becomes more eccentric. The talon remains comparable in occlusal area from M1 to M3 but appears smaller because the trigon (specifically the stylar shelf) increases in size from M1 to M3.
Almost all of the features listed above are also readily apparent when looking at deformation plots and vector drawings of shape changes between tooth loci (Figure 13). However, the increasing disparity in size between the paracone and metacone from M1 to M3, which is readily apparent visibly by gross observation of any given species of sparassodont for which the upper molar row is preserved (Figure 1, Figure 3), only shows weak correlation with differences in locus in the geometric morphometric dataset used here. The paracone shows a clear decrease in size from M1 to M3, but a comparable increase in size is less clear for the metacone. This may be an example of phylogenetic signal overriding morphometric signal. Later-diverging sparassodonts with stronger specializations for carnivory typically exhibit a larger metacone and smaller paracone than basal ones, confounding the otherwise clear relationship between tooth locus and the difference in size between these cusps visible in the tooth row of a single individual. A similar issue may affect the size of the protocone, as many basal sparassodonts exhibit a large protocone. It is also possible that using more landmarks to capture morphological differences between the paracone and metacone may provide a stronger locus-based signal. The junction of the bases of the paracone, metacone, and the stylar shelf typically becomes more anteriorly located from M1 to M3 due to the smaller size of the paracone and larger base of the metacone. However, since this point could not be reliably located in all specimens examined here, a landmark representing it could not be included.
The results of this analysis suggest that shape differences among the upper molars (M1-3) of Sparassodonta can best be thought of as a morphological gradient, with M2 representing an intermediate shape between M1 and M3. Differences in morphology between loci are mostly of relative magnitude; no locus has a unique shape that differentiates it from the other two. There was no case in which the morphology of M2 did not represent a morphological intermediate between M1 and M3, or any cases where the morphology of M3 did not represent an extrapolation of the morphological differences between M1 and M2 (the same is also true, in reverse, of M1). Molars with more pronounced carnivorous specializations frequently plot closer to the less extreme end of the morphospace for the next anterior locus, and those with less-pronounced specializations plot closer to the next posterior locus. Overall, on most PCs, the centroid of M2 is close to the origin of the entire sample, and the centroids of M1 and M3 have similar magnitudes in opposite directions. This suggests that evolutionary changes in the dentition of sparassodonts are highly integrated, with changes in one tooth reflected in other teeth in the tooth row. The integrated morphological changes seen here in sparassodonts (and likely metatherians more generally, given their low interlocus variability) may be the result of a developmental regulatory mechanism such as a developmental cascade or a morphogenic gradient, which can cause teeth to exhibit a morphological gradient based on their position in the jaw and has been indicated in correlated development of morphological features among tooth loci in other carnivorous mammals (Asahara et al., 2016).
From a practical standpoint, the easiest way to identify the upper molars of sparassodonts is by the morphology of the stylar shelf, particularly the development of the parastylar lobe and the resulting difference in width among the parastylar lobe, metastylar lobe, and anteroposterior midpoint of the molar/ectoflexus (Figure 6). In M1, the parastylar lobe is narrower than the width of the stylar shelf at the midpoint of the tooth, resulting in the ectoflexus being absent and the ectal margin of the tooth being oriented at a significant angle to the anteroposterior axis of the tooth row. In M2, the parastylar lobe is about the same width as the midpoint of the tooth (or at most slightly wider), and there is usually little to no ectoflexus. In M3, the parastylar lobe is typically wider than the stylar shelf at the anteroposterior midpoint of the tooth, resulting in a conspicuous ectoflexus in most taxa.
Overall, M1 seems to have undergone the most change in shape over evolutionary time within Sparassodonta, as evidenced by the higher disparity for this locus. This reflects the fact that, within Sparassodonta, M1 evolved from a generalized tribosphenic tooth resembling the plesiomorphic morphology for metatherians, as seen in the most basal sparassodonts (Allqokirus, Mayulestes; see Figure 13), to a highly carnassialized one in geologically young forms (e.g., Thylacosmilus, Borhyaenidium). By contrast, M3 is comparatively conservative, with its morphology more closely resembling the plesiomorphic tribosphenic metatherian condition (more perpendicular preparacrista, wider stylar shelf with deeper ectoflexus) even in geologically young forms. M2 is almost precisely intermediate between M1 and M3 in terms of these evolutionary patterns.
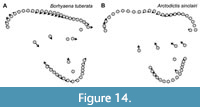 One group that differs from the typical pattern of interlocus variation seen in the remainder of Sparassodonta is the Borhyaenidae. Unlike other sparassodonts, borhyaenids show very little change in shape from M1 to M3 (compare Figure 13 to Figure 14). As a result, with the exception of a slight decrease in the size of the protocone and paracone and increase in the size of the metacone, borhyaenid molars are very similar to one another. This lack of variation is supported by a two-sided t-test examining interlocus shape disparity (represented by the average Procrustes distance between tooth loci in a given taxon for all associated pairs of upper molars in a single individual). Despite low sample sizes, borhyaenids exhibit much lower intra-locus morphological disparity than other sparassodonts between M1 and M2 (t = -4.0443, df = 2.235, p = 0.046) and M1 and M3 (t = -7.6147, df = 10.885, p < 0.001), but not M2 and M3 (t = -0.7086, df = 3.88915, p = 0.519). Prothylacynus patagonicus and Pseudothylacynus rectus exhibit inter-locus Procrustes distances between those of borhyaenids and other sparassodonts.
This lack of morphological differentiation between borhyaenid tooth loci resulted in a general failure of the discriminant functions to accurately classify borhyaenid teeth (see Appendix 3). As a result, including borhyaenids tends to decrease reclassification accuracy. Mahalanobis distances of tooth loci centroids (Table 2) are similar among most reduced-taxon dataset analyses (all of which lacked borhyaenids) but lower in all-taxon analyses. Borhyaenid molars in general are characterized by a robust, almost globular morphology compared to those of other sparassodonts, with a highly reduced stylar shelf and no ectoflexus (Forasiepi, 2009). This may be the factor underlying the inability of the CVA to accurately classify borhyaenid teeth, especially considering that variation in the shape of the stylar shelf shows the strongest interlocus signal in this study.
Some of the most conspicuous interlocus variation is present in several middle Miocene to Pliocene sparassodonts, including Hondadelphys fieldsi, Borhyaenidium musteloides, Borhyaenidium riggsi, Pseudolycopsis cabrerai and, to a lesser degree, Patagosmilus goini and Lycopsis longirostrus. However, two-sided t-tests of morphological disparity between middle Miocene-Pliocene sparassodonts and geologically older taxa are not significant, mostly because some Paleogene sparassodonts also exhibit high interlocus variation (e.g., Procladosictis anomala), and some middle Miocene-Pliocene sparassodonts exhibit low interlocus variation (e.g., Acyon myctoderos and Lycopsis viverensis). The high interlocus variation in these late Cenozoic taxa appears to be driven primarily by the morphology of M1, as the M1 of Thylacosmilus atrox, Borhyaenidium musteloides, Hondadelphys fieldsi, Lycopsis longirostrus, Pseudolycopsis cabrerai and, to a lesser degree, Borhyaenidium riggsi are also characterized by high Procrustes distances from the sample mean and extremely negative values on PC1. The M1 of C. castroi could not be included here due to damage to its metastylar lobe, but the M2 of C. castroi exhibits values very close to those of the carnassialized taxa mentioned here. Given that the M1 of C. castroi is more carnassialized than its M2, it seems reasonable to infer it would also plot as an extreme outlier on PC1. The M2 and M3 of these taxa are not as extreme, sometimes plotting towards the negative extreme of the morphospace for their respective locus, but not as consistently as M1 (especially M3).
The M1s of Borhyaenidium, Chasicostylus, and Pseudolycopsis have been described as highly carnassialized (Marshall, 1976, 1981; Reig, 1957), as they are anteroposteriorly long and labiolingually narrow, exhibit little to no stylar shelf, and have an anteroposteriorly elongate preparacrista that is aligned with the centrocrista and an elongate, highly obliquely-oriented postmetacrista. Thus, M1 in these taxa is superficially more similar to a carnivoran (placental) P4 carnassial than an M1 of another sparassodont (which is typically more molariform). The high interlocus variation and Procrustes distance for the M1s of these taxa appears to be due to their carnassialized morphology, which is further supported by the fact that highly negative values on PC1 are correlated with a highly carnassialized shape. Thylacosmilus atrox could also be described in similar terms. Hondadelphys fieldsi and Lycopsis longirostrus do not exhibit a M1 carnassialized to the same degree as seen in these other taxa, but the trigon of M1 appears to be very labiolingually narrow compared to other sparassodonts.
Covariance among Size, Diet, Phylogeny, and Locus
The results of this study suggest a complex covariance among size (allometry), diet, phylogeny, and locus in sparassodont teeth. A plot of specimens on the first two PCs shows some separation by tooth locus but also a distribution of taxa along an axis of inferred dietary habits that is roughly orthogonal to the one separating tooth loci (Figure 9). This correlation is also evident when looking at shape changes summarized by these PCs, particularly PC2. The extreme shapes on this PC are very similar to those that have been described for carnassials of hypercarnivorous (low PC2 values) and omnivorous/generalized (high PC2 values) placental mammals (Crusafont-Pairó and Truyols-Santonja, 1956; Van Valkenburgh, 1991; Wesley-Hunt, 2005).
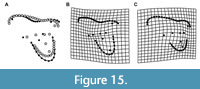 With regards to allometry, sparassodont molars with increasing size (regardless of locus) show: an anteroposteriorly shorter parastylar lobe, a metastylar lobe that is more distally elongate, a smaller ectoflexus, a shorter preparacrista, a longer, more obliquely oriented postmetacrista, a smaller paracone and larger metacone, and a less eccentric, labiolingually narrower talon (Figure 15). Notably, the overall width of the stylar shelf does not show significant allometric variation between taxa. Many of the features that vary allometrically in sparassodonts, including the development of the ectoflexus and relative size of the paracone and metacone, also differ among loci in teeth of the same individual. Some of these features, such as a larger metacone, more oblique cristae, narrower stylar shelf, and labiolingually narrower talon are likely also correlated with more carnivorous habitats in sparassodonts, as they are associated with increased carnivory in extant carnivorous mammals and have been suggested to have biomechanical significance. For example, a longer postmetacrista that is oriented more parallel to the tooth row increases the length of the crest along a mesiodistal axis, enhancing a ‘scissor-like’ action of mastication that aids in cutting flesh (Van Valen, 1969).
Tooth size and shape also appear to correlate with phylogeny among sparassodonts. The most basal lineages of sparassodonts (e.g., Allqokirus, Mayulestes, Patene, Hondadelphys) tend to be small (estimated body mass < 7 kg) and show the least pronounced adaptations for carnivory (Croft et al., 2018; Muizon et al., 2018; Prevosti et al., 2013). These features include a shorter preparacrista and postmetacrista, a larger talon, a wider stylar shelf, and less size disparity between the paracone and metacone. By contrast, borhyaenids and proborhyaenids (which many studies have recovered as a monophyletic group; Babot et al., 2002; Engelman et al., 2020; Forasiepi, 2009; Forasiepi et al., 2015; Muizon, 1999) include the largest sparassodonts (Croft et al., 2018; Ercoli and Prevosti, 2011; Prevosti et al., 2013) and show the most pronounced adaptations for carnivory. These features include a shorter preparacrista, larger metacone, smaller paracone, and a distolingually elongate metastylar lobe with longer postmetacrista compared to other sparassodonts. This influence of phylogeny on shape variation is evident in Figure 8, where basal sparassodonts, hathliacynids, and borhyaenoids generally plot in separate clusters (though some basal sparassodonts like Procladosictis and some basal borhyaenoids such as Lycopsis plot close to hathliacynids). However, methods to remove phylogenetic signal could not be applied to the present dataset as roughly half of the taxa examined here have never been included in a phylogenetic analysis and are of uncertain phylogenetic position (i.e., Acrocyon sectorius, Borhyaenidium spp., Chasicostylus castroi, Fredszalaya hunteri, Lumbrera Formation gen. et sp. nov., Patene coluapiensis, Pharsophorus tenax, Procladosictis anomala, Pseudolycopsis cabrerai, Pseudonotictis spp., Pseudothylacynus rectus, and the undescribed Eocene material). Additionally, since the goal of our analysis is to determine whether it is possible to classify isolated teeth to locus regardless of taxonomic identity, we chose a method that did not incorporate taxonomic (and, by extension, phylogenetic) information. In future analyses, we plan to examine phylogeny and other factors (e.g., diet) that likely account for other patterns of variation in tooth shape and form.
The potentially confounding covariance identified in this study is similar to the results obtained for didelphids by Chemisquy et al. (2015), who found that over two-thirds of the variance in shape explained by diet and by size (as single factors) in opossum molars actually represented covariance among diet, size, and phylogenetic signal. However, these authors did not consider different molar loci together in any of their analyses (analyses for molar locus were examined separately in that study) and, as a result, it is not possible to say how much diet, size, or phylogenetic signal correlate with interlocus differences between molars in their analysis.
The potential non-independence among allometry, phylogeny, and paleobiology is the reason that we include the results of CVAs both including and excluding allometric shape variation. Analyses that removed allometric signal resulted in much lower accuracy in cross-validated classification rates (69% with allometric correction versus 77% without correction for the trigon + talon dataset and 69% with allometric correction versus 72% without correction for the trigon-only dataset; Table 3). Posterior probabilities for the analyses excluding allometric shape variation were almost uniformly lower than analyses for which allometric shape information was included (Table 4). Thomson and Curran (2013) obtained a similar result in their study of cervid femora, finding that allometric correction did not improve reclassification rates, and concluded that this result was due to a lack of independence between size, phylogeny, and locomotor adaptations that resulted in correlations with their trait of interest (locomotor adaptations) being obscured.
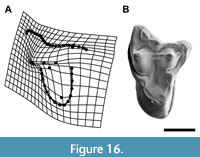 Extrapolating allometric shape variation beyond the lower end of the data produces a tooth with a narrow stylar shelf, an anteriorly-projecting parastylar lobe, a perpendicularly-oriented postmetacrista and metastylar lobe that project labially beyond the remainder of the trigon, and a very well-developed talon with a prominent basin that is much wider (labiolingually) than long (Figure 16A). Overall, this morphology is strikingly similar to the upper molars of other metatherians, specifically pediomyids (Figure 16B; see also Davis, 2007: fig. 3) and, to a lesser degree, microbiotherians (Marshall, 1982: fig. 4). It is unclear at this time whether this implies the distinctive morphology of pediomyids and similar metatherians can be attributed to allometric patterns within metatherian dentitions or that it is simply another example of the non-independence between size and carnivorous dental features in the present dataset. This is because pediomyids are thought to have been less carnivorous than contemporary metatherians like alphadontids, herpetotheriids, and peradectids (Davis, 2007; Williamson et al., 2014; Wilson, 2013), but are also relatively small compared to other Cretaceous metatherians (Gordon, 2003). Whether the dental features of pediomyids are truly representative of a less carnivorous diet, the result of allometric patterns within Metatheria, or both remains to be tested in future studies.
Results of the Canonical Variates Analysis on the Training Dataset
CVA shows a strong ability to correctly identify sparassodont teeth to locus, with accuracy rates for most datasets > 75%. Most misclassified teeth represent morphological extremes within Sparassodonta, such as taxa with plesiomorphic dentitions (e.g., Mayulestes, Allqokirus) or those with extreme specializations for carnivory (borhyaenids, Chasicostylus, Pseudolycopsis). By contrast, sparassodont teeth closer to the average tooth shape for the clade, such as the M2-3 of Patene spp., Lycopsis spp., Sipalocyon spp., and Acyon myctoderos, are typically classified accurately. This increases confidence that the loci of the unknown Eocene teeth considered here, which most closely resemble taxa like Patene and Sipalocyon, are accurately identified (discussed further below). The M1-2 of Allqokirus, Mayulestes (primarily in the trigon-only analysis for the latter), and Procladosictis, are frequently classified as a more posterior tooth locus. These taxa (especially Allqokirus and Mayulestes) exhibit wide stylar shelves and a generally plesiomorphic morphology compared to other sparassodonts (Goin, 2003). By contrast, posterior teeth (i.e., M2) of taxa like Chasicostylus and Stylocynus are classified as a more anterior locus. Chasicostylus is characterized by a very narrow stylar shelf with oblique and elongate cristae that make its M2 superficially similar to the M1 of other taxa. Similarly, the M2 of Stylocynus has a very narrow stylar shelf and a large talon, which might lead one to misidentify it as an M1 if the measured specimen were not found in situ in the maxilla.
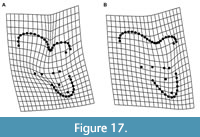 This study also highlights the distinctiveness of the dentition of Procladosictis anomala compared to other sparassodonts. P. anomala has long been noted for its autapomorphic dental morphology (Marshall, 1981), which includes an extremely wide stylar shelf (> 50% tooth width), a similarly deep ectoflexus on M3, and a small but basinless protocone (Figure 13CFigure 13C). Despite plotting as an outlier to the rest of the dataset in terms of Procrustes distance (the M3 of P. anomala is the single outlying point in the extreme lower right of Figure 4) the M3 of P. anomala was never misclassified in any CVA. This is because the features that distinguish the M3 of P. anomala (an extremely wide stylar shelf with an extremely deep ectoflexus that is approximately 29% of the tooth’s width) are exaggerations of the typical sparassodont M3 morphology rather than features characteristic of more anterior tooth loci in other species. Indeed, exaggerating the mean M3 shape of the sample as a whole produces a tooth that is very similar to that of P. anomala (Figure 17).
Classification of Eocene Teeth of Unknown Locus
Of the four teeth of unknown locus from the AMNH collections examined in this analysis, AMNH 28439 is identified as an M3 with strong support, AMNH 28413 is identified as an M2 with strong support, AMNH 28415 is identified as an M1 with strong support in most analyses, and AMNH 28416 is identified as an M2 or, less likely, an M3. Part of this ambiguity with the last specimen may be due to its generalized morphology, which is very similar to sparassodonts such as Patene simpsoni. The gross morphologies of these teeth agree with results of the CVA, specifically in regards to the pattern described above for identifying the locus of a tooth based on the relative width of the stylar shelf at the widest point of the parastylar lobe, metastylar lobe, and midpoint of the tooth. AMNH 28415 has an obliquely-oriented ectal border of the stylar shelf, and the width at the parastylar lobe is narrower than the midpoint, typical of M1s. AMNH 28413 and AMNH 28416 have stylar shelves that are equal in width between the parastylar lobe and midpoint, and there is no pronounced ectoflexus, typical of M2s. AMNH has a parastylar lobe wider than the midpoint of the tooth and a pronounced ectoflexus, typical of M3s.
The other tooth included in this analysis, MPEF-PV 4345, was questionably identified as an M1 by Goin et al. (2010), but our analyses suggest it may be an M2 (p > 0.80 in the three reduced-taxon analyses and the analysis with allometric signal removed) or an M3 (p = 0.65; all-taxon analysis). We consider it more likely that MPEF-PV 4345 represents an M2 for several reasons. First, the posterior probability in the all-taxon analysis (the one suggesting it is an M3) is much lower than for any other analysis. Second, in the plot of the canonical variates scores of the trigon-only dataset MPEF-PV 4345 plots close to the convex hull of M2 in this analysis (it is the unknown tooth outside the boundaries of the convex hull for M2-3 in Figure 11). Finally, the morphology of MPEF-PV 4345 more closely resembles an M2, with the maximum width of the parastylar lobe and the midpoint of the tooth approximately equal (i.e., the ectoflexus is absent).
CONCLUSIONS
The results of our study suggest that CVA can be used to refer isolated sparassodont teeth to locus with relatively high confidence, even if these teeth belong to previously-unknown taxa. It is our hope that this dataset will be a tool that other researchers can use to more precisely identify sparassodont teeth from other sites, especially those collected as isolated teeth without precise positional information via screen-washing or surface collecting (e.g., Antoine et al., 2016; Goin et al., 2007; Suarez, 2019). Although identifying a tooth’s locus using this type of geometric morphometric analysis is more time-intensive than simply assigning a tooth to locus based on qualitative comparisons, the additional time is a worthwhile investment as it greatly reduces the subjectivity of the identification. Additionally, it has the added benefit of being a reproducible result that can bring to light previously-unappreciated quantitative differences between tooth loci. To facilitate the accessibility of our dataset and its use by other investigators, our dataset, the programs used to generate these data (tpsDig, geomorph in R), and the scripts used to run the analysis are all freely available or open access (Appendix 2, Appendix 3, Appendix 4, Appendix 5). Because the code used to perform this study is provided here as an R script and an RMarkdown Document, adding additional unknown specimens to the present dataset and re-running the discriminant analysis merely requires appending the landmark data for the new specimens to the TPS file (Appendix 4), editing the classifiers file (Appendix 5), and re-running the R script (Appendix 2). The utility of this method in sparassodonts suggests it may be applicable to other groups of metatherians (e.g., dasyuromorphians, didelphids, stem Mesozoic or early Cenozoic metatherians), and we encourage other researchers to develop similar datasets for other mammal groups, particularly metatherians, in order to maximize the information that can be gleaned from isolated fossil teeth.
ACKNOWLEDGMENTS
We thank J. Galkin and M.A. O’Leary (AMNH) and F. Anaya (UATF) for access to specimens in their care, M.J. Babot and A. Forasiepi for photographs of Callistoe vincei and Thylacosmilus atrox used to collect morphometric data, respectively, S. Curran and D. Adams for discussion of geometric morphometric methods, M. Zelditch for help in fixing geomorph code that deprecated over the course of this study, R.M.D. Beck for discussions of dental variation within Metatheria, R. McCord (Arizona Museum of Natural History) for loans from the Larry Marshall Marsupial Dentition Collection, and S. Curran and two additional, anonymous reviewers for comments and suggestions that greatly improved this manuscript.
REFERENCES
Adams, D.C., Collyer, M.L., and Kaliontzopoulou, A. 2019. Geomorph: Software for geometric morphometric analyses, Ver. 3.1.0
Antoine, P.-O., Marivaux, L., Croft, D.A., Billet, G., Ganerød, M., Jaramillo, C., Martin, T., Orliac, M.J., Tejada, J., Altamirano, A.J., Duranthon, F., Fanjat, G., Rousse, S., and Gismondi, R.S. 2012. Middle Eocene rodents from Peruvian Amazonia reveal the pattern and timing of caviomorph origins and biogeography. Proceedings of the Royal Society B: Biological Sciences, 279:1319-1326. https://doi.org/10.1098/rspb.2011.1732
Antoine, P.-O., Abello, M.A., Adnet, S., Altamirano Sierra, A.J., Baby, P., Billet, G., Boivin, M., Calderón, Y., Candela, A., Chabain, J., Corfu, F., Croft, D.A., Ganerød, M., Jaramillo, C., Klaus, S., Marivaux, L., Navarrete, R.E., Orliac, M.J., Parra, F., Pérez, M.E., Pujos, F., Rage, J.-C., Ravel, A., Robinet, C., Roddaz, M., Tejada-Lara, J.V., Vélez-Juarbe, J., Wesselingh, F.P., and Salas-Gismondi, R. 2016. A 60-million-year Cenozoic history of western Amazonian ecosystems in Contamana, eastern Peru. Gondwana Research, 31:30-59. https://doi.org/10.1016/j.gr.2015.11.001
Asahara, M., Saito, K., Kishida, T., Takahashi, K., and Bessho, K. 2016. Unique pattern of dietary adaptation in the dentition of Carnivora: its advantage and developmental origin. Proceedings of the Royal Society B: Biological Sciences, 283:20160375. https://doi.org/10.1098/rspb.2016.0375
Babot, M.J., Powell, J.E., and Muizon, C. de. 2002. Callistoe vincei, a new Proborhyaenidae (Borhyaenoidea, Metatheria, Mammalia) from the early Eocene of Argentina. Geobios, 35:615-629. https://doi.org/10.1016/s0016-6995(02)00073-6
Beck, R.M.D. 2013. A peculiar faunivorous metatherian from the early Eocene of Australia. Acta Palaeontologica Polonica, 60:123-130. https://doi.org/10.4202/app.2013.0011
Billet, G., Orliac, M.J., Antoine, P.-O., and Jaramillo, C. 2010. New observations and reinterpretation on the enigmatic taxon Colombitherium (?Pyrotheria, Mammalia) from Colombia. Palaeontology, 53:319-325. https://doi.org/10.1111/j.1475-4983.2010.00936.x
Bond, M., Tejedor, M.F., Campbell Jr., K.E., Chornogubsky, L., Novo, N., and Goin, F. 2015. Eocene primates of South America and the African origins of New World monkeys. Nature, 520:538-541. https://doi.org/10.1038/nature14120
Bookstein, F.L. 1991. Morphometric Tools for Landmark Data: Geometry and Biology. 1st Edition. Cambridge University Press, Cambridge.
Borths, M.R. and Stevens, N.J. 2017. Taxonomic affinities of the enigmatic Prionogale breviceps, early Miocene, Kenya. Historical Biology, 31:784-793. https://doi.org/10.1080/08912963.2017.1393075
Brocklehurst, N. and Benevento, G.L. 2020. Dental characters used in phylogenetic analyses of mammals show higher rates of evolution, but not reduced independence. PeerJ, 8:e8744. https://doi.org/10.7717/peerj.8744
Chemisquy, M.A., Prevosti, F.J., Martin, G.M., and Flores, D.A. 2015. Evolution of molar shape in didelphid marsupials (Marsupialia: Didelphidae): analysis of the influence of ecological factors and phylogenetic legacy. Zoological Journal of the Linnean Society, 173:217-235. https://doi.org/10.1111/zoj.12205
Croft, D.A., Engelman, R.K., Dolgushina, T., and Wesley, G. 2018. Diversity and disparity of sparassodonts (Metatheria) reveal non-analogue nature of ancient South American mammalian carnivore guilds. Proceedings of the Royal Society B: Biological Sciences, 285:20172012. https://doi.org/10.1098/rspb.2017.2012
Crusafont-Pairó, M. and Truyols-Santonja, J. 1956. A biometric study of the evolution of fissiped carnivores. Evolution, 10:314-332. https://doi.org/10.1111/j.1558-5646.1956.tb02855.x
Curran, S.C. 2018. Three-dimensional geometric morphometrics in paleoecology, p. 319-337. In Croft, D.A., Su, D.F., and Simpson, S.W. (eds.), Methods in Paleoecology: Reconstructing Cenozoic Terrestrial Environments and Ecological Communities. Springer Nature, Cham. https://doi.org/10.1007/978-3-319-94265-0_14
Davis, B.M. 2007. A revision of “pediomyid” marsupials from the Late Cretaceous of North America. Acta Palaeontologica Polonica, 52:217-256.
Drake, A.G. and Klingenberg, C.P. 2008. The pace of morphological change: historical transformation of skull shape in St. Bernard dogs. Proceedings of the Royal Society B: Biological Sciences, 275:71-76. https://doi.org/10.1098/rspb.2007.1169
Dunn, R.H. 2018. Functional morphology of the postcranial skeleton, p. 23-36. In Croft, D.A., Su, D.F., and Simpson, S.W. (eds.), Methods in Paleoecology: Reconstructing Cenozoic Terrestrial Environments and Ecological Communities. Springer Nature, Cham. https://doi.org/10.1007/978-3-319-94265-0_3
Engelman, R.K., Flynn, J.J., Wyss, A.R., and Croft, D.A. 2020. Eomakhaira molossus, a new saber-toothed sparassodont (Metatheria: Thylacosmilinae) from the early Oligocene (?Tinguirirican) Cachapoal Locality, Andean Main Range, Chile. American Museum Novitates, 3957:1-75. https://doi.org/10.1206/3957.1
Ercoli, M.D. and Prevosti, F.J. 2011. Estimación de masa de las especies de Sparassodonta (Mammalia, Metatheria) de edad Santacrucense (Mioceno temprano) a partir del tamaño del centroide de los elementos apendiculares: inferencias paleoecológicas. Ameghiniana, 48:462-479. https://doi.org/10.5710/AMGH.v48i4(347)
Forasiepi, A.M. 2009. Osteology of Arctodictis sinclairi (Mammalia, Metatheria, Sparassodonta) and phylogeny of Cenozoic metatherian carnivores from South America. Monografías del Museo Argentino de Ciencias Naturales, 6:1-174.
Forasiepi, A.M. and Carlini, A.A. 2010. A new thylacosmilid (Mammalia, Metatheria, Sparassodonta) from the Miocene of Patagonia, Argentina. Zootaxa, 2552:55-68. https://doi.org/10.11646/zootaxa.2552.1.3
Forasiepi, A.M., Goin, F.J., and di Martino, V. 2003. Una nueva especie de Lycopsis (Metatheria, Prothylacyninae) de la Formación Arroyo Chasicó (Mioceno Tardío) de la provincia de Buenos Aires. Ameghiniana, 40:249-253.
Forasiepi, A.M., Babot, M.J., and Zimicz, N. 2015. Australohyaena antiqua (Mammalia, Metatheria, Sparassodonta), a large predator from the late Oligocene of Patagonia. Journal of Systematic Palaeontology, 13:505-523. https://doi.org/10.1080/14772019.2014.926403
Goin, F.J. 2003. Early marsupial radiations in South America, p. 30-42. In Jones, M., Dickman, C., and Archer, M. (eds.), Predators with Pouches: the Biology of Marsupial Carnivores. CSIRO Publishing, Collingwood.
Goin, F.J., Abello, A., Bellosi, E., Kay, R., Madden, R., and Carlini, A. 2007. Los Metatheria sudamericanos de comienzos del Neógeno (Mioceno Temprano, Edad-mamífero Colhuehuapense). Parte I: Introducción, Didelphimorphia y Sparassodonta. Ameghiniana, 44:29-71.
Goin, F.J., Abello, M.A., and Chornogubsky, L. 2010. Middle Tertiary marsupials from central Patagonia (early Oligocene of Gran Barranca): understanding South America's Grande Coupure, p. 69-105. In Madden, R.H., Carlini, A.A., Vucetich, M.G., and Kay, R.F. (eds.), The Paleontology of Gran Barranca. Evolution and Environmental Change through the Middle Cenozoic of Patagonia. Cambridge University Press, Cambridge.
Goin, F.J., Vieytes, E.C., Gelfo, J.N., Chornogubsky, L., Zimicz, A.N., and Reguero, M.A. 2020. New metatherian mammal from the early Eocene of Antarctica. Journal of Mammalian Evolution 27:17-36. https://doi.org/10.1007/s10914-018-9449-6
Gordon, C.L. 2003. A first look at estimating body size in dentally conservative marsupials. Journal of Mammalian Evolution, 10:1-21. https://doi.org/10.1023/A:1025545023221
Gunz, P., Mitteroecker, P., Neubauer, S., Weber, G.W., and Bookstein, F.L. 2009. Principles for the virtual reconstruction of hominin crania. Journal of Human Evolution, 57:48-62. https://doi.org/10.1016/j.jhevol.2009.04.004
Hoffstetter, R. and Petter, G. 1983. Paraborhyaena boliviana et Andinogale sallensis, deux Marsupiaux (Borhyaenidae) nouveaux de Déséadien (Oligocène inférieur) de Salla (Bolivie). Comptes Rendus de l’Académie des Sciences, Paris, Série 3, 296:143-146.
Kielan-Jaworowska, Z., Cifelli, E.M., and Luo, Z.X. 2004. Mammals from the Age of Dinosaurs: Origins, Evolution, and Structure. Columbia University Press, New York
Kovarovic, K., Aiello, L.C., Cardini, A., and Lockwood, C.A. 2011. Discriminant function analyses in archaeology: are classification rates too good to be true? Journal of Archaeological Science, 38:3006-3018. https://doi.org/10.1016/j.jas.2011.06.028
Marshall, L.G. 1976. A new borhyaenid (Marsupialia, Borhyaeninae) from the Arroyo Chasicó Formation (lower Pliocene), Buenos Aires Province, Argentina. Ameghiniana, 13:289-299.
Marshall, L.G. 1979. Review of the Prothylacyninae, an extinct subfamily of South American “dog-like” marsupials. Fieldiana Geology, new series, 3:1-49. https://doi.org/10.5962/bhl.title.3324
Marshall, L.G. 1981. Review of the Hathlyacyninae, an extinct subfamily of South American “dog-like” marsupials. Fieldiana Geology, new series, 7:1-120. https://doi.org/10.5962/bhl.title.3520
Marshall, L.G. 1982. Systematics of the South American marsupial family Microbiotheriidae. Fieldiana Geology, new series, 10:1-75. https://doi.org/10.5962/bhl.title.3420
Martin, G.M. and Tejedor, M.F. 2007. Nueva especie de Pseudonotictis Ameghino (Metatheria, Sparassodonta, Hathliacynidae) del Mioceno medio de Chubut noroccidental, Argentina. Ameghiniana, 44:747-750.
Muizon, C., de 1998. Mayulestes ferox, a borhyaenoid (Metatheria, Mammalia) from the early Palaeocene of Bolivia. phylogenetic and paleobiologic implications. Geodiversitas, 20:19-142.
Muizon, C., de 1999. Marsupials skulls from the Deseadan (late Oligocene) of Bolivia and phylogenetic analysis of the Borhyaenoidea (Marsupialia, Mammalia). Geobios, 32:483-509. https://doi.org/10.1016/S0016-6995(99)80022-9
Muizon, C., de, Ladevèze, S., Selva, C., Vignaud, R., and Goussad, F. 2018. Allqokirus australis (Sparassodonta, Metatheria) from the early Paleocene of Tiupampa (Bolivia) and the rise of the metatherian carnivorous radiation in South America. Geodiversitas, 40:363-459. https://doi.org/10.5252/geodiversitas2018v40a16
Muizon, C., de and Lange-Badré, B. 1997. Carnivorous dental adaptations in tribosphenic mammals and phylogenetic reconstruction. Lethaia, 30:353-366. https://doi.org/10.1111/j.1502-3931.1997.tb00481.x
Naylor, G.J.P. and Marcus, L.F. 1994. Identifying isolated shark teeth of the genus Carcharhinus to species: Relevance for tracking phyletic change through the fossil record. American Museum Novitates, 3109:1-53. https://digitallibrary.amnh.org/handle/2246/4942
Petter, G. and Hoffstetter, R. 1983. Les marsupiaux du Déséadien (Oligocène inférieur) de Salla (Bolivie). Annales de Paléontologie, 69:175-234.
Powell, J.E., Babot, M.J., García-López, D.A., Deraco, M.V., and Herrera, C. 2011. Eocene vertebrates of northwestern Argentina: annotated list, p. 349-370. In Salfity, J.A. and Marquillas, R.A. (eds.), Cenozoic Geology of the Central Andes of Argentina. SCS Publisher, Salta.
Prevosti, F.J., Forasiepi, A., and Zimicz, N. 2013. The evolution of the Cenozoic terrestrial mammal guild in South America: competition or replacement? Journal of Mammalian Evolution, 20:3-21. https://doi.org/10.1007/s10914-011-9175-9
R Core Team 2020. R: A Language and Environment for Statistical Computing, Ver. 4.0.3. R Foundation for Statistical Computing, Vienna, Austria.
Rangel, C.C., Carneiro, L.M., Bergqvist, L.P., Oliveira, É.V., Goin, F.J., and Babot, M.J. 2018. Diversity, affinities, and adaptations of the South American basal sparassodont Patene Simpson, 1935 (Mammalia, Metatheria). Ameghiniana, 56:263-289. https://doi.org/10.5710/AMGH.06.05.2019.3222
Reig, O.A. 1957. Nota previa sobre los marsupiales de la formación Chasicó. Ameghiniana, 1:27-31.
Reig, O.A., Kirsch, J.A.W., and Marshall, L.G. 1987. Systematic relationships of the living and Neocenozoic American “opossum-like” marsupials (suborder Didelphimorphia), with comments on the classification of these and of the Cretaceous and Paleogene New World and European metatherians, p. 1-89. In Archer, M. (ed.), Possums and Opossums: Studies in Evolution, Vol. I. Surrey Beatty and Sons in association with the Royal Zoological Society of New South Wales, Chipping Norton.
Rohlf, F.J. 2017. tpsDig. Department of Ecology and Evolution, State University of New York at Stony Brook, Stony Brook, NY.
Rohlf, F.J. 2018. tpsUtil. Department of Ecology and Evolution, State University of New York at Stony Brook, Stony Brook, NY.
Rose, K.D. 2006. The Beginning of the Age of Mammals. The John Hopkins University Press, Baltimore.
Sansom, R.S., Wills, M.A., and Williams, T. 2017. Dental data perform relatively poorly in reconstructing mammal phylogenies: morphological partitions evaluated with molecular benchmarks. Systematic Biology, 66:813-822. https://doi.org/10.1093/sysbio/syw116
Schlager, S. 2017. Morpho and Rvcg - Shape analysis in R: R-packages for geometric morphometrics, shape analysis and surface manipulations, p. 217-256. In Zheng, G., Li, S., and Székely, G. (eds.), Statistical Shape and Deformation Analysis. Academic Press. https://doi.org/10.1016/B978-0-12-810493-4.00011-0
Sheets, H.D., Covino, K.M., Panasiewicz, J.M., and Morris, S.R. 2006. Comparison of geometric morphometric outline methods in the discrimination of age-related differences in feather shape. Frontiers in Zoology, 3:15. https://doi.org/10.1186/1742-9994-3-15
Shockey, B.J. and Anaya, F. 2008. Postcranial osteology of mammals from Salla, Bolivia (late Oligocene): form, function, and phylogenetic implications, p. 135-157. In Sargis, E.J. and Dagosto, M. (eds.), Mammalian Evolutionary Morphology: A Tribute to Frederick S. Szalay. Springer, New York. https://doi.org/10.1007/978-1-4020-6997-0_7
Solé, F. and Ladevèze, S. 2017. Evolution of the hypercarnivorous dentition in mammals (Metatheria, Eutheria) and its bearing on the development of tribosphenic molars. Evolution & Development, 19:56-68. https://doi.org/10.1111/ede.12219
Solow, A.R. 1990. A randomization test for misclassification probability in discriminant analysis. Ecology, 71:2379-2382. https://doi.org/10.2307/1938650
Suarez, C. 2019. Estudios taxonómicos y paleobiológicos sobre los Metatheria (Mammalia) del Mioceno medio de La Venta, Colombia. PhD thesis. Universidad Nacional de La Plata, La Plata.
Suarez, C., Forasiepi, A.M., Goin, F.J., and Jaramillo, C. 2016. Insights into the Neotropics prior to the Great American Biotic Interchange: new evidence of mammalian predators from the Miocene of northern Colombia. Journal of Vertebrate Paleontology, 36:e1029581. https://doi.org/10.1080/02724634.2015.1029581
Thomson, M. and Curran, S.C. 2013. Not by size alone: Investigations of shape, allometry, and phylogeny in cervid ecomorphology. Journal of Vertebrate Paleontology, Program and Abstracts, 2013, p. 225.
Ungar, P.S. 2010. Mammal Teeth: Origin, Evolution, and Diversity. John Hopkins University Press, Baltimore. https://doi.org/10.1353/book.485
Van Valen, L. 1969. Evolution of dental growth and adaptation in mammalian carnivores. Evolution, 23:96-117. https://doi.org/10.2307/2406487
Van Valkenburgh, B. 1991. Iterative evolution of hypercarnivory in canids (Mammalia: Carnivora): evolutionary interactions among sympatric predators. Paleobiology, 17:340-362. https://doi.org/10.1017/S0094837300010691
Venables, W.N. and Ripley, B.D. 2002. Modern Applied Statistics with S, 4th edition. Springer, New York. https://doi.org/10.1007/978-0-387-21706-2
Werdelin, L. 1987. Jaw geometry and molar morphology in marsupial carnivores; analysis of a constraint and its macroevolutionary consequences. Paleobiology, 13:342-350. https://doi.org/10.1017/S0094837300008915
Wesley-Hunt, G.D. 2005. The morphological diversification of carnivores in North America. Paleobiology, 31:35-55. https://doi.org/10.1666/0094-8373(2005)031<0035:TMDOCI>2.0.CO;2
Williamson, T.E., Brusatte, S.L., and Wilson, G.P. 2014. The origin and early evolution of metatherian mammals: the Cretaceous record. ZooKeys, 465:1-76. https://doi.org/10.3897/zookeys.465.8178
Wilson, G.P. 2013. Mammals across the K/Pg boundary in northeastern Montana, U.S.A.: dental morphology and body-size patterns reveal extinction selectivity and immigrant-fueled ecospace filling. Paleobiology, 39:429-469. https://doi.org/10.1666/12041
Zack, S.P. 2012. Deciduous dentition of Didymictis (Carnivoramorpha: Viverravidae): implications for the first appearance of “Creodonta”. Journal of Mammalogy, 93:808-817. https://doi.org/10.1644/11-MAMM-A-245.1
Zelditch, M.L., Swiderski, D.L., and Sheets, H.D. 2012. Geometric Morphometrics for Biologists: A Primer, 2nd edition. Elsevier, Amsterdam.
Zimicz, A.N. 2012. Ecomorfología de los marsupiales paleógenos de América del Sur. PhD thesis, Universidad Nacional de La Plata, La Plata.
