

 A fossil locality predictive model using weighted suitability analysis for the Early Cretaceous Cedar Mountain Formation, Utah, USA
Article number: 26.3.a43
https://doi.org/10.26879/1130
Copyright Paleontological Society, October 2023
Author biography
Plain-language and multi-lingual abstracts
PDF version
Submission: 22 September 2020. Acceptance: 22 August 2023.
ABSTRACT
Hard work and chance are nearly always among the deciding factors in finding new, important, and productive paleontological localities. Fossil locality predictive models have the potential to maximize field time and increase chances to find important localities. This study uses remotely sensed data to design and test a fossil locality predictive model for the Early Cretaceous Cedar Mountain Formation. Landsat 8 OLI/TIRS data from known localities were summarized, reclassified, and used in a weighted suitability analysis to categorize fossil locality potential of the study area. Field work was conducted to test model functionality. Field observations were used to refine the weighted suitability analysis. Landsat 8 OLI/TIRS data alone offers a less accurate prescription of fossil locality potential. Additional physical and environmental factors play a role in determining the chance of finding fossils. Slope degree and aspect data from known localities were summarized and analyzed to further refine the model. Forty percent of existing fossil localities within the final model boundaries were located on areas having the highest fossil locality potential as identified by the model. The usefulness of fossil locality predictive models is dependent upon the quality of input data and methods used to determine fossil locality potential. To fully determine the quality of a fossil locality predictive model, field testing is ideal.
Daniel A. Burk. 1557 Sophie Ln, Escalon, California 95320 USA. daniel.a.burk@gmail.com
Keywords: Cedar Mountain Formation; GIS; predictive model; Landsat 8; remote sensing; weighted suitability analysis
Final citation: Burk, Daniel A. 2023. A fossil locality predictive model using weighted suitability analysis for the Early Cretaceous Cedar Mountain Formation, Utah, USA. Palaeontologia Electronica, 26(3):a43.
https://doi.org/10.26879/1130
palaeo-electronica.org/content/2023/3967-cedar-mtn-fm-predictive-model
Copyright: October 2023 Paleontological Society.
This is an open access article distributed under the terms of Attribution-NonCommercial-ShareAlike 4.0 International (CC BY-NC-SA 4.0), which permits users to copy and redistribute the material in any medium or format, provided it is not used for commercial purposes and the original author and source are credited, with indications if any changes are made.
creativecommons.org/licenses/by-nc-sa/4.0/
INTRODUCTION
Terminology
Digital Elevation Model: A raster dataset where pixel values represent elevation.
Geographic Information Systems (GIS): a system of hardware, software, methods, and users designed to record, store, manage, and analyze geographic data.
Landsat 8 Operational Land Imager / Thermal InfraRed Sensor: satellite-based sensor which provides imagery from nine Operational Land Imager (OLI) bands at 30 m resolution from 0.433 µm and 1.390 µm and two Thermal Infrared Sensor (TIRS) bands at 100 m resolution from 10.3 µm and 12.5 µm.
Raster: a geographic dataset consisting of a grid of regularly sized square pixels with individual values.
Remote Sensing: a method of gathering geographic data by scanning the surface of the earth from aerial or satellite-based capture systems.
Vector: a geographic data type comprised of a collection of points, lines, and polygons with associated attribute data.
Study Rationale
GIS is a powerful tool in solving problems and innovation in the study of paleontology. Paleontologists are awakening to the statement issued over three decades ago; “remote sensing data provide geologic information of critical value to vertebrate paleontology” (Stucky and Krishtalka, 1991, p. 75). GIS is a necessary tool for paleontologists and should be used in more robust ways beyond mapping or data storage.
Finding fossils in the field often consists of researchers wandering around in deserted and remote areas hoping to discover something using only topographic and geological maps, personal experience, and intuition, "many, perhaps most, new fossil localities are literally stumbled upon" (Anemone et al., 2011, p. 169). Much valuable field time is wasted with fruitless searching. GIS and remote sensing technologies have advanced rapidly in the past few decades (Klinkenberg, 1997). Availability of geospatial data is increasing and governmental institutions such as the USGS and NASA are offering their data at no cost to the user. At the time of this study (mid 2013), Landsat 8 OLI/TIRS data had not yet been tested for its fossil locality modeling and prediction capabilities.
This study assesses the effectiveness of using remotely sensed Landsat 8 (OLI/TIRS) spectral data for finding fossil localities in the Early Cretaceous Cedar Mountain Formation of Utah. The Cedar Mountain Formation records a faunal shift in North America from more European-like dinosaurs to more Asian-like dinosaurs during global climate change at the end of the Early Cretaceous when the local environment was getting progressively wetter (Kirkland et al., 1999). Several studies regarding GIS and its predictive modeling capabilities have reported success in identifying areas of potentially higher paleontological productivity (Oheim, 2007; Malakhov et al., 2009; Egeland et al., 2010; Conroy et al., 2012; Emerson and Anemone, 2012; Emerson et al., 2015; Conroy et al., 2018; Wills et al., 2018; Coelho et al., 2021; Ghezzo et al., 2023). Predictive models are not assumed to be perfect representations, nor will they accurately predict potential fossil localities every time. However, they are valuable tools for more effective allocation of resources. This study represents a portion of the author’s master’s thesis research completed in 2014.
Literature Review
Geologists have long identified the tools provided by remote sensing as important to geological mapping in remote areas (Stucky and Krishtalka, 1991). Likewise, archaeologists and paleoanthropologists have utilized remote sensing as a tool for narrowing down potential prospecting sites (WoldeGabriel et al., 1992). In contrast, comparatively few vertebrate paleontologists have embraced the combination of technologies found in remote sensing and GIS to create predictive models. However, several important studies have been conducted in various parts of the world demonstrating the utility of GIS predictive models in remote prospecting for fossils. These studies fall into two distinct but related approaches to creating predictive models. They either use a GIS only based approach or combine GIS tools with remotely sensed data.
In a GIS only approach, Oheim (2007) described a suitability analysis conducted to find new paleontological localities in the Cretaceous Two Medicine Formation of Montana, USA. The Two Medicine Formation is a relatively flat-lying geological formation without extensive folding or faults, has low human population, and the land encompassed is primarily used for grazing. All these factors contribute to the satisfactory use of the formation for predictive modeling. Four variables were used in the analysis: geology, elevation, vegetation cover, and distance to roads. All data was rasterized, reclassified, weighted, and summed. By field testing the model and performing further analysis, Oheim (2007) was able to accurately predict areas with high, medium, and low fossil potential. Thirty-one new fossil localities were found because of this analysis.
Malakhov et al. (2009) showed how remotely prospecting a large field area can be done efficiently and at low cost with Landsat 7 ETM+ data. They cataloged the spectral characteristics of the sedimentary rocks in their field area which allowed them to easily identify the locations of potentially fossiliferous strata for future on the ground prospecting. In contrast to previous studies, they did not have a complete database of environmental factors for their study area; however, they successfully searched for fossils using their remote approach in the Lower Syrdarya Uplift in southern Kazakhstan.
In another GIS only based approach, Egeland et al. (2010) used a cost path analysis in their predictive model to discover 25 new paleoanthropological sites in Armenia. Cost path analysis is a digital tool using raster data to determine the least cost path between two points where cost is defined by the underlying raster values. Their cost path analysis used DEMs to determine the least cost route which early Pleistocene hominids may have taken while dispersing from Africa to Eurasia represented by sites in ‘Ubediya, Israel and Dmanisi, Armenia. Relevant data sources for input in the model included vegetation, distance to water, and topographic setting. To narrow down search areas, they found the least cost path from the nearest paleoanthropological locality in the Levant to known localities in Dmanisi. They found that the Debed River valley of northeastern Armenia was the closest area within "the high potential dispersal region (as determined by the cost path analysis)" (Egeland et al., 2010, p. 92) which preserves alluvial, lacustrine, and datable volcanic deposits which are considered necessary for paleoanthropological sites. There were also no known paleoanthropological sites in the area due to the lack of prior paleoanthropological work. Criteria for creating three suitability categories were slope, aspect, elevation, land cover, and proximity to rivers. They affirmed that "remote GIS predictive modeling, while providing a useful guide for site identification, is no substitute for (and can be modified by) on-the-ground experience" (Egeland et al., 2010, p. 96) because, through their ground truthing reconnaissance, one of the sites they found was within their lowest potential category.
Conroy et al. (2012) used a spectral signature model and the spatial analysis and image classification functions of ArcGIS 10 to create interactive land cover maps of their study area. Their targets were the Eocene sedimentary rock formations of the Uinta Basin, Utah. The model used Landsat 7 Enhanced Thematic Mapper Plus (ETM+) imagery and "trained" algorithms using the spectral signatures of known fossil localities found prior to 2005. Six land cover classifications relevant to the study area were determined and included in the analysis. They consisted of fossil localities, oil/gas field infrastructure, water, agriculture, scrub/tree cover, and steep slopes. The algorithms were then used to find other areas with a >98% probability of having the same spectral signatures as their "fossil localities" land cover class as well as being mapped as Eocene sediment on geologic maps. The model identified several "hot spots" with high potential where fossils had not been found prior to 2005. "Post-hoc" validation of hot spots found fossils in all regions predicted by the model.
Emerson and Anemone (2012) used a neural network classifier which successfully identified Eocene vertebrate fossil sites in the Great Divide Basin, Wyoming. Using Landsat 7 ETM+ imagery they took spectral signatures of known fossil localities to identify potentially productive sites. National Land Cover Data was used isolate barren ground and scrubland, land cover types ideally suited for finding fossils due to the lack of obscuring vegetation. A digital elevation model (DEM) mask of areas with slope greater than 5% was applied over the classification because 80% of existing localities were located on areas of at least moderate slope. The results highlighted several areas of interest previously unexplored by the team.
In a follow-up study, Emerson et al. (2015) applied Geographic Object Based Image Analysis (GEOBIA) to high resolution Quickbird and Landsat 8 OLI imagery. GEOBIA looks at raster data in terms of objects (areas of similarity) as the base unit rather than pixels. They then included the slope and surface geology of a highly productive Eocene vertebrate fossil locality to identify similar areas in the Great Divide Basin, Wyoming. They used the model to identify twenty-six locations not visible from roads. Eighteen were fossiliferous, fourteen of which were correctly identified by the model. The GEOBIA model was applied to the entire Great Divide Basin which correctly identified six new localities in a previously unsurveyed area.
The same research team later performed two case studies using unsupervised image classification using an iterative self-organizing cluster tool in the Great Divide and Bighorn Basins of Wyoming, USA (Conroy et al., 2018). In both test cases Landsat 8 data was pan-sharpened to 15m x 15m pixels and the algorithms had no a priori knowledge of the physical characteristics of the test areas. In the Great Divide Basin case study clusters of similar spectral reflectance were identified, then compared to known fossil localities. An area in the southwestern part of the Great Divide Basin with no known localities and no clusters matching fossil localities was prospected with few rock outcrops and no fossils found. An area with clusters matching fossil localities was also prospected by field paleontologists who had no prior knowledge of the existence of the predictive maps. Most of the sites they found were in the areas predicted by the model. In the Bighorn Basin case study, the location of one fossil locality “seed” was given to the algorithm to identify clusters of similar spectral reflectance. Known sites were then superimposed back onto the resulting data with 50% being located on identified clusters. Most of the rest of the known localities were within one pixel of the identified clusters as well. The model represented a 67% reduction in potential search area.
In another GIS based approach, Wills et al. (2018) developed a user independent method incorporating principal coordinate analysis (PCO) and linear discriminant analysis (LDA) and tested it in the Elliot Formation (Upper Triassic-Lower Jurassic) of Free State, South Africa. They converted environmental datasets for vegetation, land cover, elevation, slope, aspect, and drainage density to 250m x 250m raster layers. Using PCO, they classified the environmental characteristics of the mapped extent of the Elliot Formation. The resultant PCO scores were used as input to the LDA with 81 known fossil localities as a training set. Significant clustering of potential sites was refined via GIS hotspot analysis. Their model reduced prospective search areas by 74% and correctly predicted 95% of known localities. Field testing identified two new fossil localities.
Coelho et al. (2021) used an unsupervised k -means method to identify clusters in satellite images of the Urema Rift in Gorongoza National Park, Mozambique. The model was run without a prior knowledge of the area’s geology, stratigraphy, topography or land cover. Clusters identified represented 4.49% of the total analyzed area. Their methods proved to be 84.6% accurate and identified four new sites. Using the random forest algorithm, they also tested individual spectral bands for clustering. The near-infrared band was the most important variable in this study for fossil site detection. The k -means algorithm is a relatively simple one and proved to be a viable first step in remotely identifying sites in a relatively unexplored field area. Identifying clusters worked well in the densely vegetated area but may not work as well without other constraining variables where there is more rock exposure.
In the most recent study Ghezzo et al. (2023) used WorldView 2 imagery to detect large individual fossil logs in Petrified Forest National Park, Arizona, USA. They compared an unsupervised ISODATA method and two supervised methods, maximum likelihood and spectral angle mapper, to evaluate which was better at distinguishing the optical signature of large individual fossils. Overall, the supervised methods performed better. When the results of the spectral angle mapper method were vectorized into polygons and buffered to simulate the walking visibility of field crews, it was able to identify 92.7% of true logs. They suggest that repeatedly applying these methods over time to paleontological heritage localities with large fossils can help with remote monitoring.
At the time of this study (2013), no published predictive models had been conducted in the Cedar Mountain Formation. The success of previous studies is promising for future studies, provided that the input parameters are properly selected. Predictive models are not assumed to be perfect representations, nor will they accurately predict potential fossil localities all the time. However, they are valuable tools for more effective allocation of resources especially in remote field areas.
Paleontological and Geological Background
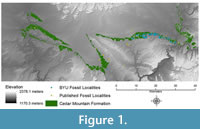 The Early Cretaceous Cedar Mountain Formation of Utah is a fossil rich geological formation of critical importance for understanding the terrestrial fauna change from the Late Jurassic to the Late Cretaceous in North America. Stratigraphically it unconformably overlays the Late Jurassic Brushy Basin Member of the Morrison Formation and is in turn unconformably overlain by the Late Cretaceous Dakota Sandstone. Figure 1 shows the surface extent of the Cedar Mountain Formation within the study area. The Cedar Mountain Formation records a climatic shift from arid and semi-arid conditions to progressively more humid conditions (Garrison et al., 2007). Rocks in the Cedar Mountain Formation were deposited in fluvial, lacustrine, and littoral environments about 127-98 million years ago (Kirkland et al., 1999). Rock types in the Cedar Mountain Formation include conglomerate, mudstone, sandstone, limestone, paleosols, local lignite coal deposits, and ash beds. Early Cretaceous terrestrial sediments are relatively rare in North America so the Cedar Mountain Formation is exceptional in its potential to reveal the details of climate and faunal change (Kirkland et al., 1999).
From oldest to youngest, the five members of the Cedar Mountain Formation are: the Buckhorn Conglomerate, consisting of pebble-cobble conglomerate, sandstone, and minor mudstone, deposited in a braided fluvial environment (Currie, 1997); the Yellow Cat Member, a low-energy, fluvial environment, consisting of carbonates, sandstones, and claystones; the Poison Strip Sandstone, representing a large meandering river system consisting mostly of cross-bedded, cliff-forming sandstone; the Ruby Ranch Member, consisting of variegated mudstones with abundant carbonate nodules with minor sandstone and limestone beds, deposited in a semi-arid, low-energy, fluvial environment (Kirkland et al., 1997); and the Mussentuchit Member, consisting primarily of smectitic mudstones deposited in a significantly wetter environment heavily influenced by nearby volcanism. The Yellow Cat, Ruby Ranch, and Mussentuchit Members have produced most of the vertebrate fossils from the formation. Comparatively few fossils have been found from the Poison Strip Sandstone while the Buckhorn Conglomerate has failed to produce fossils (Kirkland et al., 1999).
Research projects by several institutions including the Utah State University Eastern, the Utah Geologic Survey, Brigham Young University, Dinosaur National Monument, the University of Kansas, and the University of Colorado have revealed significant dinosaur fossils including Gastonia, Utahraptor ostrommaysorum, cf. Acrocanthosaurus sp., Tenontosaurus sp., Eolambia caroljonesa, Alamosaurus, Falcarius utahensis, and Iguanodon ottingeri (Kirkland et al., 1999, 2005; Kirkland, 2005). Non-dinosaur taxa are represented in the Cedar Mountain Formation by the marsupial Kokopelia, fish, turtles, crocodilians, and other reptiles (Kirkland et al., 1999; Kirkland, 2005). Research in the Cedar Mountain Formation is ongoing and new taxa are continually being found and described such as the dromaeosaurid Yurgovuchia doellingi (Senter et al., 2012a), the theropod Martharaptor greenriverensis (Senter et al., 2012b), the nodosaurid ankylosaur Animantarx ramaljonesi (Carpenter et al, 2008), the iguanadonts Iguanacolossus fortis and Hippodraco scutodens (McDonald et al., 2010), the sauropod Brontomerus mcintoshi (Taylor et al., 2011), and an unnamed choristodere (Britt et al., 2006).
Since the outcrops of the Cedar Mountain Formation are exposed over a wide area covering several counties of northeastern and southeastern Utah, the study area will be limited to those exposures in the Moab 30' x 60' (1:100,000 scale) quadrangle, which covers portions of Grand and Emery Counties. This area has an arid to semi-arid environment, low population, and contains the city of Moab and Arches National Park.
CONCEPTUAL FRAMEWORK AND METHODOLOGY
Data Sources
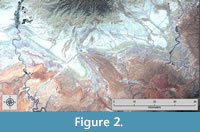 Landsat 8 OLI/TIRS Imagery. Landsat 8 OLI/TIRS imagery covering the study area (Figure 2) was obtained from the USGS EarthExplorer website (earthexplorer.usgs.gov). The selected scene is LC80360332013162LGN00, Path 36, Row 33 taken June 11, 2013. This scene was chosen because it covers the entire field area, was the most recent daytime scene available at the time of download (July 20, 2013), has no snow cover, and has only 0.02% cloud cover none of which was over the Cedar Mountain Formation.
Geologic Map. Geologic data on Cedar Mountain Formation surface exposure comes from the associated vector GIS data for Doelling (2002), which was downloaded from the Utah Geological Survey (UGS) Geologic Map Portal website (https://geology.utah.gov/apps/intgeomap/). The 1:100,000 scale map covers the Moab 30’x60’ quadrangle and the eastern portion of the San Rafael Desert 30’x60’ quadrangle. Data for the map was compiled from a variety of previously published sources, interpreted through aerial photography, and gathered from surface reconnaissance mapping surveys.
Existing Fossil Localities. A dataset of 98 Cedar Mountain Formation fossil localities with reliable geospatial locations and containing identifiable bone was provided by the Brigham Young University (BYU) Museum of Paleontology (see Figure 1). Fossil localities were found by BYU staff via ground reconnaissance surveys. They recorded GPS data for each locality using a handheld Garmin Montana 650t GPS receiver set to the WGS84 geographic datum. Horizontal coordinate accuracy was between two and three meters. Data was provided in a digital spreadsheet, which was converted into a point shapefile.
Spatial data regarding fossil localities described in published literature was obtained from the Paleobiology Database (paleobiodb.org). The Paleobiology Database is a non-governmental, non-profit online resource containing paleobiological taxonomic, geospatial, and reference data aggregated by numerous member researchers working from a variety of institutions (Alroy and Uhen, 2013). Geospatial data was available for ten published Cedar Mountain Formation localities (see Figure 1). References describing fossil localities include Bodily (1969), Carpenter et al. (1999), Galton and Jensen (1978), Gilpin et al. (2007), Kirkland et al. (1998), Kirkland and Madsen (2007), McDonald et al. (2010), Santucci and Kirkland (2010), Senter et al. (2012a), and Taylor et al. (2011). Geospatial data does not necessarily come directly from the publications but can be submitted to Paleobiology Database by member researchers.
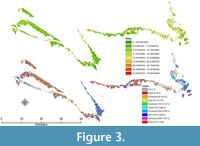 Digital Elevation Model (DEM). Auto-correlated 5-meter resolution DEM data were obtained for the field area from the Utah Automated Geographic Reference Center (gis.utah.gov/data). The data was created from aerial photography collected during the 2006 National Agriculture Imagery Program. It is of a finer resolution but contains anomalies not seen in datasets developed by other methods such as LiDAR, photogrammetry, or radar (Kelson, 2007). The DEM data is available in 20,000 by 20,000 meter blocks across the entire state of Utah as ASCII files. Ten individual adjacent ASCII files were needed to cover the entire field area. The ASCII datasets were converted to Esri GRIDs, then combined into a single raster mosaic in a file geodatabase (see Figure 1). Slope and aspect data for the Cedar Mountain Formation were extracted from the DEM (see Figure 3).
Research Methodology
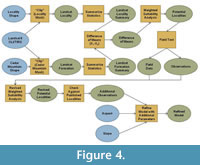 Overview. Statistics regarding spectral reflectance for the BYU fossil localities and the Cedar Mountain Formation were summarized, and differences of means were compared. A weighted suitability analysis using differences of means was conducted to determine fossil locality potential for the Cedar Mountain Formation. The model was field tested, and observations were made regarding model functionality. Field observations were used to revise the model. Model results were compared to published fossil localities. Slope and aspect data were combined with additional observations to further refine the model. Figure 4 illustrates a simplified flowchart of the methodology.
Summary of Fossil Locality Spectral Reflectance. The spectral reflectances of the BYU fossil localities were summarized to establish the spectral signature of fossil localities (see Table 1). The spectral reflectances of the entire Cedar Mountain Formation as mapped by Doelling (2002) were also summarized for comparison to the fossil localities (see Table 2).
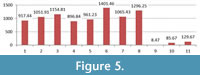 These summaries were used to identify which OLI/TIRS bands have narrower spectral signatures at known fossil localities when compared to the spectral signatures of the entire Cedar Mountain Formation. Figure 5 shows the difference of means from values in Table 1 and Table 2. The difference of means for each band is calculated by subtracting the mean of the localities (X1) from the mean of the entire Cedar Mountain Formation (X2). A low difference of means indicates that there is little difference in spectral signature between the localities and the background whereas a high difference of means indicates a greater difference in spectral signature. Bands with higher difference of means suggest greater utility for subsequent analysis.
Bands 8 and 9 were removed from subsequent analysis. Band 8 is the panchromatic band, which detects wavelengths that span bands 2-4, the visible light bands. It is usually reserved for pansharpening, a process which increases visual resolution in these bands for production of higher quality images. Band 9 is primarily used for detection of cloud cover. This study is not concerned with cloud cover, and the OLI/TIRS imagery was specifically chosen for its lack thereof.
 Weighted Suitability Analysis. The nine remaining OLI/TIRS bands were reclassified for the weighted suitability analysis. The analysis mask was set to the extent of the Cedar Mountain Formation to exclude areas outside its mapped extent. Values outside the
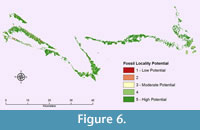
 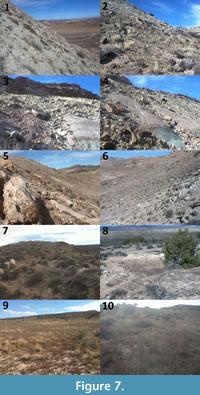 range present in the localities were given a reclassified value of one and values inside the range present in the localities were given a reclassified value of five. Table 3 shows the reclassified values for each band. Weights were assigned by comparing the difference of means of each band to the sum of the differences of means of the nine remaining bands. A percentage of how much influence each band had on the sum of the differences of means was used to determine its weight in the suitability analysis. Table 4 contains the weights given to each band. Figure 6 contains the results of the weighted suitability analysis. The reclassified cell values of each band were multiplied by the corresponding weight, then summed to produce the suitability analysis results. Each cell was given a Fossil Locality Potential (FLP) between 1 (Low Potential) and 5 (High Potential).
Field Test of Model. Ten sample FLP-5 sites were chosen to field test the predictive value of the model. Sites were chosen to be within a short distance from roads for good driving access in areas where there were no known BYU localities. Each site was 30m x 30m corresponding to a single pixel from the model. Ground surveys of the sites were conducted by walking transects over the entire surface area of each site and visually inspecting it for signs of fossils. Geological and paleontological data were gathered from each site (see Table 5) including descriptions of rock types present, fossils found (if any), and which member of the Cedar Mountain Formation on which the site occurs. Photographs were taken of each site (see Figure 7). Observations regarding model functionality were recorded.
RESULTS AND DISCUSSION
Problems with Initial Model
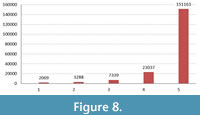 It can be seen in Figure 6 that most of the Cedar Mountain Formation is given FLP-5 with only minor numbers of cells in any of the other categories. Figure 8 is a histogram presenting the numbers of cells in each fossil potential category. There is a heavy negative skew with nearly 81% of cells receiving FLP-5. It appears that the parameters of the model are too inclusive and not robust enough to distinguish finer differences between fossil localities and the Cedar Mountain Formation as a whole. To ameliorate this problem, further revisions to the model would require a more exclusive reclassification scheme for the OLI/TIRS bands.
During field work, several additional observations were made regarding model functionality. The scale of the geologic map was too small for sufficiently accurate mapping of formational boundaries. Surface exposure of outcrops on north facing slopes was poor when compared to slopes facing different directions. Two of the chosen test sites (3 and 4) were located on slopes which were too steep and dangerous to prospect for fossils. Two of the test sites (9 and 10) were located on nearly flat slopes that proved to have little outcrop and consisted mostly of Quaternary colluvium and alluvium. The model does not differentiate between the members of the Cedar Mountain Formation and necessarily lumps them together due to the quality of the geological data.
Revised Weighted Suitability Analysis
Due to the limitations of the model, a second weighted suitability analysis was conducted with new reclassification and weights. Bands 10 and 11 were excluded from subsequent analysis due to the relatively low difference of means compared to the first seven bands. The seven remaining bands were reclassified for a revised weighted suitability analysis with the analysis mask set to the extent of the Cedar Mountain Formation. Values within one standard deviation of the fossil locality mean are closest to the values of the known fossil localities, therefore they were given a reclassified value of nine. Values between one and two standard deviations from the fossil locality mean are less similar to the values of the known fossil localities, so they were given reclassified values of five. Values outside of two standard deviations from the fossil locality mean are furthest from the values of known fossil localities, so they were given reclassified values of one. Table 6 shows the reclassified values for each band.
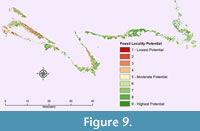 Revised weights were again assigned by comparing the difference of means of each band to the sum of the differences of means of the nine remaining bands. A percentage of how much influence each band had on the sum of the differences of means was used to determine its weight in the suitability analysis. Table 7 contains the weights given to each band. Figure 9 contains the results of the revised weighted suitability analysis. Each cell was given a Revised Fossil Locality Potential (RFLP) between 1 (Low Potential) and 9 (High Potential).
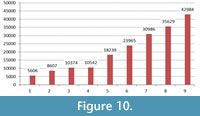 When Figure 6 and Figure 9 are compared visually, it becomes apparent that the balance of cells in each class is much more stratified in the revised model, greatly narrowing down potential search areas. Figure 10 is a histogram presenting the numbers of cells in each fossil potential category. Though there is still a distinct negative skew, it is much reduced compared to the original model with only 23% receiving RFLP-9.
Using this revised model, the 10 test sites were examined to determine if their fossil potential classes changed (see Table 8). In the original model the highest possible FLP is five whereas, in the revised model the highest possible RFLP is nine. Therefore, values of FLP-5 in the original model can be assumed to have a value roughly equivalent to RFLP-9 in the new model. Using this assumption, fossil potential for six of the test sites decreased. None received a RFLP between one and four, but two sites (sites 3 and 4, not surveyed for steepness) went down to a moderate value of RFLP-5. Four sites remained at the highest potential, one of which (site 8) was the only site which contained vertebrate fossils. It is interesting to point out that site 5, which contained invertebrate trace fossils, also maintained the highest RFLP.
Testing the Revised Model
After the original field work and model revisions, the author moved states due to a change in employment and was unable to conduct additional field work due to difficulty travelling to the study area. Rather than leaving the revised model completely untested, data was obtained for 10 previously published fossil localities in the Cedar Mountain Formation (see Figure 1). These localities were mapped and compared to the model with inconclusive results.
Only two of the 10 published localities fell within the mapped extent of the Cedar Mountain Formation. One of these localities fell onto a cell with RFLP-8, while the other occurs in a cell of RFLP-5. Considering a 50.8-m margin of error for a 1:100,000 scale map (United States Bureau of the Budget, 1947), a buffer was added to the mapped extent of the Cedar Mountain Formation, however, the number of localities falling into its boundaries only increases to three. Distances of the remaining published localities to the buffered Cedar Mountain Formation range from about 10-1800 m. Spatial data from five of the localities were gathered prior to the end of selective availability of GPS signals in 2000 (Clinton, 2000), but two of those older localities fall within the mapped boundaries of the Cedar Mountain Formation. Since it is unknown how the coordinates for these localities were obtained, this data set is unreliable at best for analytical purposes. Additional field work or more reliable locality data from another source are needed for more rigorous testing.
Additional Parameters
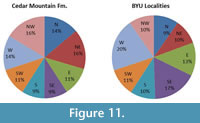 Burk (2021) hypothesized that in the Northern Hemisphere fossils are less likely to be found on surfaces with northern aspects. This is likely due to several reasons including but not limited to a more active freeze-thaw cycle, greater abundance of vegetation, decreased insolation, greater presence of water, and more developed regolith when compared to surfaces with southern aspects. Figure 11 shows a graphic comparison to the percentages of cells which fall into each of eight cardinal direction aspect classes. Northern (combined NW, N, and NE) aspects consist of 46% of all the cells of the Cedar Mountain Formation. Among BYU localities, northern aspects consist of 29% of all cells. Assuming that aspect has no effect on the presence of fossil localities, 46% of all localities would fall on aspects with northern aspects because 46% of Cedar Mountain Formation cells have northern aspects. If Cedar Mountain Formation aspects were equally distributed in all cardinal directions, only 37.5% of cells would have northern aspects. It appears that there is a bias in the Cedar Mountain Formation to favor northern aspects, whereas the localities show a reduced tendency to appear on northern aspects.
This bias may be a result of the underlying geologic structure of the region. In this area, the Cedar Mountain Formation has an overall regional dip to the north. As a result, the northern aspects are composed of large exposures of the upper surfaces of rock beds, which are more resistant to erosion whereas the southern aspects are comprised of surfaces which cut across multiple rock beds. If a resistant rock bed on a northern aspect has few fossils, there will be few fossils exposed. If a southern aspect cuts across multiple rock beds, there is a greater chance for beds containing fossils to be exposed. Additionally, a more stable surface underlain by a bed of erosion resistant rock is more likely to collect colluvium and debris and be obscured by vegetation than an actively eroding surface.
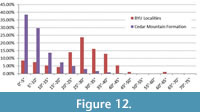 Burk (2021) also hypothesized that fossils are less likely to be found on surfaces with higher angle slopes because they have less available surface area with which to expose fossils. He found that fossils were more likely to be exposed on surfaces with a slope less than 10°. Though his exact hypothesis doesn't correspond to data from this study, the general principle holds true; slopes that are too steep tend to have fewer fossil localities. This could be due to the limited amount of formational surface rock exposed or could be due to a sampling bias because slopes that are too steep are difficult and dangerous to navigate. Figure 12 shows a visual comparison of the distribution of cells in five-degree incremental classes for both the entire Cedar Mountain Formation and BYU fossil localities.
The slopes of the Cedar Mountain Formation follow a strong trend with most cells having a low angle slope with nearly exponentially decreasing numbers of cells in higher angle slope classes. This trend manifests itself in a distinctly strong positive skew on the histogram. However, the slopes of fossil localities have a recognizably normal distribution with 75% occurring on slopes between 15° and 38° (±1 standard deviation). The Cedar Mountain formation has only 17% of its exposures in that range. There are only two outlying localities on slopes steeper than 45° further indicating a strong bias for fossil localities clustering on lower angle slopes. Field observations indicated that very flat lying slopes (<5°) such as those from test sites nine and 10 were mainly alluvium and colluvium with little visible outcrop. However, eight fossil localities were located on these flat lying slopes. Table 9 contains the detailed data used to construct Figure 12.
Refined Model
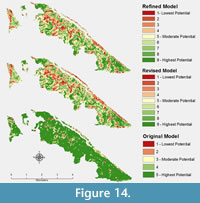
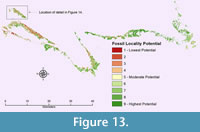 Since there seems to be a bias against fossil localities on northern aspects, raster operations were used to exclude northern aspects (aspects ≤ 22.5° and ≥ 337.5°) from the predictive model. Since there is also a bias against fossil localities occurring on high angle slopes, those greater than 45° were also excluded from the predictive model using raster operations. Though there may still be a bias against fossil localities being found on flat lying surfaces due to the low number of localities compared to the high percentage of flat lying Cedar Mountain Formation, low angle slopes were not excluded from the analysis. Figure 13 presents the results of the refined model. Figure 14 is a side-by-side detailed comparison of a portion of the original, revised, and refined models.
Unresolved Problems with the Model
 Errors in geologic data could adversely affect model effectiveness. The geologic map (Doelling, 2002), which was used in the model, is small scale (1:100,000) so details about its contacts with adjacent units may be inaccurate. As a result, the model likely excludes areas of actual Cedar Mountain Formation from its parameters as well as including areas that belong to adjacent formations. Only 43 of the 98 BYU localities (43.88%) fall within the Cedar Mountain Formation as mapped by Doelling (2002). Considering a 50.8-m margin of error, the number increases to 73 of 98 (74.49%). Adding a 5-m buffer to fossil localities to account for GPS signal accuracy error does not move any of them into the buffered Cedar Mountain Formation.
While usually not distinguishable to the naked eye in the field, microfossils play an important role in paleontological investigations. Microfossils, though well-known from the Cedar Mountain Formation (Cifelli and Madsen, 1998; Cifelli, 1999; Gardner, 1999; Nydam, 2000; Eaton and Cifelli, 2001; Nydam and Cifelli, 2002), were not tested for in this model. None of the localities used in the analysis were microfossil localities, and microfossils were not sampled for during field testing of the model. Fossil plants (Thayn, et al. 1983, 1985; Thayn and Tidwell, 1984; Dayvault and Hatch, 2007) and invertebrates (Sames et al., 2010), though known from the Cedar Mountain Formation, were similarly ignored by the model.
The BYU fossil locality data consists of all localities containing identifiable vertebrate bone. Some of these localities consisted solely of fragments of bone only identifiable as vertebrate but not of insufficient quality or quantity to determine which group of vertebrates it came from. Some of the localities are quarries which have produced articulated and associated skeletons or even mass mortality assemblages. In this study the relative importance of localities was not distinguished.
Accurate locality data with reasonably large population sizes are difficult to come by. Exact physical locations of fossil localities are often closely guarded to avoid fossil poaching by amateurs and accidental damage by the curious public. Geospatial data on only 10 published vertebrate fossil localities was able to be obtained and most of these proved unreliable. A larger number of accurate data points for fossil localities would improve the analysis.
Though the NAD1983 UTM Zone 12 N projected coordinate system was used for the analysis, source data was created using several different projected coordinate systems. The conversion from one coordinate system into another may have caused minor spatial errors. Table 10 lists the data sets and their respective coordinate systems.
CONCLUSIONS
This study represents one of the first fossil locality predictive models for the Cedar Mountain Formation using weighted suitability analysis. The model used Landsat 8 OLI/TIRS spectral reflectance data, slope degree and aspect data, and known fossil localities to identify areas within the Cedar Mountain Formation which have similar physical and spectral attributes. The model was field tested and refined. Areas of high fossil locality potential were identified. This study demonstrates the ease and usefulness of using remotely sensed data and GIS to further paleontological investigations. With such tools, many more paleontologists could reduce unproductive prospecting time, save money, and maximize effort in the field.
Due to time and funding constraints, the final predictive model was not field tested for accuracy. Known fossil localities were compared to the fossil potential values in the final predictive model to check for internal model consistency. Thirty-eight of the BYU localities fell outside the boundaries of the final model due to datum conflicts and the quality of geologic boundary data. Of the remaining 30 localities, 100% were located on cells of moderate to high fossil potential value (RFLP 5 through 9). Of those, 40% were on cells of RFLP-9 (see Table 11).
Other fossil locality predictive models use differing datasets such as land use/land cover classifications (Oheim, 2007; Conroy et al., 2012; Emerson and Anemone, 2012), elevation (Oheim, 2007; Egeland et al., 2010; Wills et al., 2018), vegetation (Oheim, 2007; Egeland et al., 2010; Wills et al., 2018), distance to roads (Oheim, 2007), and high-resolution remotely sensed imagery (Emerson et al, 2015; Ghezzo, 2023). Some predictive models use differing methods such as cost path analysis (Egeland et al., 2010), neural network classification (Emerson and Anemone, 2012), GEOBIA (Emerson et al., 2015), and hot spot analysis (Wills et al., 2018). Some studies use a purely GIS based approach, others include remotely sensed data. Further research could compare or combine the use of those datasets and methods to those in this study further refine model accuracy.
As suggested by this study, fossil locality predictive models are valuable and relatively inexpensive tools that can help researchers narrow down potential search areas and better allocate time and resources. Fossil locality predictive model quality is wholly dependent on the quality of the input data and the methods of determining suitability. There may be no single predictive model solution for all types of field areas. Models should be designed with a strong understanding of relevant environmental conditions in potential search areas. Field testing is ideal when designing fossil locality predictive models.
ACKNOWLEDGEMENTS
I would like to recognize and thank R. Scheetz of the Brigham Young University Museum of Paleontology who provided fossil locality data without which this study would not have been possible. Thanks are due to the numerous colleagues, classmates, and anonymous peer reviewers whose discussion and feedback helped to improve this study. S. Sandau of Intermountain Paleo-Consulting provided incentive and steady employment not to mention an amazingly flexible work schedule without which I would not have been able to complete my graduate studies. Most of all I would like to honor my lovely wife, Faith, for the constant support and encouragement she has given me throughout this process. Without her sacrifice, constancy, and inspiration, not to mention her hard work caring for and raising our six children (three of whom were born during my graduate studies), I would not be where I am today.
REFERENCES
Alroy, J. and Uhen, M.D. 2013. Paleobiology database frequently asked questions downloaded 22 Jan 2014. Paleobiology Database.
http://paleobiodb.org/#/faq
Anemone, R., Emerson, C., and Conroy, G. 2011. Finding fossils in new ways: An artificial neural network approach to predicting the location of productive fossil localities. Evolutionary Anthropology: Issues, News, and Reviews, 20:169–180.
https://doi.org/10.1002/evan.20324
Bodily, N.M. 1969. An armored dinosaur from the lower Cretaceous of Utah. Brigham Young University Geology Studies, 16(3):35–60.
Britt, B.B., Scheetz, R.D., Brinkman, D.B., and Eberth, D.A. 2006. A Barremian neochoristodere from the Cedar Mountain Formation, Utah, U.S.A. Journal of Vertebrate Paleontology, 26:1005–1008.
https://doi.org/10.1671/0272-4634(2006)26[1005:ABNFTC]2.0.CO;2
Burk, D. 2021. Slope and aspect as predictors of surface fossil abundance in the Uinta Basin, Utah. Academia Letters, 4474.
https://doi.org/10.20935/al4474
Carpenter, K., Kirkland, J.I., Burge, D., and Bird, J. 1999. Ankylosaurs (Dinosauria: Ornithischia) of the Cedar Mountain Formation, Utah, and their stratigraphic distribution. p. 243–251. In Gillette, D.D. (ed.), Vertebrate Paleontology in Utah. Utah Geological Survey, Salt Lake City.
https://doi.org/10.34191/mp-99-1
Carpenter, K., Bartlett, J., Bird, J., and Barrick, R. 2008. Ankylosaurs from the Price River Quarries, Cedar Mountain Formation (Lower Cretaceous), east-central Utah. Journal of Vertebrate Paleontology, 28:1089–1101.
https://doi.org/10.1671/0272-4634-28.4.1089
Cifelli, R.L. 1999. Therian teeth of unusual design from the Mid-Cretaceous (Albian-Cenomanian) Cedar Mountain Formation of Utah. Journal of Mammalian Evolution, 6(3):247–270.
Cifelli, R.L. and Madsen, S.K. 1998. Triconodont mammals from the Medial Cretaceous of Utah. Journal of Vertebrate Paleontology, 18(2):403–411.
https://doi.org/10.1080/02724634.1998.10011068
Clinton, W.J. 2000. President Clinton: improving the civilian Global Positioning System (GPS) downloaded 11 Feb 2014. The White House Office of the Press Secretary.
Coelho, J.D.O., Anemone, R.L., and Carvalho, S. 2021. Unsupervised learning of satellite images enhances discovery of late Miocene fossil sites in the Urema Rift, Gorongosa, Mozambique. PeerJ, 9:e11573.
https://doi.org/10.7717/peerj.11573
Conroy, G.C., Emerson, C.W., Anemone, R.L., and Townsend, K.E.B. 2012. Let your fingers do the walking: a simple spectral signature model for ‘remote’ fossil prospecting. Journal of Human Evolution, 63:79–84.
https://doi.org/10.1016/j.jhevol.2012.04.002
Conroy, G.C., Chew, A., Rose, K.D., Bown, T.M., Anemone, R.L., and Gunnell, G.F. 2018. Assessing unsupervised image classification as an aid in paleoanthropological explorations, p.59–80. In Anemone, R.L. and Conroy, G.C. (eds.), New Geospatial Approaches to the Anthropological Sciences, Albuquerque.
Currie, B.S. 1997. Sequence stratigraphy of nonmarine Jurassic-Cretaceous rocks, central Cordilleran foreland-basin system. Geological Society of America Bulletin, 109(9):1206–1222.
https://doi.org/10.1130/0016-7606(1997)109%3C1206:SSONJC%3E2.3.CO;2
Dayvault, R.D. and Hatch, H.S. 2007. Conifer cones from the Jurassic and Cretaceous Rocks of Eastern Utah. Rocks and Minerals, 82:382–396.
https://doi.org/10.3200/rmin.82.5.382-397
Doelling, H.H. 2002. Geologic map of the Moab and eastern part of the San Rafael Desert 30’x60’ Quadrangles, Grand and Emery Counties, Utah, and Mesa County, Colorado, 1:100,000. Utah Geological Survey, Salt Lake City.
https://doi.org/10.34191/m-180
Eaton, J.G. and Cifelli, R.L. 2001. Multituberculate mammals from near the Early-Late Cretaceous boundary, Cedar Mountain Formation, Utah. Acta Palaeontologica Polonica, 46(4):453–518.
Egeland, C.P., Nicholson, C.M., and Gasparian, B. 2010. Using GIS and ecological variables to identify high potential areas for paleoanthropological survey: an example from Northern Armenia. Journal of Ecological Anthropology, 14(1):89–98.
https://doi.org/10.5038/2162-4593.14.1.8
Emerson, C.W. and Anemone, R.L. 2012. An artificial neural network-based approach to identifying mammalian fossil localities in the Great Divide Basin, Wyoming. Remote Sensing Letters, 3(5):453–460.
https://doi.org/10.1080/01431161.2011.621463
Emerson, C., Bommersbach, B., Nachman, B., and Anemone, R. 2015. An object-oriented approach to extracting productive fossil localities from remotely sensed imagery. Remote Sensing, 7(12):16555–16570.
https://doi.org/10.3390/rs71215848
Galton, P.M. and Jensen, J.A. 1978. Remains of ornithopod dinosaurs from the Lower Cretaceous of North America. Brigham Young University Geology Studies, 25(3):1–10.
Gardner, J.D. 1999. New albanerpetonid amphibians from the Albian to Coniacian of Utah, USA- bridging the gap. Journal of Vertebrate Paleontology, 19(4):632–638.
https://doi.org/10.1080/02724634.1999.10011177
Garrison, J.R., Brinkman, D., Nichols, D.J., Layer, P., Burge, D., and Thayn, D. 2007. A multidisciplinary study of the Lower Cretaceous Cedar Mountain Formation, Mussentuchit Wash, Utah: a determination of the paleoenvironment and paleoecology of the Eolambia caroljonesa dinosaur quarry. Cretaceous Research, 28:461–494.
https://doi.org/10.1016/j.cretres.2006.07.007
Ghezzo, E., Massironi, M., and Davis, E.B. 2023. Multispectral satellite imaging improves detection of large individual fossils. Geological Magazine, 160(3), 535–544.
https://doi.org/10.1017/s001675682200108x
Gilpin, D., DiCroce, T., and Carpenter, K. 2007. A possible new basal hadrosaur from the Lower Cretaceous Cedar Mountain Formation of eastern Utah, p. 79–89. In Carpenter, K. (ed.), Horns and Beaks: Ceratopsian and Ornithopod Dinosaurs. Indiana University Press, Bloomington.
https://doi.org/10.2307/j.ctt1zxz1md.10
Kelson, R. 2007. 5 m auto-correlated elevation models downloaded 28 Nov 2013: Utah AGRC. http://gis.utah.gov/data/elevation-terrain-data/5-meter-auto-correlated-elevation-models
Kirkland, J.I. 2005. Utah’s newly recognized dinosaur record from the Early Cretaceous Cedar Mountain Formation, Utah Geological Survey: Survey Notes, 37:1–5.
Kirkland, J.I. and Madsen, S.K. 2007. The Lower Cretaceous Cedar Mountain Formation, Eastern Utah: the view up an always interesting learning curve, p. 1–108. Utah Geological Association Publication 35. Geological Society of America Rocky Mountain Section Annual Meeting Field Guide. St. George, UT.
Kirkland, J.I., Britt, B.B., Whittle, C.L., Madsen, S.K., and Burge, D.L. 1998. A small coelurosaurian theropod from the Yellow Cat Member of the Cedar Mountain Formation (Lower Cretaceous, Barremian) of Eastern Utah. New Mexico Museum of Natural History and Science Bulletin, 14:239–248.
Kirkland, J.I., Cifelli, R.L., Britt, B.B., Burge, D.L., DeCourten, F.L., Eaton, J.G., and Parrish, J.M. 1999. Distribution of vertebrate faunas in the Cedar Mountain Formation, East-Central Utah, p. 201–217. In Gillette, D.D. (ed.), Vertebrate Paleontology in Utah. Utah Geological Survey, Salt Lake City.
https://doi.org/10.34191/mp-99-1
Kirkland, J.I., Zanno, L.E., Sampson, S.D., Clark, J.M., and DeBlieux, D.D. 2005. A primitive therizinosauroid dinosaur from the Early Cretaceous of Utah. Nature 435:84–87.
https://doi.org/10.1038/nature03468
Klinkenberg, B. 1997. Unit 23 - History of GIS. University of British Colombia Department of Geography. https://doi.org/10.1093/OBO/9780199874002-0143
Malakhov, D.V., Dyke, G.J., and King, C. 2009. Remote sensing applied to paleontology-exploration of Upper Cretaceous sediments in Kazakhstan for potential fossil sites. Palaeontologia Electronica, 12.2.3T:1–10.
https://palaeo-electronica.org/2009_2/164/index.html
McDonald, A.T., Kirkland, J.I., DeBlieux, D.D., Madsen, S.K., Cavin, J., Milner, A.R.C., and Panzarin, L. 2010. New basal iguanodonts from the Cedar Mountain Formation of Utah and the evolution of thumb-spiked dinosaurs. PLoS One, 5(11):1–35.
https://doi.org/10.1371/journal.pone.0014075
Nydam, R.L. 2000. A new taxon of helodermatid-like lizard from the Albian-Cenomanian of Utah. Journal of Vertebrate Paleontology, 20(2):285–294.
https://doi.org/10.1671/0272-4634(2000)020[0285:antohl]2.0.co;2
Nydam, R.L. and Cifelli, R.L. 2002. A new teiid lizard from the Cedar Mountain Formation (Albian-Cenomanian boundary) of Utah. Journal of Vertebrate Paleontology, 22(2):276–285.
https://doi.org/10.1671/0272-4634(2002)022[0276:antlft]2.0.co;2
Oheim, K. 2007. Fossil site prediction using geographic information systems (GIS) and suitability analysis: The Two Medicine Formation, MT, a test case. Palaeogeography, Palaeoclimatology, Palaeoecology, 251(3/4):354–365.
https://doi.org/10.1016/j.palaeo.2007.04.005
Sames, B., Cifelli, R.L., and Schudack, M.E. 2010. The nonmarine Lower Cretaceous of the North American western interior foreland basin: new biostratigraphic results from ostracod correlations and early mammals, and their implications for paleontology and geology of the basin – an overview. Earth-Science Reviews, 101:207–224.
https://doi.org/10.1016/j.earscirev.2010.05.001
Santucci, V.L. and Kirkland, J.I. 2010. An overview of National Park Service paleontological resources from the Parks and Monuments in Utah, p. 589–623. In Sprinkel, D.A., Chidsey, T.C. Jr., and Anderson, P.B. (eds.), Geology of Utah’s Parks and Monuments. Utah Geological Association, Salt Lake City, USA.
Senter, P., Kirkland, J.I., DeBlieux, D.D., Madsen, S., and Toth, N. 2012a. New dromaeosaurids (Dinosauria: Theropoda) from the Lower Cretaceous of Utah, and the evolution of the dromaeosaurid tail. PLoS One, 7(5):1–20.
https://doi.org/10.1371/journal.pone.0036790
Senter, P., Kirkland, J.I., and DeBlieux, D.D. 2012b. Martharaptor greenriverensis, a new theropod dinosaur from the Lower Cretaceous of Utah. PLoS One, 7:e43911.
https://doi.org/10.1371/journal.pone.0043911
Stucky, R.K. and Krishtalka, L. 1991. The application of geologic remote sensing to vertebrate biostratigraphy - general results from the Wind River Basin, Wyoming. Mountain Geologist, 28:75–82.
Taylor, M.P., Wedel, M.J., and Cifelli, R.L. 2011. A new sauropod dinosaur from the Lower Cretaceous Cedar Mountain Formation, Utah, USA. Acta Palaeontologica Polonica, 56(1):75–98.
https://doi.org/10.4202/app.2010.0073
Thayn, G.F., Tidwell, W.D., and Stokes, W.L. 1983. Flora of the Lower Cretaceous Cedar Mountain Formation of Utah and Colorado, part I. Paraphyllanthoxylon utahense. Great Basin Naturalist, 43(3):394–402.
Thayn, G.F. and Tidwell, W.D. 1984. Flora of the Lower Cretaceous Cedar Mountain Formation of Utah and Colorado, part II. Mesembrioxylon stokesi. Great Basin Naturalist, 44(2):257–262.
Thayn, G.F., Tidwell, W.D., and Stokes, W.L. 1985. Flora of the Lower Cretaceous Cedar Mountain Formation of Utah and Colorado. part III: Icacinoxylon pittiense n. sp. American Journal of Botany, 72(2):175–180.
https://doi.org/10.1002/j.1537-2197.1985.tb08281.x
United States Bureau of the Budget. 1947. United States National Map Accuracy Standards.
Wills, S., Choiniere, J.N., and Barrett, P.M. 2018. Predictive modelling of fossil-bearing locality distributions in the Elliot Formation (Upper Triassic-Lower Jurassic), South Africa, using a combined multivariate and spatial statistical analyses of present-day environmental data. Palaeogeography, Palaeoclimatology, Palaeoecology, 489:186–197. https://doi.org/10.1016/j.palaeo.2017.10.009
WoldeGabriel, G., White, T., Suwa, G., Semaw, S., Beyene, Y., Asfaw, B., and Walter, R. 1992. Kesem-Kebena: a newly discovered paleoanthropological research area in Ethiopia. Journal of Field Archaeology, 19(4):471–493.
