| |
DISCUSSION
The results presented here for Cetacea match some of the results that have been presented for similar studies of the entire Phanerozoic biota. Our measures of research effort (papers in the PBDB and in GeoRef) had an even closer relationship with the number of fossil cetacean genera than did the measure of research effort used by
Sheehan (1977) for marine invertebrates. In that case, however, both research effort and the measure of diversity matched the estimated map area and volume of rock in which the fossils were found (Raup 1977;
Sheehan 1977), whereas our study found only occasional correspondence of diversity with map area.
Raup (1977) was neither surprised nor concerned by the correlation of research effort with his measure of diversity, because he thought that paleontologists studied what was available for study, and that was in turn related to the amount of rock available in which to find fossils.
It is difficult to discern whether there is a problem with research effort. It is not surprising that there is more research where and when there are more fossils (Sheehan 1977). Without prior knowledge of the fossils yet to be studied, we cannot determine whether a particular taxon, area, or time interval is understudied relative to other time intervals. We can however get a glimpse at an earlier stage of the journey from fossil preservation to publication by looking at the fossils in museum databases. These fossils have at least been recovered, but many remain unstudied. If the distribution of studied fossils does not match that of unstudied ones, then we might suspect that there is a problem with research effort. To estimate how serious a problem this might be, we tallied how many of the specimens in the USNM specimen database were assigned to particular genera for each Cenozoic epoch. These results show that 74% of Eocene specimens, 75% of the Miocene specimens, 86% of the Pliocene specimens, but only 14% of the Oligocene specimens are assigned to named genera. The proportion of Oligocene taxa in the USNM collections assigned to the "incertae sedis" category supports our suspicion that there are likely to be many more Oligocene genera than are currently in our data set. This preponderance of "phantom" Oligocene genera is consistent with our own intuition based on many years of work in the USNM and other museums. Such "phantoms" of diversity may not be a problem for diversity over time studies for invertebrate paleontology, but undescribed taxa are real problems in vertebrate paleontology where many taxa are represented by singular specimens. Although it remains to be demonstrated empirically, it is possible that when more of the Oligocene specimens already in museums are studied, the Oligocene (at least the late Oligocene) will look much more like the Miocene, and the origins of modern families of cetaceans will be much better understood.
Recently, Smith (2001) demonstrated a correlation between rock area and measured diversity using outcrop area of rocks in France and the United Kingdom using
Sepkoski's (1997) generic level diversity database; similarly,
Crampton et al. (2003) demonstrated a correlation between rock area and mollusk species in New Zealand. The high correlation between rock units and diversity changes over time compelled
Raup (1977),
Smith (2001), and
Crampton et al. (2003) all to call into question whether the number of taxa over time actually represent what diversity was like in the past. Our results depart sharply from these studies in that we did not find a correlation between the amount of rock available for study and the number of genera named from those rocks. It is then tempting to interpret our strong correlation of research effort with the number of diagnostic genera as having a different meaning. Perhaps both the number of papers on fossil Cetacea and the number of diagnostic cetacean genera are driven by the actual pattern of generic diversity, which is what we first attempted to discern.
Unlike the entire Phanerozoic marine invertebrate record, a working knowledge of the entirety of the order Cetacea is within the grasp of individual researchers. We suspect that the pattern of diagnostic generic diversity that we report is a fair representation of the pattern of generic diversity for the order, with the caveat for the Oligocene noted above. This observation supports the hypothesis of an early Oligocene rapid radiation of Neoceti (Fordyce 1992;
Fordyce 2002a;
Fordyce and de Muizon, 2001;
Whitmore and Sanders 1977), and also calls into question whether generic richness was truly different in the Oligocene vs. the Miocene.
Some recent studies such as those of
Smith (2001),
Peters and Foote (2002), and
Crampton
(et al. 2003) strongly link patterns of observed diversity or changes in taxonomic richness to geologic processes or patterns that may not relate directly to the true pattern of taxonomic richness over time. All of these studies link changes in taxonomic richness to the amount of rock available for study, even though they use very different approaches.
Peters and Foote (2002) use the number of named formations as a proxy for available rock whereas
Smith (2001) noted the presence of rocks of particular ages on a series of small scale geologic maps of France and the United Kingdom.
Crampton et al. (2003) found that mollusk species richness correlated with both rock area and formation names, but the fit was better with rock area. Although our data do not show a strong relationship between available rock and generic richness, two time intervals that have a low map area of rocks are worth discussing in more detail.
The first time interval with a low area map is the early Oligocene. Generally, it is thought that the Eocene-Oligocene boundary demarcates the origin of modern cetacean suborders from derived archaeocetes, with the nearly simultaneous (pseudo) extinction of the archaeocetes (see
Barnes et al. 2001;
Fordyce 2002b for possible alternatives). Our study provides qualitative and quantitative justification for paleocetologists to continue focusing their efforts on the Oligocene (Fordyce 2003a;
Whitmore and Sanders 1977). As noted above, many fossils that have already been collected will help to fill in the diversity during this time interval.
The second time interval with a low map area is the early Pliocene. Despite the paucity of rocks in which to find cetacean fossils (Figure 4), observed diversity is relatively high. We attribute this fact to the willingness of taxonomists to assign a generic identification of a living genus to a fossil that they might not have assigned to a genus at all in the Pliocene vs. earlier time intervals. Support for this suggestion comes from the observation that many of the named genera in the Pliocene are extant genera (25%), whereas only 8% of Miocene genera are extant and none in the Oligocene or Eocene are extant.
Correlation of sirenian and cetacean diversity may reflect a common affinity for warm, tropical to subtropical environments. Today, all sirenians (with the exception of the recently extirpated
Hydrodamalis) live in these types of environments. The correlation of the diversity of these two groups, though weak, may track the waxing and waning of these environments through geologic time. Another study currently under way will attempt to explore this idea further by actually tracing co-occurrence of Sirenia and Cetacea along with lithologic indicators of environmental factors.
 Finally, it is worth noting that a great deal more work remains to be done on fossil cetaceans in general, not just during the Oligocene.
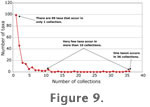
Figure 9 shows the number of fossil cetacean genera vs. the number of collections in which they occur. Many genera occur in only a single collection and often are represented by single individuals. As a direct result, very few fossil cetacean genera range for more than a single stage. It is clear that many taxa remain to be discovered even in localities that have been collected for decades. Collection of new specimens from these localities with good age control will help clarify the age range of fossil cetacean taxa. Finally, it is worth noting that a great deal more work remains to be done on fossil cetaceans in general, not just during the Oligocene.
Figure 9 shows the number of fossil cetacean genera vs. the number of collections in which they occur. Many genera occur in only a single collection and often are represented by single individuals. As a direct result, very few fossil cetacean genera range for more than a single stage. It is clear that many taxa remain to be discovered even in localities that have been collected for decades. Collection of new specimens from these localities with good age control will help clarify the age range of fossil cetacean taxa.
Figure 10 shows a plot of origination rate and extinction rate for global cetacean genera from the Eocene to Holocene.
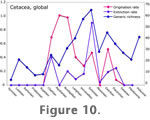 Flat areas at the beginning and end are caused by the lack of genera crossing stage boundaries in those intervals. It appears that increases in diversity from the late Oligocene to Middle Miocene are driven by an increase in origination rate, coupled with a relatively low extinction rate. Extinction rate peaks in the late Miocene, causing a
drop in diversity during the Messinian when coupled with a low origination rate. This result may be caused by a data quality problem in the Messinian caused by the drying of the Mediterranean, which in earlier time intervals was a source of many fossil cetacean collections. Origination picks up again in the Pliocene, adding several genera that persist to the present. Flat areas at the beginning and end are caused by the lack of genera crossing stage boundaries in those intervals. It appears that increases in diversity from the late Oligocene to Middle Miocene are driven by an increase in origination rate, coupled with a relatively low extinction rate. Extinction rate peaks in the late Miocene, causing a
drop in diversity during the Messinian when coupled with a low origination rate. This result may be caused by a data quality problem in the Messinian caused by the drying of the Mediterranean, which in earlier time intervals was a source of many fossil cetacean collections. Origination picks up again in the Pliocene, adding several genera that persist to the present.
So, what controls our understanding of fossil cetacean diversity? Primarily, it appears to be the underlying diversity of the fossil cetaceans themselves. The diversity pattern does not seem to be affected by the population of potential collectors in a fossil bearing area. This pattern is perhaps distorted by the paucity of early Oligocene rocks. The pattern may be distorted by the zealous
individual collectors or groups of collectors in particular times and areas, although this pattern may equally reflect the abundance of fossils in those particular places. Cetacean diversity is certainly distorted by the lack of study of existing late Oligocene fossils, a problem which is decidedly solvable.
Fordyce (1992) graphically demonstrated this problem in his
Figure 18.2. He shows ~ 40 species of late Oligocene cetaceans, of which twelve
are informally designated.
In conclusion, we reiterate the need for using appropriate scales when discussing diversity through geologic time. Because patterns of diversity over the entire Phanerozoic may be too overwhelmed by serious biases to draw detailed conclusions about the history of life, the evolution of smaller groups of organisms may present more tractable cases of diversity through time if potential biases are addressed and corrected, as we have done with cetaceans. For Cetacea, it appears that the fossil record is generally good, with a problem only in the Oligocene. With more research effort geared toward finding more fossils and preparing and describing those fossils that have already been discovered, we should be able to come to a better understanding of the basic pattern of cetacean diversity through time, in coordination with the manifold biotic and abiotic factors related to their evolutionary history.
|