| |
RESULTS
Taxonomic Bias
Our tabulation of described cetacean genera totaled 248 genera that had not been explicitly synonymized with other diagnosable genera. After combing the literature to determine which of these genera are based on diagnostic material and which are not, we found that of the 436 generic names that have been applied to fossil cetaceans, only 56% of them are still in use. Of the 43% that are no longer in use, 6% are simple misspellings, 18% are considered nomina dubia, nomina vana, or nomina oblita (mainly based on poor type material), and 19% are synonyms of other taxa.
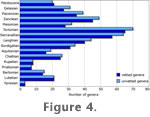 Figure 4 shows a comparison of the global cetacean fossil record with junior synonyms (both subjective and objective) included (unvetted) and excluded (vetted). The two distributions are virtually identical indicating that the specimens identified as junior synonyms of other genera were not more likely to live in any time interval more than any other. This result also shows that, in hindsight, this taxonomic housekeeping step was not necessary if all we were interested in was the relative change in diversity from time interval to time interval. This step has been completed, however, and we can now be confident in negating the bias from bad taxonomic practice at the generic level. This result is similar to results found by Wagner et al. for Paleozoic gastropods, Jurassic pelecypods, and Cenozoic pelecypods (Wagner et al. 2007). Furthermore, we can also report absolute values for generic richness rather than just relative changes in generic richness. Figure 4 shows a comparison of the global cetacean fossil record with junior synonyms (both subjective and objective) included (unvetted) and excluded (vetted). The two distributions are virtually identical indicating that the specimens identified as junior synonyms of other genera were not more likely to live in any time interval more than any other. This result also shows that, in hindsight, this taxonomic housekeeping step was not necessary if all we were interested in was the relative change in diversity from time interval to time interval. This step has been completed, however, and we can now be confident in negating the bias from bad taxonomic practice at the generic level. This result is similar to results found by Wagner et al. for Paleozoic gastropods, Jurassic pelecypods, and Cenozoic pelecypods (Wagner et al. 2007). Furthermore, we can also report absolute values for generic richness rather than just relative changes in generic richness.
Time Scale Bias
 As noted above, and by
Uhen (1996), the time scale used in analysis of diversity can have a significant effect on the shape of the diversity curve.
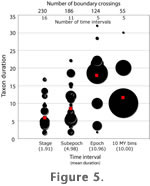
Figure 5 shows the effect time scale coarseness on perceptions of taxon duration. Note that the mean, maximum, and range of the perceived taxon durations all increase as the scale becomes coarser. The epoch scale is somewhat different from all of the others. The result shows most taxa with a long range because those taxa are found in the Miocene, which is the longest of all Cenozoic epochs, and because several late Miocene genera range into the early Pliocene, making their perceived ranges even longer. As noted above, and by
Uhen (1996), the time scale used in analysis of diversity can have a significant effect on the shape of the diversity curve.
Figure 5 shows the effect time scale coarseness on perceptions of taxon duration. Note that the mean, maximum, and range of the perceived taxon durations all increase as the scale becomes coarser. The epoch scale is somewhat different from all of the others. The result shows most taxa with a long range because those taxa are found in the Miocene, which is the longest of all Cenozoic epochs, and because several late Miocene genera range into the early Pliocene, making their perceived ranges even longer.
Foote (2000) recommended using only boundary crossing taxa in diversity analyses to avoid the problems associated with interval length. In this study, such an approach proved problematic for cetaceans because many of the genera are known only from single time intervals. Of the 218 cetacean genera with a known fossil record, 103 of them are known from a single subepoch.
See Discussion for an expansion on this point.
Collection Bias
Collector habits
Analysis of the museum collection data from the FLMNH, SDMNH, UCMP, and USNM shows that in each museum, a small number of collectors contribute a majority of the specimens to each collection (see
Table 2). Many of these collectors are also
avocational paleontologists who have a particular geographic interest, and thus they have collected within a narrow stratigraphic range. For example, 99% of the specimens attributed to the most prolific collector at the USNM (P.J. Harmatuk) are from a single locality, the Lee Creek phosphate mine near Aurora, North Carolina.
This type of analysis emphasizes a particular point about the nature of fossil collecting localities and how they influence our ideas about diversity. Authors in the past have noted fossil Lagerstätten can cause a spike in diversity against the background of normal fossil deposits (Behrensmeyer et al. 2000). In this case, the Lee Creek Mine has produced a great number of specimens (6585 specimens or 75% of the USNM specimen database), but few have been identified to genus. For the Lee Creek Mine, this situation may be resolved in a forthcoming volume on the marine mammal fossil of this site, with seven new fossil whale species to be named, including two new genera (Whitmore and Barnes, in press;
Whitmore and Kaltenbach, in press).
Although the Lee Creek Mine greatly increased the number of specimens of fossil cetaceans, the site only marginally increased our knowledge of the diversity of cetaceans during the time of deposition of the Lee Creek assemblage. We attribute this paucity of diversity to the taphonomic setting of Lee Creek, which produces mostly fragmentary and isolated bones and teeth, and thus only a very small proportion of the specimens are generically or specifically diagnostic.
Collecting localities
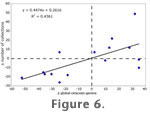 There are 953 collecting localities (called "collections" in the PBDB) that have produced cetaceans listed in the PBDB. The first differences (the difference between one time interval and the subsequent time interval) of sampled cetacean diversity and the number of collections are shown in
Figure 6. The two factors are positively correlated, albeit very weakly, which indicates that the number of collections has an effect on perceived diversity, but it is by no means the only factor controlling its value. There are 953 collecting localities (called "collections" in the PBDB) that have produced cetaceans listed in the PBDB. The first differences (the difference between one time interval and the subsequent time interval) of sampled cetacean diversity and the number of collections are shown in
Figure 6. The two factors are positively correlated, albeit very weakly, which indicates that the number of collections has an effect on perceived diversity, but it is by no means the only factor controlling its value.
Available Rock Bias
Unlike previous studies of Phanerozoic diversity (e.g.,
Crampton et al. 2003;
Raup 1976a), the number of cetacean genera over time does not appear to be significantly linked to map area of rocks in North America (see
Figure 3). This result is characterized by an abundance of middle Eocene continental shelf rocks, particularly in Texas, and these rocks have produced very little cetacean material. We find these results not completely surprising because cetaceans only evolved in the late Early Eocene in Asia (Bajpai and Gingerich, 1998) and only arrived in North America after crossing the Atlantic Ocean during the middle Eocene (Uhen, 1999). Even ignoring the middle Eocene however, there appears little correspondence between map area and the number of genera. Despite the large number of genera in the middle Miocene, middle Miocene deposits are not overrepresented when compared to the other time intervals. Also, despite the relatively large number of genera in the early Pliocene, there is very little in the way of early Pliocene continental shelf deposits. The one instance of correspondence between the two data sets that makes intuitive sense is the complete lack of cetaceans from the early Oligocene and a relatively small map area of early Oligocene rocks.
Fordyce (2003a) has suggested that the lack of Rupelian cetacean fossils is probably attributable to widespread erosion and reworking of shallow marine deposits caused by an eustatic sea-level fall, which is marked by a widespread unconformity at 29-30 Ma.
Population Bias
No discernable relationship exists between the number of people in a cetacean-bearing state and the number of fossils found.
Table 3 shows the ratio of the number of fossils found to the number of people in California, Florida, North Carolina, and Oregon over the last century. The ratio fluctuates wildly with noticeable peaks that are often attributable to particular collectors. The aforementioned dominance of particular collectors in museum collections explains these data rather succinctly and intuitively.
Research Effort Bias
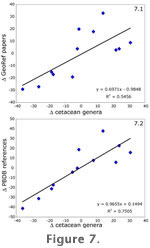 Research effort is well correlated with the number of diagnostic cetacean genera. First differences of the number of papers in GeoRef is tightly correlated with the number of genera of fossil cetaceans (Figure 7, r2 = 0.546, p < 0.01). This result matches the findings of
Sheehan (1977) for the readily fossilizable marine shelf invertebrates over the entire Phanerozoic, despite the fact that Sheehan estimated effort in a completely different way. Also, the first differences of PBDB references is even better correlated with first differences in cetacean genera in the PBDB (Figure 7.2, r2 = 0.751, p < 0.001). The significance of research effort bias suggests that the number of diagnostic cetacean genera is directly related to the amount of research output relating to fossil cetaceans. Research effort is well correlated with the number of diagnostic cetacean genera. First differences of the number of papers in GeoRef is tightly correlated with the number of genera of fossil cetaceans (Figure 7, r2 = 0.546, p < 0.01). This result matches the findings of
Sheehan (1977) for the readily fossilizable marine shelf invertebrates over the entire Phanerozoic, despite the fact that Sheehan estimated effort in a completely different way. Also, the first differences of PBDB references is even better correlated with first differences in cetacean genera in the PBDB (Figure 7.2, r2 = 0.751, p < 0.001). The significance of research effort bias suggests that the number of diagnostic cetacean genera is directly related to the amount of research output relating to fossil cetaceans.
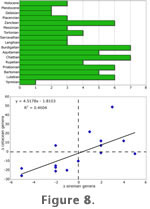 Taphonomic Bias Taphonomic Bias
Figure 8 shows the absolute pattern of sirenian diversity over time (8.1) and correlation of the first differences of sirenian genera and cetacean genera (8.2). These two distributions are weakly, but significantly correlated (r2 = 0.460, p < 0.01), indicating that a common factor is affecting both cetacean and sirenian diversity. The total number of sirenian genera (31) remains much lower than the total number of cetacean genera (240). Interestingly, sirenian generic richness peaks early on, declining toward more recent time. Because neither group is completely absent from the fossil record at any time during their history, this comparison strongly indicates that environments conducive to marine mammals and to their fossil preservation were continuously present from the early Eocene to the Recent.
|