| |
METHODS OF ANALYSIS AND METHODS TO ASSESS POTENTIAL BIASES
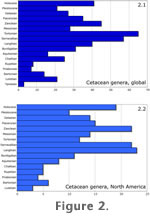 Several plots of cetacean generic richness from the Eocene to Recent were created from our generic data set. The first is a bar chart showing the number of cetacean genera described from each Cenozoic subepoch for the entire world (Figure 2.1). The second is a bar chart showing the number of cetacean genera described from each Cenozoic subepoch only for North America (Figure 2.2). Although we would have preferred to assess the potential biases in this data set for the entire world, compiling some of the necessary data (particularly the map area of rocks and population of various areas over time) would have been prohibitive. A total of 240 cetacean genera were tabulated with 101 of them represented in North America (about 42%). This figure is a higher proportion of the total than any other single continent, except Europe with 109; North America also includes all of the stages from which fossil cetaceans are known with the exception of the early Eocene (Ypresian). Several plots of cetacean generic richness from the Eocene to Recent were created from our generic data set. The first is a bar chart showing the number of cetacean genera described from each Cenozoic subepoch for the entire world (Figure 2.1). The second is a bar chart showing the number of cetacean genera described from each Cenozoic subepoch only for North America (Figure 2.2). Although we would have preferred to assess the potential biases in this data set for the entire world, compiling some of the necessary data (particularly the map area of rocks and population of various areas over time) would have been prohibitive. A total of 240 cetacean genera were tabulated with 101 of them represented in North America (about 42%). This figure is a higher proportion of the total than any other single continent, except Europe with 109; North America also includes all of the stages from which fossil cetaceans are known with the exception of the early Eocene (Ypresian).
Unless otherwise noted, plots of generic diversity are shown with taxa "ranged through." That is, if a taxon is reported before and after but not in a particular time interval, it is shown as existing in the time interval. For instance, if a taxon were reported from the fossil record in the Miocene and Pleistocene, but not reported in the Pliocene, it would be tabulated for the Pliocene. This method forces us to assume generic continuity and monophyly, which are also assumptions made by the taxonomists who assigned these particular specimens to these genera in the first place. In some instances (i.e., when looking at taphonomic bias for instance), the plots are made of genera as sampled in the time interval, rather than ranged through, so they are only tallied for a particular time interval if they actually occur in that time interval.
Taxonomic Bias
Ideally, we would tabulate the number of fossil cetacean species over time rather than the number of genera. Unfortunately, many species of fossil cetaceans have been named on very limited fossil material. Often these fossils are not diagnostic at even the family level, much less the genus or species level. Much of this problem can be avoided by simply tabulating genera rather than species. This step presumes that the number of genera is similarly correlated with the number of species at all times in the geologic past.
Using genera instead of species does not completely eliminate the potential of poorly delimited taxa artificially inflating taxonomic counts. To further combat this potential bias, we eliminated from our tabulation genera that were based on type species with non-diagnostic type material. This determination was made either by following the opinions of previous authors [(Kellogg 1968) for Cope's mysticetes; (Fordyce and de Muizon 2001) for most odontocetes], or by reading the original description of the type material and making the determination ourselves. These taxonomic opinions were added to a set of unpublished opinions to the PBDB for all cetacean genera (entered as Mark's opinions, Uhen 2008: the future date ensures that these opinions will be the most recent in the database and override all other opinions). In most instances, these opinions followed the most recent expert opinion for the genus in question. In a few cases however, taxa were designated nomina dubia because of the poor quality of the type material for the genus, a new designation for these taxa. This procedure resulted in 34 genera being designated as nomina dubia that had not been so designated by the most recent expert opinion, although many of these taxa had been judged to be non-diagnostic by some author or authors at some point in the past. These taxa are listed in
the
Appendix.
Time Scale Bias
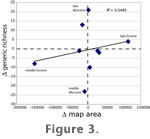 As noted above, and by
Uhen (1996), the time scale used in analysis of diversity can have a significant effect on the shape of the diversity curve and on the metrics calculated from the diversity data (Foote 2000). To determine the effect of time scale coarseness on our analysis of cetacean diversity, we plotted our data at every time scale available in the PBDB. Time scales that did not reflect the patterns found in the finest time scale were rejected from future study (see
Figure 3). As noted above, and by
Uhen (1996), the time scale used in analysis of diversity can have a significant effect on the shape of the diversity curve and on the metrics calculated from the diversity data (Foote 2000). To determine the effect of time scale coarseness on our analysis of cetacean diversity, we plotted our data at every time scale available in the PBDB. Time scales that did not reflect the patterns found in the finest time scale were rejected from future study (see
Figure 3).
Additionally, we emphasize how it is also important to note how well fossil collections can be placed temporally. If a fossil collection can only be placed to the nearest epoch, it is not very helpful when analyzing diversity at the stage level. To accommodate this potential problem, the PBDB discards fossil collections that cannot be allocated to a single time interval when generating a diversity curve. Clarifying the geologic age of fossil collections that were temporally poorly placed when originally described was a serious objective in this study, which we accomplished by searching the geological literature for additional information on the age of deposits via paleomagnetic dating, radiometric dating, and biostratigraphic (particularly microfossil) dating. In the final global data set, 378 of 953 fossil cetacean collections with fossils identified to genus (about 40%) were correlated with global ages. In North America, we correlated global ages for 180 of 349 (about 51%) fossil cetacean collections with fossils identified to genus.
Collection Bias
The process of collecting fossils can significantly affect taxon counts resulting from those collections. Prolific collectors often work in particular geographic areas and also within narrow stratigraphic (and thus chronologic) bands. To determine the extent of this potential bias, we tabulated the numbers of specimens that could be attributed to particular collectors in each of the museum databases that we examined. If a collector was listed individually, or as a member of a party, the specimens collected by the party were attributed to the individual collector only if that collector was listed first or was noted as the primary collector.
Available Rock Bias
Though comprehensive, our method of measuring map area of continental shelf rocks is very time consuming. It is also dependent on good maps being available at similar scales for all areas of analysis. For these reasons, we limited our study of map area to North America. Our analyses of the map areas compared North American continental shelf rock only to the diagnostic cetacean genera of North America. Because the amount of rock available for collecting of fossils has been shown to affect fossil diversity counts (Crampton et al. 2003;
Raup 1976a;
Smith 2001), our measure of the geologic map area of potentially cetacean-producing rocks represents an attempt to determine if the same is true for cetaceans. Map area is less than ideal for this purpose for several reasons. First, geologic map area does not reflect the area that is visible on the ground. Many such deposits are covered with soil, vegetation, and/or human development, making them relatively inaccessible for fossil collecting. Second, geologic map area can underestimate the rock available for fossil collecting when the deposits are relatively flat lying and exposed in nearly vertical surfaces. Even if geologic map area inaccurately measures the potential area in which to find fossils, it was the only tractable measure of this factor available. Formation name data from the GEOLEX database were also explored to measure bias inherent in the rock record (Peters and Foote 2001), but these data were only recorded to the epoch level, whereas much of the variation in cetacean diversity is apparent only at finer time scales.
Population Bias
We assessed human population size in fossil cetacean-bearing areas to determine if the number of people living in these areas had any effect on the number of fossils found. If we assume that the chance of discovering fossils is essentially random for any person who is not necessarily looking for them, and that many fossil cetaceans are found by these individuals, population size could have a large impact on the number of fossils found. If, however, most fossil cetaceans are found by people who are intent on finding them, this situation is less likely to be the case. To resolve this issue, data from California, Florida, North Carolina, and Oregon were explored in detail. The number of fossil cetacean specimens in each state was tabulated by decade in which they were found to compare to the number of people living in the state in the same decades. If fossil cetaceans are found by random individuals, then more people in the state should show an increase in the number of fossil cetaceans found. If, on the other hand, fossils are found by collectors intent on finding them, more fossils should be found in the decades during which these collectors were most active.
Research Effort Bias
Research effort was assessed by plotting the number of papers in the GeoRef database on fossil cetaceans by geologic age to determine if this correlated with the number of cetacean genera known in those ages.
Sheehan (1977) performed a similar test by tabulating the time intervals of interest of paleontologists as listed in the Directory of Palaeontologists of the World. One of his concerns about using these data were that some paleontologists listed multiple times of interest, and he was forced to split their "interest units" equally among their listed time intervals, even though they may not have split their efforts evenly. The use of GeoRef keyword data avoids this problem because it actually measures research output, not stated areas of interest. Whereas this measure is closer to the research effort than the area of interest noted by Sheehan, it is still not the same. Individual researchers may invest a great deal of effort into projects that either produce no published results or a relatively small number of published works.
We also assessed research effort by plotting the number of references in the PBDB that contributed to the cetacean record. These records are automatically associated with time and taxonomic units as these data are entered into the PBDB.
Taphonomic Bias
Taphonomic biases can greatly affect the distribution of fossils and could potentially alter our perceptions of generic richness (Behrensmeyer et al. 2000). Cetaceans, as obligate aquatic
mammals at least since the late Eocene, have very different taphonomic processes affecting them as compared with most other mammals. To control for potential taphonomic biases, we compared the generic richness of cetaceans with that of sirenians over the same time interval. There is an inherent potential taphonomic problem early in cetacean history because the earliest cetaceans were somewhat terrestrial to semi-aquatic (Thewissen et al. 1996). Thus, different taphonomic processes were affecting semi-aquatic early cetaceans when compared to fully aquatic late Eocene basilosaurids and all later cetaceans. Fortunately, sirenians underwent the same terrestrial to aquatic transition at the same time and in the same geographic regions as cetaceans (Domning 2001), so our taphonomic control taxon should be affected by the same taphonomic processes as our taxon of interest (Behrensmeyer et al. 2000).
|