RESULTS
Development of the Multiscan Platform
The first result of this study was the design and implementation of the low-cost multiscan platform (Figure 6.1). Implementation of this device permitted simultaneous scanning of up to nine specimens and because each of the five stage positions were fixed (Figure 6.2-6.6), generic path plans were defined for each of the five scan views (Figure 6.7-6.11). With this device, once the specimens were mounted to the platform, the pre-defined path plans were loaded and run with a single-click for each respective stage position (Figure 7). By reusing the pre-defined path plans, modeling time was reduced by around 20%. Another advantage of using this in-house device was the level of accuracy maintained. Because the stage positions were fixed, there was no opportunity for added error (~ 0.02 mm) from the stage positioning system as would be seen with a motorized rotary unit.
Development of the Autosurfacing Macro
Another result of this study was the development of an autosurfacing macro. By using the autosurfacing macro, once all five views are registered manually, the rest of the process can be performed with a single command (Figure 9). This is especially advantageous, as it permits for uniformity of image processing and reduces human error.
Six commands were incorporated into the autosurfacing macro: Global Registration, Select Disconnected Components, Select Outliers, Uniform Sample, Merge, and Clean.
1. Global Registration. The Global Registration command essentially recalculates the fit of the individual point\polygon models and repositions them to form a more cohesive surface. This function is similar to the Manual Registration operation except that the registration algorithm is applied to all five views simultaneously.
2. Select Disconnected Components. Incorporated more for specimens with multiple elements, the Select Disconnected Components command automatically selects those points (or clusters of points) that are spatially separated from the majority of the other points (cumulative percentage). These clusters are essentially those points that lie outside the potential surface boundary. Each cluster is calculated as a percentage of the total object, and a conservative sensitivity is programmed into the macro which selects those points that make up less than 5% of the total number of points.
3. 3) Select Outliers. Similar to the Select Disconnected Components command, the Select Outliers function automatically detects and selects all points that lie outside the range of the majority of points. More sensitive than the former, this operation selects those points that lie outside a given range. To maintain morphological accuracy, it was determined by trial and error that the sensitivity level needed to be set to 66.6/100 in the autosurfacing macro. Levels set above this default setting cause the function to be too aggressive in removing outliers, and levels set below fail to adequately remove noisy data.
4. Uniform Sample. The Uniform Sample operation is derived from the curvature based sampling which reduces the number of points along a planar surface uniformly, but reduces those along curved edges based upon a predetermined density. This helps to preserve the natural curvature of an object, while reducing redundant points along the flatter surfaces of the specimen. The Uniform Sample function within the macro is set to reduce the number of points so that the absolute spacing between each point is 0.039 mm. In addition to greatly reducing file size, this function also serves to reduce surface noise.
5. Merge. The Merge function is basically a macro in itself, combining: Merge Points, Reduce Noise, Uniform Sample, and Wrap functions. The Merge Points operation combines all point objects into a single object (e.g., the standard five views of a specimen will be merged into a single point cloud). The Reduce Noise operation is employed conservatively in the macro as it has a tendency to over-smooth potentially diagnostic morphologies. The Uniform Sample command was previously described and is not repeated in the macro. The Wrap function is the primary operation responsible for the transformation of the coordinate point cloud into a polygonal mesh surface model.
Morphometric Error Study
Linear (1D) Error Study. The resulting mean thread-pitch (known = 0.25 mm) from 30 measurements of the screw was 0.251 mm with a percent error of 0.4%. This slight overestimation is most likely attributed to the layer of ammonium chloride used to coat the object. The linear accuracy was calculated as ± 0.001 mm, and the repeatability was ± 0.0005 mm. With single micron scale accuracy, these results far surpass the manufacturer's stated claim of ± 0.00635 mm.
Surface Area (2D) Error Study. The resulting three area measurements taken from the scale bar (known = 1000 mm2) were: 998.04, 997.71, and 1002.67 mm2. The mean calculated surface area was 999.47 mm2 a percent error of 0.05%. The slight underestimation could partially be explained by an optical phenomenon that occurs at the edge of an object, when the angle of incidence of the laser plane exceeds 70 degrees from normal. This alters the perceived thickness of the laser line that makes it difficult for the software to delineate the true edge of the object. Because a single surface scan was used, this edge was most likely removed as noise in post-processing.
Volumetric (3D) Error Study. Both programs (Geomagic Studio 6.0 and 3D-Doctor) used to calculate the volume (known = 1000 mm3) of the three models of the scale bar yielded identical values per model: 1007.54, 1019.89, and 1026.15 mm3. The mean calculated volume was 1017.86 mm3 a percent error of 1.79%. The consistent slight overestimation is again most likely attributable to the ammonium chloride coating.
Casting Error Study
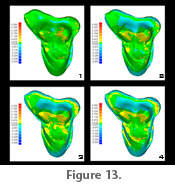 Comparison of the original specimen to the first generation cast showed the majority of the surface on the two models to be in correspondence, as illustrated by the green areas in
Figure 13.1. Areas of highest deviation were concentrated along the cusps and posterior margins of the tooth, and the maximum deviation was in the range of ± 0.018 mm to ± 0.073 mm. The second generation cast varied from the original specimen a maximum of ± 0.018 mm to ± 0.073 mm, with most of the variation around the cusps and the stylar shelf (Figure 13.2). With the third generation of molding/casting, increasing regions of negative relief (blue) appeared on the stylar shelf and peripheral margins of the tooth (Figure 13.3). The maximum deviation between the original and the third generation cast ranged from ± 0.073 mm to ± 0.128 mm. The fourth and final molding/casting generation showed a greater increase in negative deviation along the outer margins of the tooth (Figure 13.4). Compared to the original specimen, this model yielded a maximum deviation of ± 0.073 mm to ± 0.128 mm. Comparison of the original specimen to the first generation cast showed the majority of the surface on the two models to be in correspondence, as illustrated by the green areas in
Figure 13.1. Areas of highest deviation were concentrated along the cusps and posterior margins of the tooth, and the maximum deviation was in the range of ± 0.018 mm to ± 0.073 mm. The second generation cast varied from the original specimen a maximum of ± 0.018 mm to ± 0.073 mm, with most of the variation around the cusps and the stylar shelf (Figure 13.2). With the third generation of molding/casting, increasing regions of negative relief (blue) appeared on the stylar shelf and peripheral margins of the tooth (Figure 13.3). The maximum deviation between the original and the third generation cast ranged from ± 0.073 mm to ± 0.128 mm. The fourth and final molding/casting generation showed a greater increase in negative deviation along the outer margins of the tooth (Figure 13.4). Compared to the original specimen, this model yielded a maximum deviation of ± 0.073 mm to ± 0.128 mm.
|