Methods And Materials
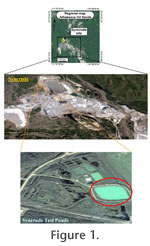 A study of thecamoebian assemblages was conducted on samples collected during the spring, summer, fall and winter from the Syncrude Demo Pond (Figure 1), a large-scale test pond on the Mildred Lake site (458352E, 6326665N) in northeastern Alberta. Demo Pond was chosen for this study because there has been relatively little change in its chemical constituents since its construction. It was constructed in 1993 in an excavation within the local clay overburden materials, with no recharge or discharge of either surface or ground waters. The small 4-Ha pond was originally filled with a soft tailings slurry, known as mature fine tails (MFT consisting of about 30 wt% solids and 1.5 wt% hydrocarbon), to a depth of up to 12 m, and then capped with about 3 m of non-process runoff water from the surrounding muskeg. In this typically steady state system impacts from NAs, salinity and oxygen demand maintain the benthic community under stress, but below the threshold for acute toxicity. The seasonal effects on this water body follow the seasonal cycle of a northern environment. The ice-cover period extends from November to April (ice thickness of 80-110 cm). Other than at the surface DO levels are low enough for the system to be anoxic, and DO levels within 5-10 cm of water are classified as anaerobic. This system provided an opportunity to test thecamoebian community response in a slightly stressed habitat to a range of seasonal environmental changes from climate factors, while maintaining a stable chemical environment. It has been argued that if seasonal changes are not significant in smaller aquatic environments that are subject to greater climate extremes, then they are not likely to be significant under more stable lacustrine environments (c.f.,
Scott and Medioli, 1980).
A study of thecamoebian assemblages was conducted on samples collected during the spring, summer, fall and winter from the Syncrude Demo Pond (Figure 1), a large-scale test pond on the Mildred Lake site (458352E, 6326665N) in northeastern Alberta. Demo Pond was chosen for this study because there has been relatively little change in its chemical constituents since its construction. It was constructed in 1993 in an excavation within the local clay overburden materials, with no recharge or discharge of either surface or ground waters. The small 4-Ha pond was originally filled with a soft tailings slurry, known as mature fine tails (MFT consisting of about 30 wt% solids and 1.5 wt% hydrocarbon), to a depth of up to 12 m, and then capped with about 3 m of non-process runoff water from the surrounding muskeg. In this typically steady state system impacts from NAs, salinity and oxygen demand maintain the benthic community under stress, but below the threshold for acute toxicity. The seasonal effects on this water body follow the seasonal cycle of a northern environment. The ice-cover period extends from November to April (ice thickness of 80-110 cm). Other than at the surface DO levels are low enough for the system to be anoxic, and DO levels within 5-10 cm of water are classified as anaerobic. This system provided an opportunity to test thecamoebian community response in a slightly stressed habitat to a range of seasonal environmental changes from climate factors, while maintaining a stable chemical environment. It has been argued that if seasonal changes are not significant in smaller aquatic environments that are subject to greater climate extremes, then they are not likely to be significant under more stable lacustrine environments (c.f.,
Scott and Medioli, 1980).
Samples from the sediment to water interface in Syncrude's Demo Pond were collected on May 21st, July 22nd, August 19th, September 30th 2008 and again on March 12th 2009 by employees of Syncrude Canada Ltd. Four replicates were collected in May and July, and three replicates were collected in August, September and March. The samples were taken using an Ekman grab or a corer, from a floating dock located in an area of the pond that was underlain by the MFT zone (Figure 2), water depths averaged 2.65 m. During each month of sampling, 2 surface samples (0-2 cm) were collected and the remaining samples were collected from between 5-15 cm in the core. The sediment samples were transferred to glass jars and were stored at 4°C prior to shipping to Brock University. At the same time, water samples from above the sediment were collected and transported to Syncrude Canada Ltd. (SCL) Edmonton Research facility. Water analysis was performed using SCL standard protocols (Syncrude, 2005). In addition, substrate samples were analyzed for solids, bitumen and particle size distribution using SCL methods.
Samples were prepared for thecamoebian analysis following the standard micropaleontological methods described in
Scott et al. (2001). Subsamples of 5cc were sieved through 500, 63 and 45µm mesh. Samples were stained with Rose Bengal to determine the presence of cytoplasm in tests (Scott and Medioli, 1980;
Bernhard, 2000). The assumption that tests stained using this method were living at the time of collection has been called into question (Bernhard et al., 2006). Since the Demo Pond has only existed since 1993, the problem of spuriously old stained tests is minimal, so the new technique proposed by Bernhard was not employed. For quantitative analysis, the samples were placed in a gridded Petri dish and wet counted using a dissecting binocular microscope. Thecamoebians were identified primarily using the key by
Kumar and Dalby (1998), although reference was also made to photoplates and descriptions in various publications, notably
Medioli and Scott (1983). Specimens were identified and species diversity was calculated using strains, because strains have been found to convey useful information on aquatic subenvironments (Kumar and Patterson, 2000;
Kauppila et al., 2006).
Species diversity was calculated using the Shannon-Weaver Diversity index (SDI) (Shannon and Weaver, 1949). Harsh, unfavorable environmental conditions are normally characterized with an SDI between 0.5 - 1.5, intermediate conditions rage from 1.5 - 2.5 and favorable/stable conditions have an SDI >2.5 (Patterson and Kumar, 2002). The SDI was calculated using the following formula, where S is the species richness for each sample:
The relative fractional abundance (Fi) was calculated for each taxonomic unit using:

where Ci is the species count, and Ni is the number of individuals (total population) in the sample (Patterson and Fishbein, 1989).
Data analysis was preformed using the computer program Minitab version 15 (Minitab Inc. USA). To examine the factors that influence thecamoebian taxon richness, linear regression analysis was preformed between the environmental variables and the independents (% difflugiid and % living) (Table 1).
Lower P-values indicate a higher degree of influence by the given variable on
the independent. Canonical Corrrespondence Analysis (CCA) was used to examine
the population relationships between thecamoebian taxa and the measured
environmental variables.
The coefficient of variance (CV) was used to calculate the variance among each parameter recorded for each month of study (Table 1), where s is the standard deviation and  is the mean. The coefficient of variance is a dimensionless measure of variability expressed as a fraction of the mean. When comparing between data sets with different units or widely different means the coefficient of variation generates comparable values unlike standard deviation. Similarity among a data set is expressed by lower covariant values (Davis, 2002).
