

 A CT-image-based framework for the holistic analysis of cortical and trabecular bone morphology
Article number: 17.3.33A
https://doi.org/10.26879/438
Copyright Palaeontological Association, October 2014
Author biographies
Plain-language and multi-lingual abstracts
PDF version
Submission: 8 November 2013. Acceptance: 31 August 2014
{flike id=889}
ABSTRACT
This study introduces a standardized framework for the holistic analysis of cortical and trabecular bone structure. This method, although applicable to all bones of the skeleton, is particularly useful for irregular-shaped or small bones for which the application of traditional methods has been especially challenging. Traditional analyses have quantified cortical or trabecular structure in only selected regions of a bone, such as single cross-sections of cortical bone or volumes of interest of trabecular structure in epiphyses. The proposed method improves on these traditional methods by visualizing and quantifying the internal bony structure throughout the entire bone and in user-defined anatomical subregions. Here, we describe and demonstrate the method using high-resolution microtomographic scans of a first metacarpal of an orangutan, gorilla, chimpanzee and human. Using automated morphological filters, the cortical bone is defined and extracted from the underlying trabecular structure to create two 3D models, one of the cortex and one of the trabecular bone that can be analysed separately. We test the sensitivity of the morphological parameters used to create these 3D models, demonstrating that the parameters defined here are robust and can provide accurate measures of cortical thickness, relative bone density, trabecular orientation, trabecular thickness and degree of anisotropy. This new, holistic method is able to reveal morphological and functional information about bone loading that is obscured or ignored using traditional methods, thus providing more informed interpretations of behaviour in extant and fossil taxa.
Thomas Gross. Institute of Lightweight Design and Structural Biomechanics, Vienna University of Technology, Gusshausstrasse 27-29, A-1040 Vienna, Austria. tgross@ilsb.tuwien.ac.at
Tracy L. Kivell. Department of Human Evolution, Max Planck Institute for Evolutionary Anthropology, Deutscher Platz 6, Leipzig 04103, Germany and School of Anthropology and Conservation, University of Kent, Marlowe Building, Canterbury CT2 7NR, UK. T.L.Kivell@kent.ac.uk
Matthew M. Skinner. Department of Human Evolution, Max Planck Institute for Evolutionary Anthropology, Deutscher Platz 6, Leipzig 04103, Germany and Department of Anthropology, University College London, 14 Taviton Street, London WC1H 0BW, UK. m.skinner@ucl.ac.uk
Huynh Nguyen. Department of Human Evolution, Max Planck Institute for Evolutionary Anthropology, Deutscher Platz 6, Leipzig 04103, Germany. nhu_nguyen@eva.mpg.de
Dieter H. Pahr. Institute of Lightweight Design and Structural Biomechanics, Vienna University of Technology, Gusshausstrasse 27-29, A-1040 Vienna, Austria. pahr@ilsb.tuwien.ac.at
Keywords: cancellous bone; locomotion; hominoid; metacarpal; functional morphology
Final citation: Gross, Thomas, Kivell, Tracy L., Skinner, Matthew M., Nguyen, N. Huynh, and Pahr, Dieter H. 2014. A CT-image-based framework for the holistic analysis of cortical and trabecular bone morphology. Palaeontologia Electronica Vol. 17, Issue 3;33A; 13p. https://doi.org/10.26879/438
palaeo-electronica.org/content/2014/889-holistic-analysis-of-bone
INTRODUCTION
Bone remodels throughout an individual’s lifetime by responding to principal stress trajectories, a concept broadly known as Wolff’s law (Wolff, 1892; Currey, 2002; Pearson and Lieberman, 2004) or bone functional adaptation (Ruff et al., 2006); bone may be removed where load is decreased and bone may be added where loads are increased. Cortical bone reacts to changes in loading conditions by variation in its cross-sectional geometry and density distribution (Currey, 2002; Ruff et al., 2006), while trabecular bone reacts to changes in load through changes in density, connectivity and orientation of the trabecular struts (Wolff, 1892; Currey, 2002). Trabecular bone remodels more quickly than cortical bone and therefore is commonly considered to provide more direct insight into how a bone and/or joint was loaded during life (Currey, 2002). Several in vivo experimental studies have demonstrated the response of trabecular bone to loading (e.g., Ponzter et al., 2006; Barak et al., 2011; but see Biewener et al., 1996). Although there is debate regarding the degree to which bone - especially cortical bone - can respond to load during different stages of ontogeny (Bertram and Swartz, 1991; Demes et al., 1998; Pearson and Lieberman, 2004; Ruff et al., 2006; Sinclair et al., 2013), analyses of variation in both cortical and trabecular bone are commonly used to determine risk of fracture in clinical situations (e.g., Singh et al., 1970; Mazess, 1990; Barrett-Connor et al., 2005) and to interpret function and locomotor behaviour in extant and fossil taxa (e.g., Fajardo and Müller, 2001; MacLatchy and Müller, 2002; Ruff, 2002; Ryan and Ketcham, 2002; DeSilva and Devlin, 2012; Ryan and Shaw, 2012).
More functionally informative methods of reconstructing behaviour from bony morphology are particularly important within the order Primates. Although extant primates are characterised by a wide range of locomotor behaviours, the mosaic morphologies of some fossil primate taxa suggest that many primates in our evolutionary history navigated their environments in ways that are unlike any extant analogue (Rose, 1986; Hartwig and Cartelle, 1996; Gebo et al., 1997; Madar et al., 2002; Begun and Kivell, 2011). Understanding the locomotor behaviours of different fossil primates has important implications for reconstructing our own evolutionary history (e.g., Stern, 1975; Richmond et al., 2001; Lovejoy et al., 2009), and we have been limited in the functional inferences that can be made from external morphology alone. This has led to longstanding debates regarding the locomotor behaviours of early fossil primates (e.g., Bloch and Boyer, 2002; Kirk et al., 2003), hominoids (e.g., Deane and Begun, 2008; Alba et al., 2010) and hominins (e.g., Ward, 2002) that remain unresolved. Investigation of internal bony structure and how it relates to locomotor behaviour in extant primates may offer a unique insight into reconstructing locomotor behaviours in the past.
Traditional methods of analyzing cortical bone have focused on analyzing a single slice of a CT image volume at specific parts of the bone (e.g., at midshaft). Mean thickness, cross-sectional area and second moment of area (Imax and Imin) are common parameters that are quantified in a slice and are used to interpret the strength or bending resistance of a bone (Ruff and Runestead, 1992; Ruff, 2002; Stock, 2006; Shaw and Stock, 2009). Analysis of these geometric properties is based on engineering beam theory and thus - even when only a midshaft slice is analysed (the area of maximum bending) - offers robust insight into the biomechanics of the bone structure. However, cortical thickness and density will vary throughout the bone and thus quantification of single slices may ignore or obscure underlying biomechanical signals or intra- or inter-specific variation. Quantification of cortical variation throughout the bone can provide additional, and perhaps biologically significant, information about bone strength and loading.
Traditional methods of analyzing trabecular bone have quantified trabecular structure in a specific volume (i.e., volume of interest, such as a sphere in the centre of the humeral head) from a CT image stack (Fajardo et al., 2001; Ryan and Ketcham, 2002; DeSilva and Devlin, 2012; Ryan and Shaw, 2012). Thus, due to anatomical and methodological limitations, only a specific region or volume of trabecular structure within an entire anatomical area can be considered. As such, there are several challenges associated with determining anatomically and/or biomechanically “homologous” volumes of interest across a sample, especially when morphology is complex or there is large degree of morphological and size variation (e.g., Maga et al., 2006; Lazenby et al., 2008; Kivell et al., 2011).
Although such methodological issues have been recognized by many researchers (e.g., Fajardo and Müller, 2001; Ryan and Ketcham, 2002; Maga et al., 2006), these traditional methods have remained the standard due to computational limitations and, in particular, a lack of alternative methods for analyzing cortical or trabecular bone structure. Furthermore, rarely are both cortical and trabecular bone structure analysed together in the same study even though both are critical to the biomechanical behaviour of the overall structure (Lazenby et al., 2008; Ryan and Shaw, 2012).
In this work, a recently proposed method (Pahr and Zysset, 2009a) is adapted to allow quantification of the entire cortical and trabecular morphology (cortical thickness and trabecular bone density, orientation and anisotropy) throughout a given bone - either locally (finite element-based) or averaged over certain anatomical regions. Via fully automated methods, the cortical shell can be separated from the internal trabecular structure and can be analyzed independently in order to provide a holistic functional interpretation of the bone in a graphical and numerical way. This method is applicable to all bones of the postcranial skeleton and, importantly, can be applied to any fossil specimen that sufficiently preserves the internal bony structure. Because this method also offers analyses of cortical and trabecular bone within user-defined anatomical areas, this method can be used both on complete and fragmentary fossil specimens.
METHODS
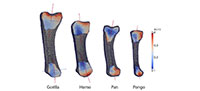
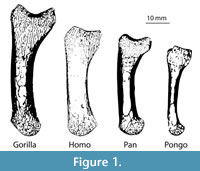 This study analyses one left first metacarpal from a male Homo sapiens, Gorilla gorilla, Pan troglodytes verus and female Pongo abelii (Figure 1). The first metacarpal from each of these taxa is used here as an example to demonstrate the method on a sample of bones that vary greatly in size and shape. However, the introduced framework can be used to analyze other bones of the hand and postcranial skeleton and is particularly useful for irregular-shaped or small bones for which the application of traditional methods has been especially challenging. All of the metacarpals in this study come from adult individuals and lack any indication of pathology or trauma. All nonhuman primate specimens came from the wild.
Each metacarpal was scanned with a high-resolution micro-computed tomographic (microCT) BIR Actis 300/225 scanner housed at the Department of Human Evolution, at the Max Planck Institute for Evolutionary Anthropology, Leipzig, Germany. The specimens were scanned at a voxel size ranging from 30-38 µm using an acceleration voltage of 130 kV and 110 µA and a 0.25 mm brass filter. Each image was reconstructed as a 2048 x 2048 16-bit TIFF image stack from 2500 projections and three frame averaging. Each metacarpal was reoriented into a standard anatomical position using Avizo 6.3® (Visualization Sciences Group, SAS). Each specimen was segmented into a binary image volume (.raw format) using the Ray Casting Algorithm (Scherf and Tilgner, 2009). Once segmented, the image volume of each specimen was processed using in-house scripts that we summarize in the following.
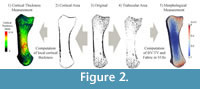 The whole procedure is based on the segmented microCT scan of each bone (Figure 2.3). Using different morphological filters (described below), the cortical area is identified and separated to create two three-dimensional (3D) images: one of the cortical bone (Figure 2.2) and one of the trabecular structure (Figure 2.4). The cortical thickness and trabecular morphology is then analyzed and visualized from these independent 3D images (Figure 2.1, 2.5). To accommodate variation in size and morphology across different species, mean trabecular thickness (Tb.Th.) of each specimen is used as the basis for all of the morphological filters.
Segmentation of Cortical and Trabecular Bone
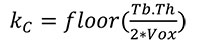
The first stage separates the cortical bone from the trabecular structure by creating an “outer mask” (i.e., the outer shell of cortical bone) and “inner mask” (i.e., the boundary between cortex and trabeculae). This is done in several steps because cortical bone can be slightly porous, and the boundary between “cortical” and “trabecular” bone must be defined. First, a morphological closing filter is applied to close small holes within the cortex and to smooth the cortical shell. The kernel of this closing filter denoted as kC (radius of a sphere in voxels) is defined as:
 |
(1) |
where Tb.Th. is the mean trabecular thickness of the specimen in mm (a value that can be acquired using BoneJ (Doube et al., 2010) or any other trabecular analytical software) and Vox denotes the voxel size of the scan in [mm/Voxel]. Thus, this step only closes pores or holes with a size less than one trabecula.
Second, the outer mask of the cortical bone for each metacarpal is obtained by following the procedure described in detail in Pahr and Zysset (2009a). Briefly, a combination of morphological “closing” and “opening” operations, together with a “region growing” function is used to create the outer mask. The outer mask kernel (kO) is defined in the same way as the kC, described above:
|
|
(2) |
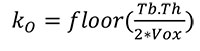
Third, the mask of the trabecular region (inner mask) is obtained in a similar way (Pahr and Zysset, 2009a) using morphological operations with an inner mask kernel (kI) of:
|
|
(3) |
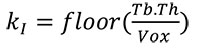
Finally, the cortical thickness mask is obtained by subtracting the inner from the outer mask. As a result, two 3D images are created for each metacarpal: one with only cortical bone (Figure 2.2) and one with only trabecular bone (Figure 2.4). The definitions of equations (1)-(3) can be used for any image resolution or anatomical bone for which a measure of Tb.Th. is possible.
Quantification of Cortical Thickness
The local cortical thickness measurement for each metacarpal is computed by applying the thickness computation algorithm from Hildebrand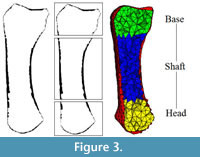 and Rüegsegger (1997) on the cortical images using ImageJ. The thickness at each point in the cortical shell is defined as the diameter of the greatest sphere that fits within the cortex and contains this point (Dougherty and Kunzelmann, 2007). This step is conducted using the BoneJ plugin (Doube et al., 2010).
Quantification of Trabecular Bone Morphology
Trabecular thickness is computed using the same thickness extraction algorithm (Hildebrand and Rüegsegger, 1997) as for the cortical thickness computation but applied within the trabecular region. The voxel-based segmentation of the cortical and trabecular bone areas (Figure 2.2, 2.4) is used to mesh (i.e., divide into finite elements) both of these regions. Isosurfaces between the cortex/air and cortex/trabecular regions are extracted. Based on these surface meshes, the volume of the cortex and the trabecular region are filled with tetrahedral elements using HyperMesh® (Altair Engineering Inc., USA; Figure 3 right). The mesh size is calculated based on the dimensions of the scan:
|
|
(4) |
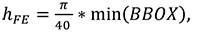
where hFE is the mesh size in mm and min(BBOX) is the smallest of the x, y and z lengths (in mm) of the bounding box in which the metacarpal fits. This formula leads to approximately 40 tetrahedral elements around the midshaft of the metacarpal. Mesh density could also be based on the specific geometry of each bone (e.g., bone length or breadth).
These finite element meshes are used to compute the bone density and fabric tensor information (orientation of the trabecular bone) within each element. A detailed description how this is calculated can be found in Pahr and Zysset (2009a). Briefly, the algorithm defines first a rectangular bounding box of the bone and divides this into rectangular cells creating a background grid (Figure 4). The size of each cell within the grid (hBG) is calculated as:
 |
(5) |
The local ratio of bone volume to total volume (BV/TV) and fabric tensor is then calculated at all corner nodes throughout the background grid. This is accomplished using spherical volume of interest - so-called sampling sphere (Figure 4) - with a diameter defined as:
 |
(6) |
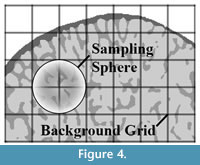 The size of the sampling sphere is defined by the underlying homogenization theory (as discussed in Pahr and Zysset (2008)) and is the smallest size that can obtain a meaningful quantification of trabecular structure. In the case of trabecular bone, this means that at least four structural features (trabeculae) have to be included in the VOI. Within each sampling sphere, BV/TV is quantified by counting the number of bone voxels, and the trabecular orientation is calculated using the Mean Intercept Length (MIL) method (Whitehouse, 1974). In a final step, the centroid for each bone finite element (Figure 3 right) is computed and, based on this position, the BV/TV and orientation are interpolated from the background grid using linear functions for each finite element. The results of these computations are shown in Figure 2.5.
Quantification of Cortical and Trabecular Bone in Specific Anatomical Regions
To investigate differences in cortical and trabecular bone morphology in specific anatomical regions, each metacarpal bone is divided into a base, shaft and head region (different colours in Figure 3) by manually defining the CT image slice number between each anatomical boundary. Mean cortical thickness is calculated by averaging the local thickness measurements within each region. Mean BV/TV is calculated by dividing the 3D mesh into the three anatomical regions and averaging the BV/TV of all elements within each specific region. Typical trabecular parameters, such as mean trabecular thickness, trabecular orientation, and degree of anisotropy are computed for each region, but are most relevant for the head and base since there are usually few trabeculae in the metacarpal shaft. Mean trabecular orientation is computed by summing up all second order fabric tensors and extracting the major, middle and minor directions. These directions are obtained by computing the eigenvectors of the averaged fabric tensor. The corresponding eigenvalues (λ1>λ2>λ3) are used for the definition of the degree of anisotropy DA =λ1/λ3.
Sensitivity of the Input Parameters
To check the sensitivity of the computed cortical and trabecular bone measurements using the chosen parameters defined above (i.e., the standard), we varied each of the parameters and repeated the analyses to compare with the standard results. The cortical thickness measurements are mostly affected by a change of morphological kernel size (kC, kI, kO), while BV/TV and trabecular orientation are dependent on the mesh density (hFE), the background grid (hBG) and the sampling sphere diameter (dROI). Therefore the closing, outer and inner kernel were changed by ± 1 and ± 2 voxels. The mean relative error for the thickness measurements was quantified by calculating the absolute deviation to the standard measurements in percent and averaging it over all four metacarpal specimens.
The mesh density was varied by ± 50% and the error in BV/TV was quantified by calculating the absolute deviation from the standard values in percent and averaging these values over the different specimens and anatomical regions. The error in trabecular orientation was quantified by calculating the local angle between the major orientations obtained by the standard and modified mesh densities. Since a sampling sphere diameter of dROI =5 mm is the lower limit for analyzing a trabecular bone volume of interest (see Pahr and Zysset, 2008) in our MC1 specimens, the sampling sphere was only enlarged (+50% and +100%) while the background grid size hBG was only coarsened (+50% and +100%). Again, the computed BV/TV and trabecular orientation measurements were compared to the standard measure.
RESULTS
Sensitivity Analysis
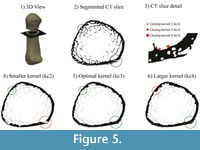 Measures of cortical thickness in the metacarpal shaft were only minimally affected (<4%) by variation of the kernel size (kC, kI, kO), while cortical thickness in the head and base regions, which are filled with trabeculae, showed a higher sensitivity (0-9.3%) to kernel size variation (Table 1). Variation of the inner and outer kernel size showed only small effects (0-4%) on the cortical thickness measurements in all regions (Table 1). In contrast, changes of the closing kernel had a substantial influence on the results with changes of up to >20%. The effect of different closing kernels on the extracted cortical area is explained in Figure 5.
An increase in grid distance hBG and sampling sphere size dROI by 50% and 100% led to a relative decrease in BV/TV in the range of 3% and 5% (Table 2). Variation of mesh density by ± 50% led to a 2% change in BV/TV values. The major trabecular orientation was slightly affected by a variation of grid distance, sample sphere size and mesh density; deviations from the standard angles were in the range of 0.0°-4.6° for all specimens and regions (Table 2).
 Results from the Standard Parameter Set
Results using the standard parameter set for each metacarpal and each anatomical region are presented in Table 3. These results are consistent with visual inspection of the original microCT scans (Figure 1). The overall cortical thickness throughout the entire metacarpal was found to be highest in Gorilla and Pan, thinnest in Homo, and Pongo was intermediate between African apes and Homo (Table 3).
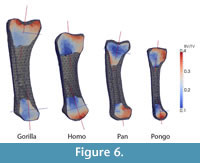
BV/TV differed greatly among the specimens (Table 3 and Figure 6). While the Homo, Pan and Pongo metacarpals had a nearly hollow shaft, Gorilla showed a BV/TV of 20% in the shaft region. Gorilla also had the highest trabecular density in the metacarpal head and base regions. In contrast, Homo had the lowest BV/TV in all regions. For all specimens, BV/TV was higher in the head than in the base region (Table 3). Trabecular thickness was higher in Gorilla, Pan and Pongo compared with Homo and across all of the specimens generally higher in the head than in the base region.
The major trabecular orientation defined as the angle relative to the proximodistal axis in the dorsopalmar plane was between 10.6° and 15.2° in the base (α) and between -0.7° and 1.9° in the head (β) for the Gorilla, Pan and Pongo specimens (Table 3 and Figure 6). Trabecular orientation in Homo was substantially different, with a larger angle in the head (11.8°) than in the base (3.3°). In general, the degree of anisotropy was higher in the base than in the head region for all specimens.
DISCUSSION
This work demonstrates an automated and holistic method for cortical and trabecular bone analysis in a standardized way. Morphological results revealed substantial interspecific variation in cortical and trabecular structure across the four metacarpals (Table 3) that are consistent with differences that can be visualized from the original microCT scans (Figure 1) and have important implications for understanding bone function. The biomechanical significance of this variation in internal bony morphology is not the focus of this study, and a sample size of n=1 prohibits any conclusions regarding functional or behavioural differences in first metacarpal use across great apes. This is the focus of current and future work by the authors. Though primate first metacarpals were used here as an example, the introduced method can be applied to other bones in the skeleton and is able to accommodate intra- and interspecific variation in size and morphology within a sample. This method is particularly useful for irregular-shaped joints (e.g., distal humerus) and bones (e.g., calcaneus), especially small bones (e.g., carpals or phalanges) for which sampling cortical and trabecular structure using traditional methods is especially challenging. As such, this new method provides greater morphological and functional information than traditional methods of cortical and trabecular bone analyses, which only quantify bony structure in selected regions of the bone. Using different morphological filters, the entire cortical area of each metacarpal can be identified and extracted, yielding a separate 3D model of the global cortical bone and the trabecular structure. Here, we divided the metacarpal into head, shaft and base, however, other anatomical regions could be defined and quantified (e.g., palmar portion of base), depending on the bone, its morphology and/or the goals of the analysis.
Sensitivity tests of the morphological filters used here revealed that selection of a meaningful, standardized kernel size is crucial for a comparable analysis of bones across different species since size and geometry can vary substantially. Therefore, all parameters used for morphological filters are based on the mean trabecular thickness of each specimen. Trabecular thickness is used as a standardizing measurement because it can be easily measured prior to the analyses (e.g., BoneJ; Doube et al., 2010) and logically helps to define the boundary between cortical and trabecular bone within each individual specimen. In other words, a meaningful inner and closing kernel size is directly connected to the trabecular thickness and trabecular spacing near the cortical shell. A closing kernel that is too large will close the gap between single trabeculae in the proximity of the cortical shell leading to an increased computed cortical thickness. In contrast, a kernel size that is too small will not close the cortical porosity, which results in a reduced cortical thickness (Figure 5). While variation of the inner and outer kernel had a small effect on the quantification of the cortical thickness, variation of the closing kernel had a stronger influence. In extreme cases, selection of a kernel that is too large or too small led to a >20% error in cortical thickness. Therefore, we used equations (1), (2) and (3) to compute an optimal kernel size for each specimen for the extraction of the cortical area and to yield comparable results across the study sample. Since computation of optimal kernel size is based on voxel size, the cortical separation procedure is not dependent on image resolution.
However, specimens with a high cortical porosity and large pores may be a potential limitation of the automated framework. If the cortex contains large pores, which can not be closed by the initial closing filter, the resulting cortical thickness measurements will be affected by the remaining cortical porosity. This would lead to a small decrease in cortical thickness at regions with unclosed pores. In order to avoid such a decrease, a second closing filter with a larger kernel would have to be applied to the cortical image prior to the cortical thickness measurement procedure.
Besides the herein described cortical/trabecular separation method, a variety of other cortical extraction algorithms exists (Buie et al., 2007; Lublinsky et al., 2007). In general, different methods could be used for the cortical bone separation step. However, sensitivity of the extraction algorithm has to be verified. Furthermore, quantitative comparison between different specimens can only be performed if the analyses are based on the same cortical extraction procedure.
In the separated 3D model of the trabecular structure, BV/TV and trabecular orientation were quantified throughout the entire bone using local (finite element-based) or averaged-based measures within subregions of the bone. Trabecular thickness and degree of anisotropy were also quantified within each anatomical subregion in this study, but other standard trabecular parameters (e.g., trabecular spacing) provided in BoneJ (Doube et al., 2010) could also be quantified. Sensitivity analysis showed that modeling the metacarpal bones by different mesh densities (i.e., varying the number of elements used in the mesh) had a minimal effect on the BV/TV and major trabecular orientation.
The sampling sphere diameter dROI and the grid distance hBG (Figure 4) were chosen with 5 mm and 2.5 mm, respectively. These parameters were not changed for the analyses of our samples since a decrease in sphere size does not provide a meaningful quantification of trabecular structure (based on homogenization theory; see Pahr and Zysset, 2008) and an increase leads to a reduction of details and different results (Table 3). However, for smaller bones with thinner trabeculae and narrower trabecular spacing, smaller sphere diameters might be applicable.
The evaluation of the four test specimens in this analysis demonstrates that, despite substantial differences in size, shape and cortical and trabecular features (Figure 1), automatic holistic measurements of cortical and trabecular bone parameters can be obtained with the introduced framework. The same methods can be applied to CT data of both extant and fossil specimens, including fragmentary fossils, for which segmentation of the internal structure is possible (e.g., resolution of the scan is high enough to visual trabecular structure for a given bone or fossilized trabecular structure can be segmented from included matrix). The holistic aspect of this approach can highlight variation, and particularly subtle variation, in cortical and trabecular structure that cannot be quantified or is ignored using traditional methods. Thus, more biomechanical information about how the bone is loaded during life is available, which can provide more informed reconstructions of function and behaviour in extant and fossil primates. In addition to relatively small skeletal elements, such as hand bones, larger bones of any mammalian taxon (fossil or extant) could be analyzed using the same methods.
The purpose of this study is to introduce a methodological framework for cortical and trabecular bone analysis in a standardized and comprehensive way. This method provides a novel, holistic insight into internal bony structure that ultimately provides a better understanding of how a bone was loaded during life. In the future, this methodology could be extended using geometric morphometrics to allow site-specific comparisons of morphology across different individuals or species.
ACKNOWLEDGEMENTS
This research is supported by J-J Hublin (Department of Human Evolution, Max Planck Institute for Evolutionary Anthropology and the Max Planck Society. We thank V. Volpato (Senckenberg Museum Frankfurt), F. Mayer and S. Jancke (Museum für Naturkunde Berlin), and M. Teschler-Nicola (Naturhistorisches Museum Wien) for access to specimens and to P. Schönfeld for scanning.
Author Contributions
TG did the data analysis, TG and DHP adapted the software designed by DHP. TG, DHP, TLK, MMS and NHN wrote the manuscript.
REFERENCES
Alba, D.M., Almecija, S., and Moya-Sola, S. 2010. Locomotor inferences in Pierolapithecus and Hispanopithecus : Reply to Deane and Begun. Journal of Human Evolution, 59:143-149.
Barak, M.M., Lieberman, D.E., and Hublin, J-J. 2011. A Wolff in sheep’s clothing: Trabecular bone adaptation in response to changes in joint loading orientation. Bone, 49:1141-51.
Barrett-Connor, E., Siris, E.S., Wehren, L.E., Miller, P.D., Abbott, T.A., Berger, M.L., Santora, A.C., and Sherwood, L.M. 2005. Osteoporosis and fracture risk in women of different ethnic groups. Journal of Bone and Mineral Research, 20:185-194.
Begun, D.R. and Kivell, T.L. 2011. Knuckle-walking in Sivapithecus ? The combined effects of homology and homoplasy with possible implications for pongine dispersals. Journal of Human Evolution, 60:158-170.
Bertram, J.E.A. and Swartz, S.M. 1991. The “law of bone transformation”: a case of crying Wolff? Biological Reviews of the Cambridge Philosophical Society, 66:245-273.
Biewener, A.A., Fazzalari, N.L., Konieczynski, D.D., and Baudinette, R.V. 1996. Adaptive changes in trabecular architecture in relation to functional strain patterns and disuse. Bone, 19:1-8.
Bloch, J.I. and Boyer, D.M. 2002. Grasping primate origins. Science, 298:1606-1610.
Buie, H.R., Campbell, G.M., Klinck, J.R., MacNeil, J.A., and Boyd, S.K. 2007. Automatic segmentation of cortical and trabecular compartments based on a dual threshold technique for in vivo micro-CT bone analysis. Bone, 41:505-515.
Currey, J.D. 2002. Bones: Structure and Mechanics . Princeton, Princeton University Press.
Deane, A.S. and Begun, D.R. 2008. Pierolapithecus locomotor adaptations: a reply to Alba et al.’s comment on Deane and Begun. Journal of Human Evolution, 59:150-154.
Demes, B., Stern, J.T., Hausman, M.R., Larson, S.G., McLeod, K.J., and Rubin, C.T. 1998. Patterns of strain in the macaque ulna during functional activity. American Journal of Physical Anthropology, 106:87-100.
DeSilva, J.M. and Devlin, M.J. 2012. A comparative study of trabecular bone architecture in humans, nonhuman primates and Australopithecus. Journal of Human Evolution, 63:536-551.
Doube, M., Kłosowski, M.M., Arganda-Carreras, I., Cordeliéres, F., Dougherty, R.P., Jackson, J., Schmid, B., Hutchinson, J.R., and Shefelbine, S.J. 2010. BoneJ: free and extensible bone image analysis in ImageJ. Bone, 47:1076-9.
Dougherty, R. and Kunzelmann, K. 2007. Computing local thickness of 3D structures with ImageJ. Microscopy and Microanalysis, 13:1678-1679.
Fajardo, R.J. and Müller, R. 2001. Three-dimensional analysis of nonhuman primate trabecular architecture using micro-computed tomography. American Journal of Physical Anthropology, 115:327-336.
Gebo, D.L., MacLatchy, L., Kityo, R., Deino, A., Kingston, J., and Pilbeam, D. 1997. A hominoid genus from the early Miocene of Uganda. Science, 276:401-404.
Hartwig, W.C. and Cartelle, C. 1996. A complete skeleton of the giant South American primate Protopithecus. Nature, 381:307-310.
Hildebrand, T. and Rüegsegger, P. 1997. A new method for the model-independent assessment of thickness in three-dimensional images. Journal of Microscopy, 185:67-75.
Kirk, E.C., Cartmill, M., Kay, R.F., and Lemelin, P. 2003. Comment on “Grasping primate origins.” Science, 300:741.
Kivell, T.L., Skinner, M.M., Lazenby, R.A., and Hublin, J-J. 2011. Methodological considerations for analyzing trabecular architecture: An example from the primate hand. Journal of Anatomy, 218:209-225.
Lazenby, R.A., Cooper, D.M.L., Angus, S., and Hallgrímsson, B. 2008. Articular constraint, handedness, and directional asymmetry in the human second metacarpal. Journal of Human Evolution, 54:875-885.
Lazenby, R.A., Skinner, M.M., Kivell, T.L., and Hublin, J-J. 2011. Scaling VOI size in 3D micro-CT studies of trabecular bone: A test of the over-sampling hypothesis. American Journal of Physical Anthropology , 144:196-203.
Lovejoy, C.O., Suwa, G., Simpson, S.W., Matternes, J.H., and White, T.D. 2009. The Great Divides: Ardipithecus ramidus reveals the postcrania of our last common ancestors with African Apes. Science, 326:73-106.
Lublinsky, S., Ozcivici, E., and Judex, S. 2007. An automated algorithm to detect the trabecular-cortical bone interface in micro-computed tomographic images. Calcified Tissue International, 81:285-293.
MacLatchy, L. and Müller, R. 2002. A comparison of the femoral head and neck trabecular architecture in Galago and Perodictious using micro-computed tomography. Journal of Human Evolution, 43:80-105.
Madar, S.I., Rose, M.D., Kelley, J., MacLatchy, L., and Pilbeam, D. 2002. New Sivapithecus postcranialspecimens from the Siwaliks of Pakistan. Journal of Human Evolution, 42:705-752.
Maga, M., Kappelman, J., Ryan, T.M., and Ketcham, R.A. 2006. Preliminary observations on the calcaneal trabecular microarchitecture of extant large-bodies hominoids. American Journal of Physical Anthropology, 129:410-417.
Mazess, R.B. 1990. Fracture risk: A role of compact bone. Calcified Tissue International, 47:191-193.
Pahr, D.H. and Zysset, P.K. 2008. Influence of boundary conditions on computed apparent elastic properties of cancellous bone. Biomechanics and Modeling in Mechanobiology, 7:463 - 476.
Pahr, D.H. and Zysset, P.K. 2009a. From high-resolution CT data to finite element models: development of an integrated modular framework. Computer Methods in Biomechanics and Biomedical Engineering , 12:45-57.
Pahr, D.H. and Zysset, P.K. 2009b. A comparison of enhanced continuum FE with micro FE models of human vertebral bodies. Journal of Biomechanics, 42:455-462.
Pearson, O.M. and Lieberman, D.E. 2004. The aging of Wolff ’s ‘‘law:’’ ontogeny and responses to mechanical loading in cortical bone. American Journal of Physical Anthropology, 47:63-99.
Ponzter, H., Lieberman, D.E., Momin, E., Devlin, M.J., Polk, J.D., Hallgrímsson, B., and Cooper, D.M.L. 2006. Trabecular bone in the bird knee responds with high sensitivity to changes in load orientation. Journal of Experimental Biology, 209:57-65.
Richmond, B.G., Begun, D.R., and Strait, D.S. 2001. Origin of human bipedalism: the knuckle-walking hypothesis revisited. American Journal of Physical Anthropology, 33:70-105.
Rose, M.D. 1986. Further hominoid postcranial specimens from the Late Miocene Nagri formation of Pakistan. Journal of Human Evolution 15:333-367.
Ruff, C.B. 2002. Long bone articular and diaphyseal structure in Old World monkeys and apes, I: locomotor effects. American Journal of Physical Anthropology, 119:305-342.
Ruff, C., Holt, B., and Trinkaus, E. 2006. Who’s afraid of the big bad Wolff? “Wolff’s law” and bone functional adaptation. American Journal of Physical Anthropology, 129:484-498.
Ruff, C. and Runestead, J.A. 1992. Primate limb bone structural adaptations. Annual Review of Anthropology, 21:407-433.
Ryan, T.M. and Ketcham, R.A. 2002. Femoral head trabecular structure in two omomyid primates. Journal of Human Evolution, 43:241-263.
Ryan, T.M. and Shaw, C.N. 2012. Unique suites of trabecular bone features characterize locomotor behaviour in human and non-human anthropoid primates. PlosONE, 7:e41037.
Scherf, H. and Tilgner, R. 2009. A new high-resolution computed tomography (CT) segmentation method for trabecular bone architectural analysis. American Journal of Physical Anthropology, 140:1096-8644.
Shaw, C.N. and Stock, J.T. 2009. Intensity, repetitiveness, and directionality of habitual adolescent mobility patterns influence the tibial diaphysis morphology of athletes. American Journal of Physical Anthropology, 140:149-159.
Sinclair, K.D., Farnsworth, R.W., Pham, T.X., Knight, A.N., Bloebaum, R.D., and Skedros, J.G. 2013. The artiodactyl calcaneus as a potential “control bone” cautions against simple interpretations of trabecular bone adaptation in the anthropoid femoral neck. American Journal of Physical Anthropology, 64:366-379.
Singh, M., Nagrath, A.R., and Maini, P.S. 1970. Changes in trabecular bone of the upper end of the femur as an index of osteoporosis. Journal of Bone and Joint Surgery, 52:457-467.
Stern, J.T., 1975. Before bipedality. American Journal of Physical Anthropology, 19:59-68.
Stock, J.T. 2006. Hunter-gatherer postcranial robusticity relative to patterns of mobility, climatic adaptation and selection for tissue economy. American Journal of Physical Anthropology, 131:194-204.
Ward, C.V. 2002. Interpreting the posture and locomotion of Australopithecus afarensis : where do we stand? American Journal of Physical Anthropology, 35:185-215.
Whitehouse, W.J. 1974. The quantitative morphology of anisotropic trabecular bone. Journal of Microscopy, 101:153-168.
Wolff, J. 1892. Das Gesetz der Transformation der Knochen. Berlin, A. Hirchwild.
