

 An analysis of fossil identification guides to improve data reporting in citizen science programs
Article number: 23(1):a19
https://doi.org/10.26879/901
Copyright Society for Vertebrate Paleontology, April 2020
Author biographies
Plain-language and multi-lingual abstracts
PDF version
Submission: 23 June 2018. Acceptance: 7 April 2020.
ABSTRACT
An increasing number of organizations use untrained volunteers to gather scientific data. This citizen science movement builds enthusiasm for science by engaging the public, as well as providing a way to gather large amounts of data at little or no expense. The challenge of citizen science is obtaining accurate information from participants.
Many citizen science programs encourage participants to use visual identification guides to ensure they provide correct data. Identifying an image style that increases correct identifications helps not only the citizen science movement but also scientific instruction in general. This study tests three image-based identification guides for identifying late Hemphillian (5-4.5 m.y.a.) fossils from Polk County, Florida. Each guide has identical layout and text, differing only in image style: color photos, grayscale photos, or illustrations. Untrained participants each use one guide to identify fossils. Geology and paleontology professionals also identify fossils for comparison. Comparing results reveals that color photographic images produce results most similar to data from professionals.
In addition, participants provide data on their years of education, previous experience finding fossils, and enthusiasm about finding fossils. Analysis of this information reveals that participants with higher education and/or previous experience finding fossils produce data most similar to that from professionals. Paradoxically, participants with higher enthusiasm produce data less similar to that from professionals, while moderate interest levels correlated with greater similarity.
Dava K. Butler. Montana State University, Bozeman, Montana, USA. davakb@gmail.com
Donald A. Esker. Department of Petroleum Engineering and Geology, Marietta College, Marietta, Ohio 45750, USA. eskerd@marietta.edu
Kristopher L. Juntunen. Department of Chemistry, Geoscience, and Physics, Tarleton State University, Stephenville, Texas 76402, USA. juntunen@tarleton.edu
Daniel R. Lawver. Department of Anatomical Sciences, Stony Brook University, Stony Brook, New York 11787, USA, and Montana State University, Bozeman, Montana 59717, USA. danlawver@gmail.com
Keywords: paleontology; fossils; citizen science; outreach; identification guide; science education
Butler, Dava K., Esker, Donald A., Juntunen, Kristopher L., and Lawver, Daniel R. 2020. An analysis of fossil identification guides to improve data reporting in citizen science programs. Palaeontologia Electronica, 23(1):a19. https://doi.org/10.26879/901
palaeo-electronica.org/content/2020/3010-analysis-of-fossil-id-guides
Copyright: April 2020 Society of Vertebrate Paleontology.
This is an open access article distributed under the terms of the Creative Commons Attribution License,
which permits unrestricted use, distribution, and reproduction in any medium, provided the original author and source are credited.
creativecommons.org/licenses/by/4.0
INTRODUCTION
An increasing number of museums and research groups gather data through citizen science, also known as public participation, community participation, or crowd sourcing. This citizen science movement builds enthusiasm for science by engaging the public, as well as providing a way to gather large amounts of information at little or no expense. The disciplines best known for citizen science are ornithology, paleontology, astronomy, and meteorology (Bonney et al., 2009). The National Audubon Society famously relies on citizen scientist reports during the Christmas Bird Count, which began in 1900, making it one of the oldest citizen science programs still operating (Tulloch et al., 2013). Many museums, such as the Florida Museum of Natural History, connect with amateur paleontology clubs to recruit assistants for professional paleontologists conducting fieldwork (MacFadden et al., 2016).
Relying on untrained persons to collect data presents a special challenge. Citizen scientists may identify the specimens they observe incorrectly (Cohn, 2008). These data errors may compromise research, and in fact, articles that rely on data provided by citizen science receive fewer citations than articles that collect data through conventional means (Tulloch et al., 2013). Increasing the accuracy of data from untrained persons may make citizen science a viable option for more research programs.
The purpose of this study is to answer the question of which image style produces the highest percentage of correct species identifications by untrained persons. Finding an image style that increases accuracy helps not only the citizen science movement but also scientific instruction in general. In addition, this study addresses questions of how to choose volunteers by identifying minimum education, experience, and interest levels needed to produce usable data.
BACKGROUND
Science instruction frequently relies on identification guides, also called field guides. Students and professionals alike use these visual keys to identify species, constellations, and even geologic formations. Species identification may be one of the most popular uses, evidenced by the variety of commercially available books for identifying plants and animals (Randler, 2008).
Citizen science programs often require participants to identify species in the field or in a lab setting. A number of pilot studies suggest non-professionals can provide data comparable to professionals. For instance, Elbroch et al. (2011) document a tracker in Karoo National Park, South Africa, who provides accurate information about animal movement. Similarly, Vianna et al. (2014) find that diving guides in Micronesia report shark numbers that mirror the data provided by acoustic telemetry tracking tagged sharks in the area. In fact, the authors speculate the diver metric may be more accurate, as they count untagged populations as well. The Cornell Laboratory of Ornithology uses data from participants as young as middle school students (Bonney et al., 2009).
User-friendly guides facilitate species identification. Little research thus far investigates identification guides under controlled conditions. Testing variables to improve their effectiveness benefits everyone who uses identification guides--professionals, students, and hobbyists.
Identification guides typically rely on one of three visual styles: color photos, grayscale photos, or illustrations. Many consider illustrations the most reliable. Scientific illustrators argue that photographs may emphasize extraneous details, while illustrators include only the most relevant details (Monoyios, 2011). Anecdotal evidence supports this assertion. For instance, bird monitoring is one of the common types of citizen science programs, used by the National Audubon Society and the Cornell Laboratory of Ornithology (Bonney et al., 2009). Bestselling bird guides often rely on illustrations. The Sibley Guide to Birds, by the National Audubon Society, uses color plates of David Allen Sibley’s bird paintings for identification (Sibley, 2000). Similarly, the Peterson Field Guide to Birds of North America relies on color plates of paintings (Peterson, 2008). Artists who paint birds typically choose to emphasize diagnostic features that photos might obscure. Use of paintings is not universal in illustrated identification guides, however. For instance, Sharks of the Atlantic and Gulf Coasts from Maine to Texas (Kells, 2018) uses color sketches of sharks with corresponding ink outlines of each species’ tooth morphology. Many guides to fossil shark teeth similarly rely on illustrations. The Maryland Geological Survey (1904) uses sketches to illustrate Miocene shark teeth, while McKinzie, Morin, and Swiatovy of the Dallas Paleontological Society (2001) use sketches to supplement grayscale photographs of Late Cretaceous shark teeth.
Research from the University of Kent questions the usefulness of scientific illustration (Austen et al., 2016). That study compiles pairs of illustrations of bumblebees from popular guides. Participants view each pair and answer whether the illustrations depict the same species. Random guessing would produce a 50% success rate. Participants working in bee conservation have a 57% success rate, while untrained persons have a 54% success rate, showing their “overall accuracy did not differ on this task.” The authors state that errors resulting from flawed guides raise concerns for scientific research and suggest systematic study of identification guides.
Photographs are an alternative to scientific illustrations. As with illustrations, research into the effectiveness of photos in identification guides is scant. Randler and Zehender (2006) compare two groups of students, one using commercial identification guides with color photos and sketches and another using a dichotomous key with grayscale photos. Each group uses their assigned guide or key to identify reptile models to genus and species. The team finds no statistical difference between the success rates of the two groups. In later research, Randler (2008) tests guides with color photos against non-illustrated dichotomous keys to help students identify animal tracks and traces. He notes that students with color photo guides tend to focus on photos rather than any text, but they enjoy higher rates of both correct identifications and retention of what they learned.
Identification guides have a long history in science, but inquiry into their effectiveness is relatively recent. Only a few studies investigate the benefits of visual identification guides. The use of illustrations relies on anecdotal evidence. Answering the question of which image style is most helpful in identifying species requires systematic study in controlled settings.
METHODS
Ethics Statement
The Montana State University Institutional Review Board for the Protection of Human Subjects approved the research for this study. All research took place in commonly accepted educational settings. Participation was voluntary, with no financial or academic reward made to participants. Each participant, as well as parents in the case of minors, signed a consent form.
Participant Selection
Two pools of participants took part in the study, eighth grade students and a staff member at La Vega Junior High in Waco, Texas, USA, and teens and parents from Girl Scout Troop 1587 in Pflugerville, Texas, USA. The youngest participants were 14 years old. Some of the parents in the Girl Scout group have advanced college degrees, although none holds degrees in geology or paleontology. Participant responses are anonymous.
To test whether the untrained participants report accurate data, this study requires a comparison group, trained participants with years of experience successfully identifying fossils. Authors Dava Butler, Donald Esker, and Kristopher Juntunen serve as the comparison group. Dava Butler, then a graduate student at Montana State University, has seven years of experience sorting Peace River fossils with students during education programs in a museum setting. Donald Esker, a vertebrate paleontologist then at Baylor University, has two years of experience sorting Peace River fossils during educational programs in a museum setting. Kristopher Juntunen, then a graduate student at Tarleton State University, has three years of experience sorting fossils from other formations while instructing undergraduate geology and paleontology lab exercises.
 Selection of the Fort Meade Microsite
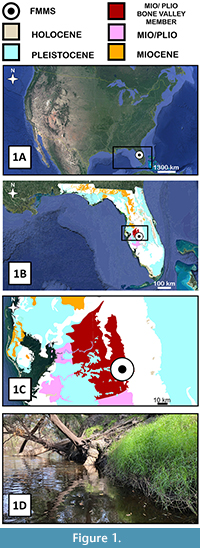
The Cornell Laboratory of Ornithology recommends gathering large amounts of data to compensate for over- and under-reporting of certain species (Bonney et al., 2009). Testing fossil identification guides requires large numbers of fossils. Microsites, deposits that produce small fossils of numerous taxa in large numbers, suit this purpose. Choosing a microsite with fossils from charismatic animals, such as sharks, makes recruitment of participants easier. For these reasons, this study used sediments from a microsite in Fort Meade, Florida, USA, which Fred Mazza provided under permit #3155 from the State of Florida (Figure 1).
The Fort Meade Microsite (FMMS) is located ~4 km SSE of Fort Meade, Florida, at +27.720°/-81.794°. The surface consists of ~2 m of the Bradenton soil, a coarse-loamy, siliceous, forested soil with a high water table (NCSS 2003; US Dept. of Agriculture, 2017). The channel cut by the Peace River exposes ~1.5 m of the Bone Valley Member of the Upper Miocene Peace River Formation (Scott et al., 2001; USGS, 2012). 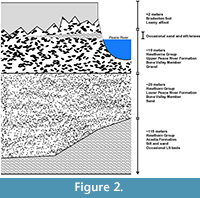 The riverbed contains reworked, gravel-sized clasts of phosphate ore, reworked Miocene marine fossils, and terrestrial fossils weathering out of Pleistocene alluvium above the Peace River Formation (Figure 2). The Miocene component of this assemblage is the Palmetto Fauna. This assemblage includes large concentrations of gastropods and small boring bivalves, a significant number of chondrichthyan teeth, and small concentrations of teleost fish, freshwater tetrapod, and terrestrial tetrapod remains (Behrensmeyer and Turner, 2017). This mix of terrestrial and marine fossils, along with the small size of many of the chondrichthyan teeth, probably indicates an estuarine paleoenvironment (Means, 2016). Paleontological research of this fauna began in the late 1800s, and over the next century, knowledge of its marine components became well documented, with new terrestrial mammals still being discovered (Wallace and Hulbert, 2013).
Data Collection
This study requires creating three guides for identifying fossils from the Peace River Formation, each with the same layout, printed on US legal size paper (Appendix 1, Appendix 2, Appendix 3). To aid identification, the guides present images arranged by morphology (Randler, 2008). Images depict specimens at 1:1 scale to aid identification. In the cases of specimens smaller than ~4 mm, offset, magnified images provide more detail. Each guide also has the same text, using a sans-serif font at high contrast. Diagnostic details and critical instructions were highlighted by light, vibrant blue text, as this color is accessible to most individuals with color deficiencies (Liu, 2010). The identification guides use common names to be more accessible to novices, and they describe diagnostic features in common terms. The authors give special consideration to †Otodus megalodon, well-known to the public due to recent popular culture and media portrayals. To reduce the likelihood of cognitive bias, and to be consistent with the common names used on all other species, the guides label †O. megalodon as “extinct mackerel shark.”
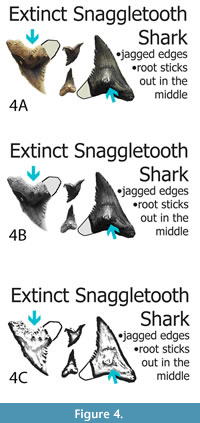
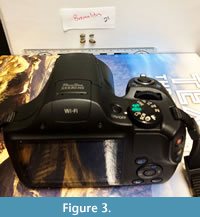 The only variable on the identification guides is the image style: color photograph, grayscale photograph, or illustration. All images in the identification guides derive from digital photographs taken with a Canon PowerShot SX530 HS digital camera, using the macro image setting, under artificial light. Fossil specimens and a photographic scale were mounted to a vertical, white background with a temporary adhesive, which caused no damage to specimens (Figure 3). Digital photographs were cropped and resized in Photoshop 6.0 to produce the initial color images. Desaturation and contrast-increasing filters converted the color image set to the grayscale image set. Other filters within the software converted the same color image set to simulate ink outlines and shading. While the authors can produce actual ink sketches, these are unsuitable for this test. Hand-drawn sketches may vary from photographs in shape or detail, introducing a variable to the study. By altering the same initial images, the shapes and their layout are consistent on each iteration of the identification guide (Figure 4).
 A secondary goal is to identify prerequisites that might help researchers recruit productive citizen scientists. To test whether participants interested in fossils identify them more accurately, participants answered a survey, recording each one’s prior education, interest in fossils, and experience finding fossils (Appendix 4).
Three of the authors served as the comparison group. Each sorted one liter of sediment and then identified fossils by literature review. After the study, the Florida Museum of Natural History (FLMNH) in Gainesville, Florida, USA, received the specimens. FLMNH Invertebrate Paleontology Accession Number 2764 designates the invertebrate and ichnological portion of the specimens, and AN 2020.01.17 designates the vertebrate portion of the specimens. FLMNH assigned the locality number Peace River 18A to the Fort Meade Microsite.
Dava Butler conducted the citizen science labs with La Vega Junior High on 3 May 2018 and with Girl Scout Troop 1587 on 6 May 2018. At both locations, participants divided into three groups, each group testing one of the identification guides. Participants received approximately 120 ml of sediment, a disposable sorting tray, pencil, 4× magnification lenses, identification guide, and data sheet. Butler instructed participants to use their identification guide like a place mat to sort fossils into piles on a corresponding image. Butler recorded notes of participant behavior while they worked. After 20 minutes, participants recorded the quantities of fossils they found onto the data sheet (Appendix 5). After submitting data sheets, Butler identified specimens for any participants who wanted additional information. Because the sediment was contributed for educational purposes, participants had the option to keep their fossils and guides at the end of the session or donate them to FLMNH. All participants opted to keep their finds.
The authors coded participants by groups for statistical analysis. The C Group, participants C01-C12, tested the color photo guides. The G Group, participants G01-G13, tested the grayscale photo guides. The I Group, participants I01-I12, tested the illustration guides. The results do not include responses from participant I09 due to incomplete survey information.
Statistical Methods
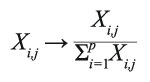
For simplicity, this study defines “accuracy” as quantitative, statistical resemblance to data produced by the authors. During the lab, participants produced a list of absolute abundance of each fossil taxon in a sample of sediment. The authors examined one-liter samples in which they identified 438 to 566 fossils each, while the participants received 120 ml and identified 8 to 48 fossils each (Appendix 6). The authors compiled data into an absolute abundance matrix of n rows of sediment samples and p columns of fossil taxa. To correct for sample size differences, the absolute abundance matrix was converted to a relative abundance matrix by dividing the absolute abundance of each taxon in a sample by the total number of fossils found in that sample. Each cell in the matrix is given as Xi,j where X is the relative abundance of taxon i in participant j’s sample (Equation 1).
1
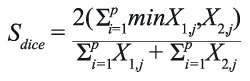
The relative abundance matrix allowed the authors to calculate the similarity of each participant’s sample to their own through Q-mode analysis using the paleontological statistics package PAST (Hammer et al., 2001). This study uses two similarity coefficients: the Dice similarity coefficient, Sdice, and the Bray Curtis similarity index Sbc (Dice, 1945; Bray and Curtis, 1957). Dice is used to calculate the similarity of presence/absence data, while the Bray Curtis method uses relative abundance. Both minimize the influence of outliers that are common where children are involved (Digby and Kempton, 1987). These coefficients also assign less weight to matching zeros, which are common in small samples. When calculating Dice similarity (Sdice), PAST automatically converts the relative abundance matrix into a binary presence/absence matrix. The equation for the Dice similarity coefficient is:
2
The equation for calculating the Bray Curtis index is:
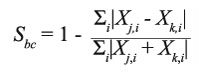
3
Combining participants into populations based on guide used, education, experience, and interest allow investigation into how these factors affect the data they produced. This analysis requires an n by p relative abundance matrix where p still represents the taxa, but n now represents the averages for color photography guides, grayscale photography guides, illustration-based guides, and the authors’ findings respectively. Xi,j for each cell now represents average relative abundance X for taxa i in guide-type j. An n by n similarity matrix was used to determine which version of the guide produced the closest match to the authors’ in terms of presence/absence (Sdice) and relative abundance (Sbc). The result is a list of similarities for each population to the authors’ “correct” answers. Rerunning the analysis with truncated means for each population ensures outliers do not over-influence the results. This secondary analysis removes the sample data for the participants with the highest and lowest Sdice or Sbc coefficients with the authors and then re-averages the results.
Cluster analysis turns the similarity data into dendrograms, which shows which samples are most similar to which others. Dendrograms are produced recursively by PAST using Unweighted Pair-Group Method Arithmetic (UPGMA) averaging method (Alroy and Hunt, 2010). PAST produces dendrograms that show the similarity of all samples simultaneously. Samples that join with the authors’ samples higher up the tree are more similar to the correct results than those that join further down. PAST also was used to produce bar charts showing the Sdice and Sbc similarity between data produced by each population of participants and that produced by the authors. Finally, PAST produces tables showing the mean similarity of participants’ samples in each population (guide used, education, experience, and interest) versus the average score of the authors, with both complete and truncated data sets.
RESULTS
Paleontological Data
The authors report a combined 1,537 fossils from Fort Meade Microsite sediment (Table 1). Gastropod shell casts and batoid tooth fragments are the most common specimens in all three collections. Negaprion and Carcharhinus teeth are the most common shark specimens, which compares well with earlier studies on other Bone Valley Member exposures (Webb and Tessman, 1968). Shark tooth specimens are typically 3-15 mm long. Notable exceptions are a Galeocerdo tooth measuring 20 mm wide by 14 mm long and a well-worn fragment of an †O. megalodon tooth measuring 11 mm wide by 27 mm long.
The sediment produces abundant burrow cast fragments, 1-2 mm in diameter and 5-10 mm long. Because these fragments are small, water-worn, and out of context, the authors cannot determine whether the fragments are domicile or feeding traces. For this reason, these specimens receive the label “ichnofossil indeterminate.”
The concentration of chondrichthyan, teleost, gastropod, and bivalve fossils, as well as the small size of the specimens, is consistent with an estuarine paleoenvironment. The few fossils of terrestrial species, such as the two Microtus molars, probably originate from Pleistocene alluvium above the Bone Valley Member, as the Peace River channel transports fossils from both deposits (Figure 2).
Pedagogical Data
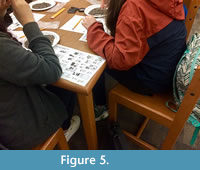 Qualitative observations record that participants generally use the guides as suggested, placing fossils on the sheet to compare them to the images. Some participants choose to use magnifying lenses, while most do not (Figure 5). One group required a reminder to work individually rather than as a group. Butler observed two instances of participants sorting out a pseudofossil, or a stone with a fossil-like appearance.
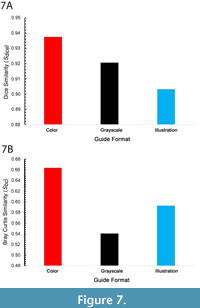
 In terms of presence/absence Sdice similarity, participants in all three identification guide groups performed similarly to each other, with an Sdice > 0.9, but users of color photograph guides narrowly outperform users of grayscale photograph and illustrated guides (Figure 6A). When using relative abundance data and Sbc similarity, participants in all three identification guide groups perform less effectively, with no guide type Sbc > 0.7 (Figure 6B). When using abundance data, participants in the color photograph guide group produce data closest to the expert data, but participants in the illustrated guide group outperformed participants in the grayscale photo guide group. Rerunning the analysis with truncated means produces similar results, showing no statistically significant (p > 0.05) influence from outliers on the original cluster analysis (Figure 7).
 A cluster analysis dendrogram comparing all participants individually using both Sdice and Sbc reveals that data produced by any one of the authors is most similar to that produced by the other two, with the mean Sdice between any two authors being ~0.85 and the mean Sbc between any two authors being ~0.77. Using Sdice and presence/absence, the participant with the most accurate data is G11, a parent in the Girl Scout group attending graduate school, who used the grayscale photo guide and whose data had an average similarity of 0.76 to the authors’
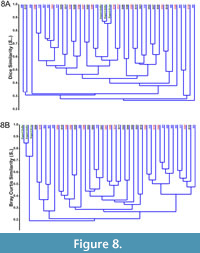 (Figure 8A). Three participants using color photo guides also cluster with the authors: C09, an undergraduate college student working at La Vega Junior High, as well as C11 and C12, both parents in the Girl Scout troop with graduate degrees (Figure 8A). When considering relative abundance data, participant G05 has highest similarity to the authors (Figure 8B).
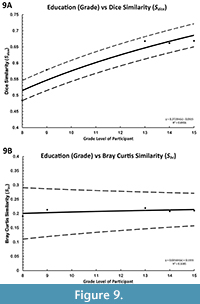
Recombining participant data into populations based on self-reported experience and interest levels reveals the influence of these factors. Overall, participants who report having previously found fossils produce presence/absence data most similar to that of the authors. Participants who report the highest interest level in finding fossils produce less accurate presence/absence data than those with comparable experience but only moderate interest (Table 2). Education does appear to increase the accuracy of presence/absence data from participants (Figure 9A), but has a minimal effect on relative abundance data (Figure 9B).
DISCUSSION
 Whether comparing presence/absence data or relative abundance data, participants who used color photo-based identification guides produced the most accurate information when pooling their data. When comparing presence/absence data, participants who used the grayscale photo-based guides were the second most accurate. However, the guides did not depict genera that are not part of the Palmetto Fauna, and so the relative abundance data may be a better indicator of identification accuracy. When comparing the relative abundance data, participants using the illustration-based guides produced the second most accurate data. This compares favorably to the results of the 2016 study from Austen et al., which indicated that illustration-based identification guides needed further scrutiny.
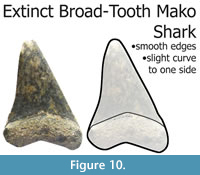
The authors also note that success finding an image style that improves data reporting suggests that inquiry into the overall design of guides, including text and layout, may produce additional, meaningful information. In addition to testing single image styles, future researchers may consider inquiry into combinations of image styles. Color photographs augmented by illustrations (Figure 10), often appearing in paleontological studies (Cadena et al., 2017, 2020), may provide the combination of visual cues needed to design an ideal identification guide.
 The identification guides depict specimens at a 1:1 scale. The data do not indicate a collection bias based on specimen size. For instance, Ophiomorpha specimens, typically 5-10 mm long in the FMMS, are reported by 14 of the 35 untrained participants (40%). Rhizoprionodon terraenovae teeth, also typically ~5 mm long, are reported by nine untrained participants (26%). By contrast, no untrained participants report the largest possible specimen in the FMMS, O. megalodon teeth, and only seven untrained participants (20%) report finding the large chondrichthyan †Cosmopolitodus hastalis. Based on this information, a 1:1 image scale probably does not impede identification.
The data indicate a possible collection bias toward vertebrate specimens. Excluding unidentifiable specimens, all three expert participants report gastropods as their most common specimens. Only five untrained participants (14%) report gastropods as their most common specimens. Interestingly, eight untrained participants (23%) report batoid teeth as their most common specimens. Batoid teeth are the second most common specimens for all three expert participants, excluding unidentifiable specimens. Based on this information, users of identification guides may benefit if guides highlight invertebrate specimens, or perhaps which specimens should be most common.
Manipulation of participant survey data produces unexpected results with implications for science outreach programs. Higher interest levels correlating with less accurate data is a result not anticipated by the authors. This result presents a paradox, as building enthusiasm is a goal for many science outreach programs. In addition, would-be citizen scientists with high interest levels may be more likely to volunteer for fieldwork assisting professionals.
Because of the small number of participants in this study, explanations for the interest level paradox are tentative. Participants with higher interest levels may be more prone to “wishful thinking,” while less invested participants may be more objective in their approach. This would be consistent with findings that eagerness leads individuals to predict higher evaluations of tasks than the scores they ultimately received (Lu et al., 2018). Another possibility is that, while some participants have enthusiasm for fossils, they do not have the education needed to know whether their self-reported previous discoveries are accurate, nor the awareness to self-correct as they work, a phenomenon known as the Dunning-Kruger Effect (Kruger and Dunning, 1999). Higher formal education did correlate with higher accuracy in this study. Participants with higher education may have developed a better awareness of their own cognitive biases and subsequently take self-corrective actions as they work.
The enthusiasm paradox presents an opportunity for further inquiry. Future studies should consider a larger number of participants. Additionally, participants should have the ability to rate their interest levels on a wider scale.
CONCLUSIONS
Results from this study suggest guides that use color photographs are more helpful to novices who rely on them to make species identifications. While guides that use grayscale photographs do appear to be less helpful to novices, the difference in the quality of data they produce is small. Based on these findings, researchers who create identification guides can use either color or grayscale photos without noticeable loss in accuracy of the data reported. Grayscale images are often less expensive to print, which benefits projects with small budgets. The results of this study are significant enough to warrant further investigation.
The results show a possible negative effect of participants having high interest levels. Based on the data and observations made by Butler during the lab exercises, future investigators may want to focus on pareidolia, the phenomenon of seeing meaningful images or patterns where none exists. Future investigators may also consider confirming whether subjects have previously discovered fossils rather than relying on self-reported information. Independent confirmation of discoveries should reveal whether a variation of the phenomenon noted by Kruger and Dunning (1999) can explain the negative effect this study describes.
Regardless of the area of specialization, formal education levels do appear to have a positive effect on the accuracy of data reported. Based on these results, participants with at least some college education are the most accurate at identifying fossils in a citizen science program. Participants in this study who have advanced degrees produce presence/absence data matching the authors’ data > 0.65, despite having no previous experience in paleontological research. Based on these promising results, the authors recommend investigation to determine how much training citizen scientists need to produce research-grade data.
ACKNOWLEDGEMENTS
The authors thank E. Brunsell, M. Seitz, K. Petree, L. Yann, D. Hembree, K. Travouillon, C. Strganac, and two anonymous reviewers for suggesting helpful edits. In addition, the authors thank J. Baguchinsky for constant support, F. Mazza for collecting sediment, and the participants from La Vega Junior High and Girl Scout Troop 1587 for their time. M. Normandin and K. Young have our gratitude for coordinating lab sessions with our participants. D. Butler dedicates this manuscript, her first effort as lead author, to her mother, M.A. Chandler. She helped a then-eight-year-old D. identify her first fossil, which she had pulled from a pile of Early Cretaceous gravel in the yard. Without her encouragement, this project would not have been possible.
REFERENCES
Alroy, J. and Hunt, G. 2010. Quantitative Methods in Paleobiology. Paleontological Society, Boulder.
Austen, G.E., Bindemann, M., Griffiths, R.A., and Roberts, D.L. 2016. Species identification by experts and non-experts: comparing images from field guides. Scientific Reports, 6:33634. https://doi.org/10.1038/srep33634
Behrensmeyer, A.K. and Turner, A. 2017. Fossilworks: Gateway to the Paleobiology Database. http://fossilworks.org/bridge.pl. Accessed September 2017.
Bonney, R., Cooper, C.B., Dickinson, J., Kelling, S., Phillips, T., Rosenberg, K.V., and Shirk, J. 2009. Citizen science: A developing tool for expanding science knowledge and scientific literacy. BioScience, 59:977-984. https://doi.org/10.1525/bio.2009.59.11.9
Bray, J.R. and Curtis, J.T. An ordination of the upland forest communities of southern Wisconsin. Ecological Monographs, 27:325-349.
Cadena, E.A., Abella, J., and Gregori, M.D. 2017. New findings of Pleistocene fossil turtles (Geoemydidae, Kinosternidae and Chelydridae) from Santa Elena Province, Ecuador. PeerJ 5:e3215. https://doi.org/10.7717/peerj.3215
Cadena, E.A., Scheyer, T.M., Carrillo-Briceño, J.D., Sánchez, R., Aguilera-Socorro, O.A., Vanegas, A., Pardo, M., Hansen, D.M., and Sánchez-Villagra, M.R. 2020. The anatomy, paleobiology, and evolutionary relationships of the largest extinct side-necked turtle. Science Advances, 6:eaay4593. https://doi.org/10.1126/sciadv.aay4593
Cohn, J.P. 2008. Citizen science: can volunteers do real research? BioScience, 58:192-197. https://doi.org/10.1641/b580303
Dice, L.R. 1945. Measures of the amount of ecologic association between species. Ecology, 26:297-302. https://doi.org/10.2307/1932409
Digby, P.G.N. and Kempton, R.A. 1987. Multivariate Analysis of Ecological Communities, 1st Edition. Chapman and Hall, New York.
Elbroch, M., Mwampamba, T.H., Santos, M.J., Zylberberg, M., Liebenberg, L., Minye, J., Mosser, C., and Reddy, E. 2011. The value, limitations, and challenges of employing local experts in conservation research. Conservation Biology, 25:1195-1202. https://doi.org/10.1111/j.1523-1739.2011.01740.x
Google. 2017. Google Earth Pro (version 7.1.8.3036). Windows 10. 27°43’13.00"N by 81°47’40.00"W. Accessed May 2018.
Hammer, Ø., Harper, D.A.T., and Ryan, P.D. 2001. PAST: paleontological statistics software package for education and data analysis. Palaeontologia Electronica, 4(1):a09.
https://palaeo-electronica.org/2001_1/past/issue1_01.htm
Kells, V. 2018. Sharks of the Atlantic and Gulf Coasts from Maine to Texas. Quick Reference Publishing, Fort Lauderdale.
Kruger, J. and Dunning, D. 1999. Unskilled and unaware of it: how difficulties in recognizing one’s own incompetence lead to inflated self-assessments. Journal of Personality and Social Psychology, 77:1121-1134. https://doi.org/10.1037/0022-3514.77.6.1121
Liu, J. 2010. Color Blindness and Web Design. https://www.usability.gov/get-involved/blog/2010/02/color-blindness.html. Accessed September 2017.
Lu, J., Duan, H., and Xie, X. 2018. Eagerness and optimistically biased metaperception: the more eager to learn others’ evaluations, the higher the estimation of others’ evaluations. Frontiers in Psychology, 9:715. https://doi.org/10.3389/fpsyg.2018.00715
MacFadden, B.J., Lundgren, L., Crippen, K., Dunckel, B.A., and Ellis, S. 2016. Amateur paleontological societies and fossil clubs, interactions with professional paleontologists, and social paleontology in the United States. Palaeontologia Electronica, 19.2.1E:1-19. https://doi.org/10.26879/161E
palaeo-electronica.org/content/2016/1471-commentary-amateur-professionals-in-us.
Maryland Geological Survey. 1904. Miocene Plates. The Johns Hopkins Press, Baltimore. Digital scans available at http://www.mgs.md.gov/publications/report_pages/Systematic_Reports.html.
McKinzie, M.G., Morin, R., and Swiatovy, E. 2001. Fossil Collector’s Guidebook to the North Sulphur River. Dallas Paleontological Society, Dallas.
Means, G. 2016. Common fossils from the phosphate deposits of the Central Florida Phosphate District, p. 61-68. In Hurst, M.V. (ed.), Central Florida Phosphate District, Third Edition. Southeastern Geological Society, Tallahassee.
Monoyios, K. 2011. 5 Reasons Your Camera Won’t Steal My Job. Scientific American Blog Series. Accessed May 2018.
NCSS. 2003. Official Series Description - Bradenton Series. https://soilseries.sc.egov.usda.gov/OSD_Docs/B/BRADENTON.html. Accessed May 2018.
Peterson, R.T. 2008. Peterson Field Guide to Birds of North America. Houghton Mifflin Harcourt, New York.
Randler, C. 2008. Teaching species identification - a prerequisite for learning biodiversity and understanding ecology. Eurasia Journal of Mathematics, Science and Technology Education, 4:223-31. https://doi.org/10.12973/ejmste/75344
Randler, C. and Zehender, I. 2006. Effectiveness of reptile species identification - a comparison of a dichotomous key with an identification book. Eurasia Journal of Mathematics, Science & Technology Education, 2:55-65. https://doi.org/10.12973/ejmste/75464
Scott, T.M., Campbell, K.M., Rupert, F.R., Arthur, J.D., Missimer, T.M., Lloyd, J.M., Yon, J.W., and Duncan, J.G. 2001. Geologic Map of the State of Florida. Florida Geological Survey and the Florida Department of Environmental Protection.
Sibley, D.A. 2000. The Sibley Guide to Birds. Alfred A. Knopf, New York.
Tulloch, A.I.T., Possingham, H.P., Joseph, L.N., Szabo, J., and Martin, T.G. 2013. Realising the full potential of citizen science monitoring programs. Biological Conservation, 165:128-138. https://doi.org/10.1016/j.biocon.2013.05.025
US Dept. of Agriculture. 2017. Web Soil Survey. Government Soil Maps. Soil Data Explorer. https://websoilsurvey.sc.egov.usda.gov/App/WebSoilSurvey.aspx
USGS. 2012. Hawthorn Group, Peace River Formation, Bone Valley Member. Geologic Unit Database. Hawthorn Group, Peace River Formation, Bone Valley Member. https://mrdata.usgs.gov/geology/state/sgmc-unit.php?unit=FLMIPOhpb%3B0
Vianna, G.M.S., Meekan, M.G., Bornovski, T.H., and Meeuwig, J.J. 2014. Acoustic telemetry validates a citizen science approach for monitoring sharks on coral reefs. PLoS ONE 9 (4):e95565. https://doi.org/10.1371/journal.pone.0095565
Wallace, S.C. and Hulbert, R.C. 2013. A new machairodont from the Palmetto Fauna (Early Pliocene) of Florida, with comments on the origin of the Smilodontini (Mammalia, Carnivora, Felidae). PLoS ONE 8 (3):e56173. https://doi.org/10.1371/journal.pone.0056173
Webb, S.D. and Tessman, N. 1968. A Pliocene vertebrate fauna from low elevation in Manatee County, Florida. American Journal of Science, 266:777-811. https://doi.org/10.2475/ajs.266.9.777
