

 SPIERS and VAXML: A software toolkit for tomographic visualisation and a format for virtual specimen interchange
Article number: 15.2.5T
https://doi.org/10.26879/289
Copyright Palaeontological Association, May 2012
Author biographies
Plain-language and multi-lingual abstracts
PDF version
Submission: 15 June 2011. Acceptance: 4 April 2012
{flike id=226}
ABSTRACT
'Virtual palaeontology', the study of fossils through the medium of digital models, is an increasingly important palaeontological technique. The vast majority of such work is tomographic, based around serial-slice datasets generated either physically or via scanning technologies. There are, however, no general-purpose software packages for tomographic reconstruction that are freely available and tuned to the needs of palaeontological data. In addition to its value in the primary study of specimens, virtual palaeontology has the potential to become a powerful medium for online data-dissemination, greatly increasing the degree to which palaeontologists are able to inspect each other's data. The absence of a standardised data-format for these datasets, however, has been a primary factor impeding such data exchange. We describe here solutions to both problems. The SPIERS software suite is a complete, free, multi-platform and fully documented software toolkit for the reconstruction of any tomographic data into three-dimensional models. While capable of rapid reconstruction, it is especially well suited to the production of carefully prepared models from difficult data. We argue that virtual-specimen dissemination should take the form of triangle-mesh datasets, which can be generated from a maximally broad range of data sources. We introduce here the VAXML data format for such datasets, a candidate for a standard dissemination format for virtual specimens, both palaeontological and biological. The SPIERS suite includes a package capable of both visualising and exporting VAXML files, designed to support the viewing of complex datasets on relatively low-powered systems.
Mark D. Sutton. Department of Earth Science and Engineering, South Kensington Campus, Imperial College London, SW7 2AZ, United Kingdom. m.sutton@imperial.ac.uk
Russell J. Garwood. Manchester X-ray Imaging Facility, School of Materials, The University of Manchester, Oxford Rd., Manchester M13 9PL, United Kingdom. russell.garwood@manchester.ac.uk
David J. Siveter. Department of Geology, Bennett Building, University of Leicester, University Road, Leicester, LE1 7RH, United Kingdom. djs@leicester.ac.uk
Derek J. Siveter. University Museum of Natural History & Department of Earth Sciences, University of Oxford, Parks Road, Oxford, Manchester OX1 3PR, United Kingdom. derek.siveter@earth.ox.ac.uk
KEY WORDS: tomography, three-dimensional, virtual fossils, infrastructure, VAXML, computed tomography
Final citation: Sutton, Mark D., Garwood, Russell J., Siveter, David J., and Siveter, Derek J. 2012. SPIERS and VAXML; A software toolkit for tomographic visualisation and a format for virtual specimen interchange. Palaeontologia Electronica Vol. 15, Issue 2;5T,14p;
palaeo-electronica.org/content/issue-2-2012-technical-articles/226-virtual-palaeontology-toolkit
INTRODUCTION
The study of three-dimensionally preserved fossils has undergone a renaissance in recent years following the advent of techniques for 'virtual palaeontology' (see Sutton, 2008 and Witmer et al., 2008 for reviews). Initially driven by the need to image specimens not extractable by any conventional means, virtual fossils constructed as interactive models on a computer screen have many attractive features as a basis for palaeontological work; they can be rotated, dissected, sectioned and copied at will, without any danger of damage or degradation, and in many ways are easier to work with than real specimens.
Virtual fossils can be reconstructed from many different forms of data. They may be directly created as idealised virtual models (e.g., Stein et al., 2008; Zhang et al., 2010), captured through laser scanning (=LIDAR) of surfaces (e.g., Béthoux et al., 2004; Bates et al., 2009; Antcliffe and Brasier, 2008), through photogrammetry (e.g. Petti et al., 2008; Falkingham, 2012 ), or through various forms of tomography; it is the latter that represent the vast majority of published studies. Tomography is the study of a three-dimensional object through the imaging of serial planes; a tomogram >is a single plane (a 'slice'), and a tomographic dataset is a sequence of tomograms. This approach has a long history in palaeontology, physical-optical tomography in the form of serial grinding and serial sawing dating to the work of Sollas and Sollas (1903). Since then the technique has been applied to a large number of fossil groups with varying degrees of effectiveness (see e.g., Herbert, 1999), being revitalised in the early twenty-first century by the incorporation of modern digital reconstruction techniques (e.g., Sutton et al., 2001a; Watters and Grotzinger, 2001; Abel et al., 2012). In recent years new techniques for non-destructive tomographic data-capture have also become available, including optical tomography (e.g., Kamenz et al., 2008; see also Haug et al., 2009 for a related approach), neutron tomography (e.g., Schwarz et al., 2005), magnetic resonance imaging (e.g., Clark et al., 2004), and, most importantly, variants on X-Ray Computed Tomography, variously known as CAT- or CT-scanning for large (medical) scale devices, XMT (X-Ray Micro Tomography) or ?CT (Micro Computed Tomography) for laboratory-scale devices working at scales down to single-micron resolution, and SRXTM (Synchrotron Radiation X-ray Tomographic Microscopy) where a synchrotron is used to provide an X-ray source. Examples of studies utilising X-ray sources, together with a discussion of the merits and applications of all forms of tomographic methodology, are provided by Sutton (2008).
Despite an increasing volume of work utilising these methods, several issues have slowed their broad uptake as standard tools in the palaeontological armoury. Some of these issues are cultural or financial, relating to a lag in the acceptance of digital methods in the community and to the costly nature of producing tomographic datasets. One additional problem, however, has been that of software; while many packages exist for tomographic reconstruction (Abel et al., 2012), as a rule these are expensive and/or not well-tuned to the needs of palaeontologists, who typically work with complex and noisy datasets requiring careful preparation work.
A second problem relates to the lack of interchange formats. Virtual palaeontology has a major potential benefit yet to be fully realised; virtual fossils could be published digitally alongside scholarly articles, and/or made available for arbitrary download from a central repository. This form of publication would allow morphological data underlying descriptive or other published work to be disseminated far more fully and easily than is possible with mere publication of still images. Cultural issues, again, are part of the explanation for why this form of data-sharing does not normally occur (see discussion below), but the absence of a practical standardised interchange format for virtual fossils has also been a major hurdle.
We describe here our solutions to these two technical problems. SPIERS is a freely available software package developed to reconstruct specimens from all forms of palaeontological tomographic data, and VAXML is a candidate standardised interchange format, the SPIERS package implementing a reference VAXML viewer. Examples of VAXML datasets are provided in two accompanying Palaeontologia Electronica articles (Garwood and Sutton, 2012; Legg et al., 2012).
SPIERS – SERIAL PALAEONTOLOGICAL IMAGE EDITING
AND RENDERING SYSTEM
SPIERS Overview
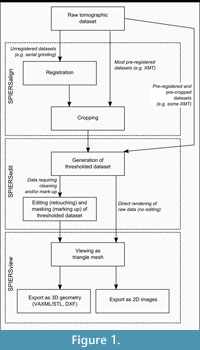 SPIERS is a software package for producing and manipulating three-dimensional 'virtual fossils'. Originally developed to reconstruct serially-ground fossils from the Herefordshire Lagerstätte (Briggs et al., 1996, 2008), it has since also been used in-house to reconstruct other palaeontological tomographic datasets, especially XMT (e.g., Selden et al., 2008; Garwood et al., 2009; Donovan et al., 2010). It is intended to provide a low-cost solution to the practical problems of three-dimensional reconstruction from all forms of tomographic data, while retaining flexibility and high reconstruction quality. As a palaeontological package, SPIERS facilitates slow-and-careful reconstructions, worked up on a slice-by-slice basis. While it can produce "quick-and-dirty" reconstructions and includes many time-saving features, it is particularly well suited to the extraction of maximum data from tomographic datasets through manual 'editing' work (virtual preparation). SPIERS is free software that requires a moderately powerful video card but no other special investment. It consists of a suite of three programs (SPIERSalign, SPIERSedit, and SPIERSview) that between them provide all the tools necessary to convert a set of unprocessed tomographic images into an interactive on-screen model. Figure 1 outlines the role of each of these packages in tomographic-reconstruction workflows. SPIERSalign is an image pre-processing utility that aligns (registers) and crops images prior to reconstruction work. SPIERSedit is the core of the package, providing tools for preparing, interpreting and reconstructing specimens on a slice-by-slice basis. SPIERSview is a three-dimensional viewer used to inspect and interact with the reconstructions produced by SPIERSedit; it is also capable of acting as a viewer for datasets generated by other packages via the VAXML standard (see below). SPIERS is cross-platform software, available for both MS Windows-based PCs (in 32-bit and 64-bit versions), and for Apple Macintosh computers running 64-bit versions of OS X (10.5 and up). Up-to-date installers are available from www.spiers-software.org.
History
While formally described for the first time here, SPIERS has been under constant development and use for over 10 years. In origin it represented an encapsulation of the reconstruction methodology employed by the Herefordshire Lagerstätte Research Group (David JS, Derek JS, DEGB, MDS), first demonstrated by Sutton et al. (2001a) and described by Sutton et al. (2001b). This approach initially relied heavily upon third-party software; SPIERS was written to remove this dependence, to streamline the reconstruction process, and to provide an interactive rendering system to facilitate the study of specimens. Augmentations to facilitate the splitting of models into sub-parts spatially (masking) and by material-type (segmentation; note that this usage of the term differs from the segmentation region-of-interest tools of other tomographic software) were added soon after, and first used in publications by Sutton et al. (2002) and Sutton et al. (2005), respectively. Other miscellaneous features were gradually added over the period 2001-2007, by which time SPIERS had become a mature system capable of handling all forms of tomographic data, with increasing emphasis being placed on CT/XMT data. This first version of SPIERS (version 1) was written in a combination of Microsoft Visual Basic 5.0 and C++. The use of the former language, while initially enabling rapid development, had by 2007 become an encumbrance, hindering portability and, to some extent, execution speed, and had ceased to be supported by Microsoft. In 2008 a complete re-write (version 2) was begun, using pure C++ and a free portable GUI system. While SPIERS version 1 was entirely coded by MDS, for version 2 SPIERSedit and SPIERSview were coded by MDS, with RJG coding SPIERSalign. This work resulted in a beta version of SPIERS version 2 in mid-2009. Further iterative development and debugging took place through 2010 and 2011, culminating in the incorporation of VAXML support, the production of a full Mac OSX port, and the writing of a complete set of manuals in early 2011. The current version is 2.13.
The SPIERS Approach
Key features of SPIERS and of the approach to reconstruction that it reflects are outlined below. Full details of features available in the SPIERS packages are provided in their respective manuals (Appendices 3, 4 and 5).
Multiple Packages. Rather than existing as a single monolithic package, SPIERS is split into semi-independent programs, whose roles are summarised in Figure 1. This reflects the fundamental split of reconstruction processes into pre-preparation of datasets (the responsibility of SPIERSalign), editing/retouching/interpreting and marking up of datasets (the domain of SPIERSedit), and viewing of 3D models (SPIERSview). The use of separate programs enables each to have an interface tuned to its purpose, and to minimise the amount of system resources required at each stage.
Isosurface-Based Triangle-Mesh Reconstruction. SPIERS produces three-dimensional models using the marching cubes algorithm (Lorenson and Cline, 1987) to generate isosurfaces from thresholded volumes, where each pixel in each slice is treated as simply 'on' or 'off' for reconstruction purposes. This is the approach that has been used to generate the majority of published computer-generated tomographic reconstructions (see Herbert, 1999; Hammer, 1999 and Albani et al., 2010 for some alternatives). This surface-based approach allows reconstructions to be obtained without any interpretation step beyond the selection of a threshold level for 'on' or 'off' (generation of working files in SPIERS – see below), while allowing interpretative preparation work (editing) to be carried out if desired. It also generates polygon-based models, which can be efficiently rendered with the 3D display hardware present in most modern PCs, and/or ray-traced for maximal quality. Sutton et al. (2001a) discuss the pros and cons of various modeling approaches in more detail.
Slow-and-Careful Approaches. SPIERS was initially developed for use on relatively rare and valuable palaeontological specimens, and hence embedded in its design philosophy is the concept that slow-to-produce but maximal quality models are preferable to "quick-and-dirty" renderings. While SPIERS includes many 'shortcut' features that facilitate rapid throughput (e.g., automatic alignment, three-dimensional brushes), development work has been biased towards tools for detailed work.
SPIERSalign – Emphasis on Manual Registration. Physical-optical datasets typically require aligning (registration) prior to reconstruction (see Sutton et al., 2001b for a discussion). Registration can be either manual (the user is responsible for rotating/shifting/rescaling each image in turn until all are aligned), or automatic (the computer determines the necessary rotates/shifts/rescales by examining the image for either deliberately placed 'fiduciary' structures that mark invariant positions, or for other clues). SPIERSalign is built around a manual registration approach, as part of the philosophical preference in SPIERS for slow-and-careful methods (see above). Manual registration provides maximum flexibility, allowing the user to attempt registration of datasets with unusual, poorly resolved or even non-existent fiduciary structures. It is also the experience of the authors that careful manual registration of datasets is more accurate than any automated approach, even where high-quality fiduciary structures exist. Nonetheless, SPIERSalign does incorporate an automatic alignment algorithm (see manual for details, Appendix 5) for datasets with 'edge-based' fiduciary markings; in ideal conditions this is capable of registering datasets without user intervention. In any real dataset, however, automatic alignment is intended as a first pass, to be followed by a second (manual) pass to correct alignment errors and to increase accuracy.
SPIERSedit – Slice-Based Data Manipulation. SPIERSedit is a slice-at-a-time dataset editor; while it can perform certain operations on multiple slices, its basic mode of operation involves viewing and modifying individual tomograms. This is another aspect of the philosophical preference for slow-and-careful approaches embodied in SPIERS (see above). Slice-based manipulation allows a user to retouch and mark up the model in a maximally 'fussy' way if required; shortcuts are of course available, but the slice-based view of the data provided by SPIERSedit keeps the user aware of the fine-scale detail of the dataset.
SPIERSedit – Source and Working Datasets. SPIERSedit expects that the user will want to manually modify data to some degree, and hence uses a mirrored dataset paradigm; the source dataset (comprising raw tomograms) is used to generate a second working dataset, on which all subsequent operations are performed. The working dataset is thresholded to provide interpretation; all pixels lighter than mid-level grey are treated as 'object' (on) and all darker as 'background' (off) for reconstruction purposes. Various 'generation' algorithms are provided to enable users to produce appropriate working images from source images for any dataset. The images of the source dataset are retained to act as a visual reference for the user, which can be overlain on working images. This approach has many advantages. The working dataset, for instance, can be downsampled from the source, enabling smaller models while retaining the full resolution originals for reference. Working images are monochrome in all cases, but source images can still be colour. Generation rules can be complex if necessary (they include 'trainable' rules derived via genetic algorithms from user-specified samples – see SPIERSedit manual, Appendix 3), and can be applied on a slice-by-slice basis, or even to local regions of slices. Raw data is always available and can be reverted to, whatever editing work is undertaken. The mirrored dataset paradigm does, however, introduce a small time-overhead, as working images must be generated before any reconstruction can be made. Its adoption, once again, reflects the bias of SPIERS towards slow-and-careful approaches.
SPIERSedit – Optional Editing. Isosurfaces generated directly from an unmodified working dataset are not subject to any interpretive bias beyond the decisions involved in selecting appropriate generation rules (see above), but can be noisy, and can fail to resolve structures for a variety of reasons (see SPIERSedit manual, Appendix 3, for details). SPIERSedit provides image-editing tools that allow the user to manipulate working images, and hence to improve the data in any desired way; this work is normally done while using source images as a visual guide. 'Editing' work of this type is the virtual equivalent of traditional specimen-preparation work. It is optional, but allows a user to remove undoubted artefacts or objects not associated with the fossil, as well as to improve on the accuracy with which slice-generation rules have found the edge of the fossil. This latter type of editing work is time consuming and involves a degree of subjective interpretation. Carefully edited datasets normally, however, produce much cleaner and clearer reconstructions, and more importantly can bring out anatomical detail not apparent in unedited reconstructions (e.g., thin or impersistent structures, lighter regions of preservation, etc). The approach implicit in SPIERSedit is to leave decisions on editing work to the user, as these will depend on the initial quality of the dataset, the time available, and the intended use of the resulting model.
SPIERSedit and SPIERSview – Objects, Masks and Segments. SPIERSview supports models that are 'marked up' into constituent objects; these can be presented in different colours, and separately hidden at will. This simple but powerful approach allows for virtual 'dissections' and for the colouring of structures to aid interpretation. SPIERSedit provides two parallel approaches to the division of models into objects. Firstly, it uses the concept of 'segments', or recognisable material types. Many datasets contain only a single segment ('fossil', as distinguished from 'background'), but others contain multiple segments (such as 'shell' and 'organics') distinguishable in terms of colour/greyshade. SPIERS extends the concept of 'generation rules' (see 6 above) to multi-segment data (see SPIERSedit Manual, Appendix 3) to provide automatic assignment to segments, and/or to allow editing work to identify them. Secondly, SPIERSedit allows the user to identify regions within the dataset by applying colour-coded 'masks'; these can be used to specify a region of interest, or to split a specimen into spatially defined objects (e.g., to identify each appendage in an arthropod). Objects in the final model are constructed as arbitrary combinations of masks and segments.
SPIERSedit – Curves System. SPIERSedit incorporates a hybrid vector-raster 'curve' system which can overlay curvi-linear objects or arbitrarily complex closed loops (filled or unfilled) onto the dataset. SPIERSedit curves are Catmull-Rom splines (Catmull and Rom, 1974) that pass through a series of control points overlaid on an image. They are created and modified by placing or moving a series of control points on each slice, with facilities also for copying and interpolating between slices. Curves can be rendered directly as pixels overlaid onto the working dataset, for example to model thin and impersistently preserved arthropod carapaces. Alternatively they can be used to create masks, the use in particular of interpolated curves providing an efficient means of rapidly masking complex structures.
SPIERSview – Lightweight Design. SPIERSview design decisions favour performance in straightforward rendering over complex feature-sets. The software is designed to handle visualisation of models with triangle-counts measured in the millions on relatively low-powered systems by minimising resource usage and using fast custom rendering code. As the element of the SPIERS suite likely to see the most 'casual' use, it is also intended to be lightweight and straightforward in its user interface. This is especially true of its 'finalised mode', a stripped-down view-only operation mode intended for 'completed' models (see SPIERSview manual, Appendix 4).
SPIERSview – Multiple File Formats. The design of a file format for any virtual fossil dataset is a trade-off between file-size, loading speed, and 'openness' (i.e. readability by humans and/or other software). Rather than attempting to provide a single format, SPIERSview can read and write datasets in four different formats, each representing a different compromise; see SPIERSview manual (Appendix 4) for full details. One of these formats is VAXML, intended as a candidate virtual-palaeontology standard interchange format (see below).
Assumptions and Requirements
SPIERS requires datasets in the form of serial images, consecutively numbered, in BMP, TIFF, JPEG or PNG format. 'Monolithic' file-formats that encapsulate an entire tomographic dataset in a single file (e.g., some DICOM subformats) are not supported, but DICOM datasets of this type can be converted to serial images using freely available third-party software (e.g., ImageJ; rsbweb.nih.gov/ij/index.html). Images can be colour or greyscale, but in the latter case must be 8-bit not 16-bit in depth. SPIERS makes certain implicit assumptions about the nature of this data, listed below; many of these assumptions are not unique to SPIERS, but are documented here in the interests of completeness. With exception of the 'unambiguous segmentation' assumption, these are issues of concern only for physical-optical rather than CT-type datasets. Note that SPIERS provides mechanisms to partially compensate for departures from several of these assumptions.
Unambiguous Segmentation. The isosurface-based reconstruction approach used by SPIERS assumes that true boundaries between 'segments' (i.e., between fossil and matrix) exist. Material where fossil grades into matrix is not suitable for reconstruction with SPIERS, unless the arbitrary selection of a boundary level in this gradation is acceptable.
Parallel Tomograms. SPIERS assumes that tomograms (slices) are parallel to each other. This is a fundamental requirement, and any substantial divergence from it will result in incorrect reconstruction.
Consistent Spacing. SPIERS works best for datasets where the spacing between tomograms is consistent. A mechanism is provided to correct for deviations from this ideal, but this requires that variations in inter-tomogram spacing are accurately known.
Sub-isotropic Datasets. The isosurface-based reconstruction approach used by SPIERS works best for datasets that are near isotropic, i.e., where pixel spacing within a tomogram is similar to spacing between tomograms. Divergence from this ideal by a factor of more than 4 is not recommended; relatively high tomogram-spacing causes the worst problems, as too much change between successive slices can result in objects not 'connecting' properly between slices. Downsampling of datasets (see SPIERSedit manual, Appendix 3) can be used to ensure that the dataset is near-isotropic for reconstruction purposes. Extremely non-isotropic datasets, especially physical-optical datasets captured with a low number of slices, may, however, be fundamentally ill-suited to reconstruction in SPIERS.
Slice Independence. The isosurface-based reconstruction approach used by SPIERS assumes that everything visible in each tomogram is present in the plane of that slice. This assumption can be invalidated if (for example) transparent materials or voids are present in a serially-ground sample, revealing structures below the surface plane. Areas of images invalidated in this way can be removed from the model using SPIERSedit (if they can be spotted), but efforts should be made to collect data in a way that minimises their occurrence. For instance, if a sample is set in resin prior to grinding, an opaque resin is preferable to a transparent one. Datasets in which slice independence is highly compromised may not be suitable for reconstruction in SPIERS.
Minimal Image Distortions. SPIERS reconstructions are sensitive to image distortions, which result in equivalent pixels not lining up between tomograms. Distortions can have a variety of causes (e.g., wrinkles on acetate peels, microscope lens-edge effects, tilting of photographed surface) and will noticeably degrade reconstructions. No mechanism exists to correct for distortions, which should be minimised during data collection.
Consistent Brightness. Consistent colour and brightness levels between tomograms greatly ease the SPIERS reconstruction process; while it is possible to correct for variations on a slice-by-slice basis, this is time consuming. Slice images captured with a camera should be taken under the same lighting conditions if at all possible, and chemically stained sections should be treated in exactly the same way to ensure colour equivalence.
Consistency of Scale and Resolution. SPIERSedit requires that all tomograms are of the same resolution (i.e., the same number of pixels in width and height) and have the same magnification. SPIERSalign can be used to correct for this type of inconsistency, but its elimination at data-capture time is strongly recommended.
Registered or Registerable Datasets. SPIERSedit requires all tomograms to be registered (aligned relative to each other). SPIERSalign provides tools for the registration of datasets, but where possible data-capture methodologies that produce pre-registered datasets should be employed. Where this is not possible, the inclusion of fiduciary markings (see SPIERSalign manual, Appendix 3) in captured images is very strongly recommended; without these markings accurate registration may prove difficult, degrading the quality of the final reconstruction.
Languages, Frameworks and Platforms
SPIERS is written in C++, augmented with the QT GUI/application framework, currently version 4.7.3 (qt.nokia.com) and the VTK Visualisation Toolkit (www.vtk.org), currently version 5.6.1. The C++ language was chosen for its execution speed, maturity, and familiarity to the authors. VTK provides certain data-processing functions used by SPIERSview (namely fidelity reduction, smoothing, island removal, and STL/PLY import; see SPIERSview manual, Appendix 4), but is not used for visualisation; in the interests of performance SPIERSview instead uses simplified high-speed custom OpenGL code to display models. The use of QT (rather than an OS-specific API such as MFC) enables the applications to be easily ported to different platforms; while primary development has taken place under Windows, the Macintosh OSX port did not involve any substantial re-writing of code. Porting to other platforms (e.g., Linux) is not under consideration at the present time, although it would not present major technical difficulties.
Omissions and Further Work
SPIERS is intended as a complete package for three-dimensional reconstruction, and it is fully functional in its current version. However, it does not, of course, include all conceivable features; important features under consideration for inclusion in future versions are as follows:
Direct Surfacing of Curve Objects. All surfaces produced by SPIERSedit are isosurfaces calculated from rasterised volumes. While SPIERSedit supports vector objects in the form of curves (splines), these are currently rendered by conversion to raster objects in the volume prior to isosurfacing. Vector-based spline-surfacing algorithms could be used instead to generate triangle meshes, which would be lower in triangle-count and potentially smoother than the current approach. The complexity of such directly surfaced curve-meshes would also be independent of tomogram resolution.
Animation and Pre-set Positions in SPIERSview. SPIERSview has no support for animation beyond the crude 'auto-spin' mode. A key-frame based system to specify arbitrary animations would be relatively straightforward to implement, enabling SPIERSview to be used in a 'hands-free' mode to demonstrate models in a predetermined manner. Such a system could also be used to export animations as image sequences, which could be assembled into video files by third-party software, or potentially by SPIERSview itself. As part of this system, pre-defined views could be set up to enable quick switching between dorsal, lateral views, etc., either as part of an animation sequence or for static viewing.
Photorealistic Rendering. Ray-traced images represent the highest quality visualisations of models available, and have been used for all Herefordshire Lagerstätte publications (see e.g., Sutton et al., 2010; Siveter et al., 2010 for recent examples). At present this requires the export of SPIERSview models to third party software (e.g., the open-source Blender, http://www.blender,org), but the use of freely available ray-tracing APIs could enable SPIERSview to perform this form of rendering directly. In combination with an animation system, this could be used to generate very high quality video sequences.
Tighter Integration between SPIERSedit and SPIERSview. SPIERSedit currently renders datasets via a full export to SPIERSview. This connection could be augmented with a communication channel between SPIERSedit and SPIERSview. Communication would enable rapid dynamic updates, where changes to datasets in SPIERSedit would automatically propagate to SPIERSview, enabling quick visual feedback on editing and masking work. A representation in SPIERSview of the position of the currently visible slice and the position of the three-dimensional brush (when enabled) would also be possible, aiding user-orientation in the dataset. The communication channel would be implemented using TCP/IP, enabling the synchronised version of SPIERSview to run on a different computer to SPIERSedit if desired, providing a means of increasing performance.
Shading Options in SPIERSview. SPIERSview currently supports only single-colour shading of objects, although surface-coloured data can be imported as VAXML/PLY datasets. More complex shading systems, implementing for instance height-based colour-mapping of the type used in G.I.S. systems (see e.g., Béthoux et al., 2004 for a palaeontological application), may increase visual contrast of low-relief structures. These systems would be implemented in hardware using 'shader' programming languages.
DISSEMINATION OF VIRTUAL SPECIMENS
The Dissemination Problem
While published research utilising the techniques of virtual palaeontology is becoming increasingly mainstream, presentation of virtual specimens has relied primarily on two- dimensional images or stereo-pairs, in some cases supplemented by pre-rendered animations of the specimens being rotated and/or dissected (e.g., Sutton et al., 2001a; Garwood and Sutton, 2010; Kamenz et al., 2008). While these approaches provide straightforward and familiar means of visualising specimens, they are a poor substitute for the three-dimensional data itself. The dissemination of three-dimensional morphological data underlying 'virtual palaeontology' publications, either in a central repository or as supplementary information to publications, is clearly desirable in the interests of scientific clarity, as well as to facilitate further research on the specimens in question (see e.g., Callaway, 2011). This would parallel the way that gene-sequence data underlying published (and unpublished) work is routinely made available to all interested parties via a central repository (GenBank; www.ncbi.nlm.nih.gov/genbank); this policy has had immeasurable benefits for genetic science (see e.g., Strasser, 2008). Despite their desirability, however, such data-releases have rarely taken place in palaeontology. There are two primary reasons for this reluctance. Firstly, there is little perceived gain for authors in releasing their data in this way. While all would of course be happy to see other authors doing so, there is an understandable reluctance to 'give away' data representing a substantial investment of time and/or financial resources without any guarantee that others will reciprocate. This cultural impediment is likely to be overcome with time, with the unilateral adoption of data-release policies by important research groups, and most critically with the adoption by journals of a policy that insists on such data release. The second factor is technical; there is no practical format for the dissemination of virtual palaeontological data, and no formal agreement as to the type of information that should be released; in this context a format is a file-type (a computer readable protocol for storage of the information), while a type is a class of dataset (series of images, point cloud, triangle mesh, etc.). This latter problem is addressed here.
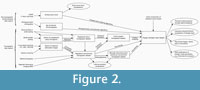 Virtual palaeontological data can be captured and processed in many different ways; Figure 2 summarises virtual palaeontological workflows, showing data capture and visualisation/output methodologies together with the intermediate dataset types produced. There are nine general data types that could be taken as construing a virtual palaeontological dataset, many of which are rather heterogeneous. Registered colour tomographic datasets for instance, vary in aspect ratio (pixel:slice spacing ratio), consistency of slice spacing, presence/absence of out-of-plane structures (e.g., invalidations of the slice independence assumption, see above), solidity of the specimen (e.g., solid or consisting of thin walls with sediment fill) and more besides. This multiplicity renders any attempt to implement a single file-format for all types of datasets impractical. Such a format (and the software intended to read it) would require a prohibitively high degree of flexibility, and in all likelihood would fail to predict new developments in methodology and quickly become redundant. An additional problem is that of size; tomographic datasets in particular are large, often exceeding several gigabytes. While they can be reduced in size with lossy compression algorithms and/or downsampling (e.g., presented as videos, as by Siveter et al., 2004; Donoghue et al., 2006), this downgrades them to the extent that they cannot be used as a basis for reconstructions. Hosting of a large number of gigabyte-scale datasets is not technically problematic, but is relatively expensive; overly large datasets are hence unlikely to be routinely hosted by journals as supplementary information. While ideally then the authors of a publication based on an XMT dataset, for instance, might release the rotational attenuation images, the computed tomograms, a set of marked up and retouched tomograms, and a triangle mesh model, this capability is currently impractical.
A perusal of Figure 2 reveals, however, that there is a 'sweet spot' for data release; the vast majority of virtual palaeontological work uses three-dimensional polygon (i.e., triangle) meshes prior to visualisation. This data type is also relatively compact (typically an order of magnitude or more smaller than equivalent tomographic datasets) and relatively homogeneous; triangle-mesh datasets consist simply of a list of triangles each defined by three points in space, regardless of the methodology used to generate them. Some triangle-mesh datasets contain multiple objects, but these are simply multiple lists of triangles with a limited quantity of metadata attached (e.g., object names). The only visualisation methodologies that do not generate polygon meshes are rarely encountered; these are volume-rendered visualisation and direct point-cloud visualisation. Volume rendering has seen only occasional use, and typically as an adjunct to triangle-mesh surface-based reconstructions (e.g., Albani et al., 2010). Direct point-cloud visualisations have also been published (e.g., Béthoux et al., 2004), but these too are rare, and a conversion to a triangle-mesh is always feasible for this form of data.
We propose, therefore, that virtual palaeontological specimens should, where possible, be released as triangle meshes. In many cases these meshes incorporate a degree of subjective interpretation, including retouching, mark-up (in the form of splitting into objects) or decisions on isosurface level; here they would ideally be backed up by a less processed form of data (e.g., registered monochrome tomographic datasets) that could be curated at institutions such as museums if their online storage is impractical. Nonetheless the vast majority of scientists wishing to access virtual fossil data will have no desire to revisit the reconstruction process, but simply will want to be able to carefully inspect the model that directly underlies published images, descriptions and interpretations. Triangle-mesh datasets provide precisely that model.
The identification of triangle-mesh datasets as the appropriate type for dissemination leads to the more technical problem of format. While a large number of file-formats exist that can store triangle-mesh datasets, none are well suited to the dissemination of virtual specimens. Requirements include simplicity, transparency and 'openness' (data should be easy to generate and read, be humanreadable as far as possible, and the format should not be tied to proprietary software), capacity to handle multiple objects, capacity to store appropriate metadata (object names, scales, colours, taxonomic names, authorship, etc.) and compactness. A full evaluation of all existing file formats for three-dimensional geometry is beyond the scope of this work, but the inadequacies of five of the more commonly encountered 'interchange' formats (i.e., those not tied to proprietary software) are listed in Table 1.
Linked to the issue of file format is the availability of appropriate viewing software that can interpret the file format for an end-user. While software capable of visualising triangle-meshes via OpenGL or equivalent APIs abounds, none is ideally suited to the viewing of virtual specimen datasets. Such software should be free, multi-platform, lightweight, easy to use for the non-technical, well documented, provide stereo-viewing capabilities, provide facilities to visualise and dissect multi-piece models, and provide the highest performance possible on potentially mid- or low-range hardware, even with high triangle-count models. It should also be able to interpret and display object names and hierarchies, together with other virtual-specimen specific metadata such as taxonomic attributions. To the best of our knowledge, no software other than SPIERSview exists that fulfils all these requirements; the unsuitability of other software does, however, mean that there is no incentive to use any particular (sub-optimal) existing file format, and an opportunity exists to create a new standard for data dissemination, well suited to the needs of the palaeontological community.
VAXML. As a solution to these technical issues we propose here a new file format: VAXML (Virtual Anatomy XML; XML or eXtensible Markup Language is a standard format for the construction of markup languages). At present SPIERSview is the only available software capable of directly viewing VAXML datasets, although we hope that importers for other viewing software can soon be made available, and/or other viewing software be written. VAXML datasets consist of (a) one or more triangle meshes (objects), each defined by a single STL or PLY file (see Table 1), and (b) a VAXML file containing information on how the STL/PLY files are to be assembled, together with metadata for the dataset. This multi-file approach allows the metadata to be kept in a human-readable and editable form (in the VAXML file), while retaining a standardised format (STL/PLY) for the geometries themselves. STL and PLY files in a VAXML dataset can be in either binary or ASCII format (the former smaller, the latter more human-readable); in either case they are amongst the simplest and most widely usable three-dimensional file-types available. PLY files can incorporate properties beyond simple geometry; all these are ignored in VAXML except colour-data provided as ‘red’, ‘green’ and ‘blue’ properties of vertices. Almost all 3D mesh-manipulation software is able to import and export objects in either STL or PLY format;all such software that the authors have experience with will correctly retain relative position of each object file, enabling successful import of multi-part models. The choice of these formats to describe mesh geometries is thus intended to facilitate both the generation of VAXML, and the extraction of data from VAXML datasets into other software.
The details of VAXML specification are given in Appendix 1, and two examples of VAXML files are given in Appendix 2. VAXML files are text files that can be read or edited using any text-editor or word-processor software. The language is easily understood, deliberately using minimal features of XML (there are no attributes or self-terminating tags for instance); manual construction of VAXML files is trivial for single-mesh datasets (see notes on minimal VAXML file in Appendix 2), and relatively straightforward even for complex multi-piece datasets. Alternatively VAXML files can be generated by software. SPIERSview is capable of exporting such files, and it is hoped that exporter plug-ins for common 3D packages will soon be developed. Additionally a stand-alone VAXML generator capable of creating a VAXML file for a given set of STL/PLY files is planned, either as an application distributed with future versions of SPIERS, or provided as an online service.
The VAXML specification provides a minimal but flexible scheme for metadata. Datasets can be tagged with a title and scale, plus one or more text items under each of the following headings: references (either to publications or websites); authors (authorship of the dataset); provenance (geographical information, stratigraphic information); specimen(repository information, accession numbers, preparation methodology); classification(rank/name pair(s), e.g., Genus/Homo, Species/sapiens etc); and comments (any notes not fitting into other categories, also copyright information). Individual objects are all tagged with a name, the name of the associated STL/PLY file and a material (information on colour and transparency). They can optionally also be tagged with a transformation matrix (to enable relative repositioning/rescaling of STL/PLY files); grouping information (hierarchies of groups are supported); ordering information (for lists of objects); a shortcut key (used by viewers to toggle visibility); and a URL (for download of STL/PLY files; see below).
While the VAXML approach of splitting datasets into multiple files (one STY/PLY for each object plus one VAXML file) provides for maximum transparency and allows the use of unmodified STY/PLY files, it does complicate the delivery of VAXML datasets over the Internet, as web-browser software does not typically facilitate multiple-file downloads. One solution is simply to distribute VAXML datasets as compressed archive packages (e.g., ZIP files), which can be unzipped by the user prior to opening. As an alternative, however, the VAXML specification provides for a download mechanism within the viewing software; this is not a required facility for all potential VAXML viewing software, but is implemented in SPIERSview. Objects in a VAXML file may specify a URL; if they do, viewing software that supports this facility will first check whether the STY/PLY file specified is present on the local computer. If it is not, the software will attempt to download it from the URL specified, saving it on the local system so that subsequent download is not required. This mechanism provides a very straightforward means of delivery from the users point of view; only an initial VAXML file need be downloaded and launched, triggering the automatic download of the STL/PLY files, and rendering the multi-file nature of the dataset transparent to the user. Note that SPIERSview provides a third mechanism to avoid this multiple file problem in the form of its 'finalised' file format; SPIERSview finalised files are essentially compressed VAXML/STL bundles. This file format is, however, not human- readable and could be seen as proprietary; its use as a means of releasing data to the community is hence discouraged, the facility existing primarily for convenience within a research group.
CONCLUSIONS
SPIERS is a free and complete software package for all forms of palaeontological (and non-palaeontological) tomographic reconstruction; it is especially well suited to the careful preparation of specimens, and enables palaeontologists to perform tomographic reconstruction work on relatively modest hardware. The release of SPIERS is intended to facilitate the acceptance of 'virtual palaeontology' as a standard approach to working with three-dimensionally preserved fossil material.
VAXML is a candidate 'interchange' format for virtual palaeontology specimens, implementing a transparent and simple system designed to be easily interpreted and generated by other software. SPIERSview, part of the SPIERS package, can act as a VAXML viewer. The acceptance of a standard for the dissemination of virtual specimens is a pressing need; until the community can agree on technical details of how such dissemination should be carried out, there is little prospect of widespread sharing of morphological data becoming a reality. We contend that VAXML represents the most appropriate such standard available at present; we hope that it will either be rapidly accepted within the palaeontological and biological communities, or at very least will spark development work of either VAXML or other standards until a solution can be settled upon.
ACKNOWLEDGEMENTS
This research was funded by the Natural Environment Research Council (Grant NE/F017227/1). RG would like to acknowledge the assistance provided by the Manchester X-ray Imaging Facility, which was funded in part by the EPSRC (grants EP/F007906/1, EP/F001452/1 and EP/I02249X/1).
REFERENCES
Abel, Richard Leslie, Laurini, Carolina Rettondini, and Richter, Martha 2012. A palaeobiologist’s guide to ‘virtual’ micro-CT preparation. Palaeontologia Electronica Vol. 15, Issue 2;6T,17p;
palaeo-electronica.org/content/issue-2-2012-technical-articles/233-micro-ct-workflow
Albani, A.E., Bengtson, S., Canfield, D.E., Bekker, A., Macchiarelli, R., Mazurier, A., Hammarlund, E.U., Boulvais, P., Dupuy, J-J., Fontaine, C., Fürsich, F.T., Gauthier-Lafaye, F., Janvier, P., Javaux, E., Ossa, F., Pierson-Wickmann, A., Riboulleau, A., Sardini, P., Vachard, D., Whitehouse, M., and Meunier, A. 2010. Large colonial organisms with coordinated growth in oxygenated environments 2.1 Gyr ago. Nature, 466:100–104.
Antcliffe, J.B. and Brasier, M.D. 2008. Charnia at 50: developmental models for ediacaran fronds. Palaeontology, 51:11–26.
Bates K.T., Manning, P.L., Hodgetts, D., and Sellers, W.I. 2009. Estimating the mass properties of dinosaurs using laser imaging and 3D computer modeling, PLoS ONE, 4(2):e4532.
Béthoux, O., McBride, J., and Maul, C. 2004. Surface laser scanning of fossil insect wings. Palaeontology, 47:13–19.
Briggs, D.E.G., Siveter, David J., and Siveter, Derek J. 1996. Soft-bodied fossils from a Silurian volcaniclastic deposit. Nature, 382:248–250.
Briggs, D.E.G., Siveter, David J., Siveter, Derek J., and Sutton, M.D. 2008. Virtual fossils from 425 million-year-old volcanic ash. Scientific American, 96:474–481.
Callaway, E. 2011. Fossil data enter the web period. Nature,472:150.
Catmull, E. and Rom, R. 1974. A class of local interpolating splines. pp. 317–326. In Barnhill, R. and Reisenfeld, R. (eds.), Computer Aided Geometric Design. Academic Press.
Clarke, N.D.L., Adams, C., Lawton, T., Cruickshank, A.R., and Woods, K. 2004. The Elgin marvel: using magnetic resonance imaging to look at a mouldic fossil from the Permian of Elgin, Scotland, UK. Magnetic Resonance Imaging, 22:269–273.
Donoghue, P.C.J., Bengtson, S., Dong, X., Gostling, N.J., Huldtgren, T., Cunningham, J.A., Yin, C., Yue, Z., Fan, P., and Stampanoni, M. 2006. Synchrotron X-ray tomographic microscopy of fossil embryos. Nature 442:680–683.
Donovan, S.K., Sutton, M.D., and Sigwart, J.D. 2010. Crinoids for lunch? An unexpected biotic interaction from the Upper Ordovician of Scotland. Geology, 38:935–938.
Falkingham, P.L. 2012. Acquisition of high resolution three-dimensional models using free, open-source, photogrammetric software. Palaeontologia Electronica, Vol. 15, Issue 1; 1T:15p; palaeo-electronica.org/content/issue-1-2012-technical-articles/92-3d-photogrammetry
Garwood, R. and Sutton, M.D. 2010. X-ray micro-tomography of Carboniferous stem-Dictyoptera: New insights into early insects. Biology Letters, 6: 699–702.
Garwood, Russell J. and Sutton, Mark D., 2012. The enigmatic arthropod Camptophyllia. Palaeontologia Electronica Vol. 15, Issue 2;15A,12p;
palaeo-electronica.org/content/2012-issue-2-articles/218-the-arthropod-camptophyllia
Garwood, R., Dunlop, J.A., and Sutton, M.D. 2009. High-fidelity X-ray micro-tomography reconstruction of siderite-hosted Carboniferous arachnids. Biology Letters, 5:841–844.
Hammer, Ø. 1999. Computer-aided study of growth patterns in tabulate corals, exemplified by Catenipora heintzi from Ringerike, Oslo Region. Norsk Geologisk Tidsskrift, 79:219–226.
Haug, J.T., Haug, C., Maas, A., Fayers, S.R., Trewin, N.H. and Waloszek, D. 2009. Simple 3D images from fossil and Recent micromaterial using light microscopy. Journal of Microscopy, 233, 93-101.
Herbert, M.J. 1999. Computer-based Serial Section Reconstruction. p. 93–126. In Harper, D.A.T. (ed.), Numerical Palaebiology: Computer-based modelling and analysis of fossils and their distributions. John Wiley and Sons, Chichester.
Kamenz, C., Dunlop, J.A., Scholtz, G, Kerp, H., and Hass, H. 2008. Microanatomy of Early Devonian book lungs. Biology Letters, 4:212–515.
Legg, David A., Garwood, Russell J., Dunlop, Jason A., and Sutton, Mark D., 2012. A taxonomic revision of orthosternous scorpions from the English Coal Measures aided by x-ray micro-tomography (XMT). Palaeontologia Electronica Vol. 15, Issue 2;14A,16p;
palaeo-electronica.org/content/94-issue-2-2012-technical-articles/217-xmt-of-carboniferous-scorpions
Lorenson, W.E. and Cline, H.E. 1987. Marching Cubes: A High Resolution 3D Surface Construction Algorithm. Computer Graphics, 21:163–169.
Petti, F.M., Avanzini, M., Belvedere, M., De Gasperi, M., Ferretti, P., Girardi, S., Remondino, F., and Tomasoni, R. 2008. Digital 3D modelling of dinosaur footprints by photogrammetry and laser scanning techniques: integrated approach at the Coste dell'Anglone tracksite (Lower Jurassic, Southern Alps, Italy). Studi Trento Sci. Nat., Acta Geol.,83:303–315.
Schwarz, D., Vontobel, P.L., Eberhard, H., Meyer, C.A., and Bongartz, G. 2005. Neutron Tomography of Internal Structures of Vertebrate Remains: A Comparison with X-ray Computed Tomography. Paleontologia Electronica, Vol. 8, Issue 2: 30A. palaeo-electronica.org/paleo/ 2005_2/icht/issue2_05.htm.
Selden, P.A., Shear, W.A., and Sutton, M.D. 2008. Fossil evidence for the origin of spider spinnerets, and a proposed arachnid order. Proceedings of the National Academic of Sciences, 105:20781–20785.
Siveter, David J., Briggs, D.E.G., Siveter, Derek J., and Sutton, M.D. 2010. An exceptionally preserved myodocopid ostracod from the Silurian of Herefordshire, UK. Proceedings of the Royal Society of London, Series B, 277:1539–1544.
Siveter, Derek J, Sutton, M.D., Briggs, D.E.G. and Siveter, David J. 2004. A Silurian sea spider. Nature 431:978–980.
Sollas, W.J., and Sollas, I.B.J. 1903. A method for the investigation of fossils by serial sections. Philosophical Transactions of the Royal Society of London, 196:259–265.
Stein, M., Waloszek, D., Maas, A., Haug, J.T., and Müller, K.J. 2008. The stem crustacean Oelandocaris oelandica re?visited. Acta Palaeontologica Polonica, 53:461–484.
Strasser, B.J. 2008. GenBank – Natural History in the 21st Century? Science, 322:537–538.
Sutton, M.D. 2008. Tomographic techniques for the study of exceptionally preserved fossils. Proceedings of the Royal Society of London, Series B, 275:1587–1593
Sutton, M.D., Briggs, D.E.G., Siveter, David J., and Siveter, Derek J. 2001a. Methodologies for the visualization and reconstruction of three-dimensional fossils from the Silurian Herefordshire lagerstätte. Paleontologia Electronica, Vol. 4, Issue 1, 2A: 17pp. palaeo-electronica.org/2001_1/s2/issue1_01.htm
Sutton, M.D., Briggs, D.E.G., Siveter, David J., and Siveter, Derek J. 2001b. An exceptionally preserved vermiform mollusc from the Silurian of England. Nature, 410:461–463.
Sutton, M.D., Briggs, D.E.G., Siveter, David J., and Siveter, Derek J. 2010. A soft-bodied lophophorate from the Silurian of England. Biology Letters, 7:146-149,
Sutton, M.D., Briggs, D.E.G., Siveter, David J., Siveter, Derek J., and Gladwell, D.J. 2005. A starfish with three-dimensionally preserved soft parts from the Silurian of England, Proceedings of the Royal Society of London, Series B, 272:1001–1006.
Sutton, M.D., Briggs, D.E.G., Siveter, David J., Siveter, Derek J., and Orr, P.J. 2002. The arthropod Offacolus kingi (Chelicerata) from the Silurian of Herefordshire, England: computer based morphological reconstructions and phylogenetic affinities. Proceedings of the Royal Society of London, Series B, 269:1195–1203.
Watters, W.A. and Grotzinger, J.P. 2001. Digital reconstruction of calcified early metazoans, terminal Proterozoic Nama Group, Namibia. Paleobiology, 27:159–171.
Witmer, L., Ridgely, R., Dufeau, D., and Semones, M. 2008. Using CT to peer into the past: 3D visualization of the brain and ear regions of birds, crocodiles, and nonavian dinosaurs. pp. 67–88. In Endo, H. and Frey, R. (eds.), Anatomical Imaging: Towards a New Morphology. Springer-Verlag, Tokyo.
Zhang, X., Maas, A., Haug, J.T., Siveter, David J., and Waloszek, D. 2010. A Eucrustacean Metanauplius from the Lower Cambrian. Current Biology, 20:1075–1079.
