

 Acquisition of high resolution three-dimensional models using free, open-source, photogrammetric software
Article Number: 15.1.1T
https://doi.org/10.26879/264
Copyright Palaeontological Association, January 2012
|
Author biography {flike id=92} |
ABSTRACT
The 3D digitisation of palaeontological resources is of tremendous use to the field, providing the means to archive, analyse, and visualise specimens that would otherwise be too large to handle, too valuable to destructively sample, or simply in a different geographic location. Digitisation of a specimen to produce a 3D digital model often requires the use of expensive laser scanning equipment or proprietary digital reconstruction software, making the technique inaccessible to many workers. Presented here is a guide for producing high resolution 3D models from photographs, using freely available open-source software. To demonstrate the accuracy and flexibility of the approach, a number of examples are given, including a small trilobite (~0.04 m), a large mounted elephant skeleton (~3 m), and a very large fossil tree root system (~6 m), illustrating that the method is equally applicable to specimens or even outcrops of all sizes. The digital files of the models produced in this paper are included. The results demonstrate that production of digital models from specimens for research or archival purposes is available to anyone, and it is hoped that an increased use of digitisation techniques will facilitate research and encourage collaboration and dissemination of digital data.
Peter L. Falkingham. School of Earth, Atmospheric and Environmental Science, University of Manchester, Williamson Building, Oxford Road, Manchester, M13 9PL, UK. peter.falkingham@manchester.ac.uk
KEYWORDS: Fossil; digital; model; photogrammetry; archive; laser scanning
FULL CITATION: Falkingham, Peter L. 2012. Acquisition of high resolution 3D models using free, open-source, photogrammetric software. Palaeontologia Electronica Vol. 15, Issue 1; 1T:15p;
palaeo-electronica.org/content/issue-1-2012-technical-articles/92-3d-photogrammetry
INTRODUCTION
The three-dimensional (3D) surface digitisation of both fossil specimens and localities has become a growing trend among palaeontologists over the past decade. Not only has digitisation led to advances in science through the accessibility and flexibility of working with digital models, but it has enabledthe creation of online repositories (e.g., Digimorph) for archiving and distributing this data (Smith and Strait, 2008; Belvedere et al., 2011a).
Uses of Digital Specimens
The digitisation of skeletons has enabled researchers to investigate ranges of motion (Chapman et al., 1999; Mallison, 2010a, 2010b), constrain soft tissue volumes (Gunga et al., 2008; Bates et al., 2009b, 2009d), and explore aspects of biomechanics including locomotion and feeding (Hutchinson et al., 2005; Rybczynski et al., 2008; Gatesy et al., 2009; Sellers et al., 2009) in extinct animals, free from the limitations of handling large, heavy, and often fragile bones. By digitising complete skeletons, or even just individual limbs, constraints and forces can be applied to the digital models within the computer to produce simulations that would be impossible (or at least monumentally difficult) if relying on physical specimens alone. The use of accurate 3D digitised surfaces allows for more specific placement of muscle attachments than would be possible with more generic computer models.
It is not just skeletons and other body fossils that have been subject to an increased use of digitisation techniques. Palaeoichnology, the study of fossil traces, has seen a major renaissance in recent years, thanks in part to a wider use of methods such as laser scanning and photogrammetric documentation. This has seen digitisation techniques applied to the study of particularly inaccessible tracks either due to physical location (e.g., on a cliff face) (Bates et al., 2008a, 2008b), or because of a limited time frame in which to access the tracks (e.g., when a river bed dries up, exposing the track surface) (Bates et al., 2009c; Farlow et al., 2010). By creating digital models of tracks, particularly when those tracks are very shallow and possess subtle features, and applying false-colour based on depth for example, the morphology can be communicated far more easily than with a simple photograph or outline drawing (Bates et al., 2009c; Falkingham et al., 2009; Adams et al., 2010; Belvedere and Mietto, 2010; Belvedere et al., 2011b). The ability to digitise in the field and return the digital copies to the lab is particularly pertinent for trace fossils, where excavation is usually either difficult or undesirable. Tracks remaining in the field may be subject to what is often severe weathering and erosional processes (Bates et al., 2008b). Ensuring accurate records are kept of such sites is vital in order to preserve as much information as possible, and to record the rate at which the physical specimens are being lost (Breithaupt and Matthews, 2001; Breithaupt et al., 2001; Breithaupt et al., 2004; Matthews et al., 2005; Matthews et al., 2006; Marty, 2008; Bates et al., 2009a, 2009c; Adams et al., 2010; Farlow et al., 2010). Similar methods can be used to document dig sites and excavations, providing an accurate record not only of the location of fossils removed from the site throughout the duration of the excavation, but also of geospatial reference to geomorphological features or other dig sites in the surrounding area.
Techniques for Producing 3D Models
The most common method of digitising large specimens or specimens for which internal structures are unimportant (i.e., when only the external 3D morphology is desired) is currently through the use of laser scanners (Bates et al., 2010). Such scanners come in a variety of models; usually specifically suited to a particular range and object size – a desktop scanner will lack the range to scan large specimens or field sites for instance, whilst an outcrop scanner with 1-5 cm resolution would be unsuitable for small invertebrate fossils or the individual bones of a skeleton. These scanners have been prohibitively expensive in the past, but are becoming more affordable as use becomes more widespread (Bates et al., 2008b). Nevertheless, few palaeontology research groups own their own scanners, and must often acquire their use for limited periods of time either through commercial rental, or by borrowing from other departments or research groups. Once the data has been acquired with the scanner, proprietary software and/or a high level of expertise is often necessary in order to align the individual scans from each scanner location, and to clean spurious data points (Bates et al., 2008b; Mallison, 2010a).
An alternative approach to laser scanning is photogrammetry, where photographs taken with a digital camera are aligned, camera positions are calculated, and a point cloud is produced. Previous uses of photogrammetry in palaeontology have predominantly been applied to dinosaur tracks (Breithaupt and Matthews, 2001; Matthews et al., 2006; Bates et al., 2009a), and have involved the use of numerous markers within the photographs and subsequent post-processing with expensive commercial packages that can require considerable user input to select matching points and align the photographs. Unlike laser scanning, this method is expensive not due to hardware, but due to proprietary software and the required expertise.
There are obvious advantages to producing digital versions of physical specimens, but until now the means to do so have remained inaccessible to most workers, either due to cost, lack of expertise, or both. Here a photogrammetric method is presented that requires little user expertise, and can produce accurate 3D digital models based only on photographs taken with a cheap consumer camera. All software used throughout the paper is based on freely available open source software, making this methodology accessible to workers from a range of disciplines.
METHODS
In order to demonstrate the use of the open source software in generating 3D models of specimens, the technique was applied to various specimens ranging in size by several orders of magnitude (from a trilobite to a fossil tree). Specimens belong to either the Manchester Museum (MANCH), the teaching collections of the School of Earth, Atmospheric, and Environmental Sciences, University of Manchester (UMTC), or the Birkenhead Gallery Museum (BIKGM). As the method remains the same regardless of specimen size or complexity, the method itself will be described in general. The models themselves are presented later, along with discussions of quality, in the results section.
The process of producing a 3D digital model from a physical specimen can be summarised as:
1. Acquisition of photographs of the specimen.
2. Production of a sparse point cloud and determination of camera locations.
3. Production of a dense point cloud based on previously calculated camera locations.
4. Post-processing.
1. Acquisition of Photographs of the Specimen
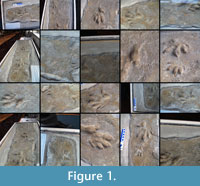 For each of the models produced for this paper, an Olympus E-500 8 megapixel camera was used to acquire photographs (Figure 1). The choice of camera was based solely upon availability, rather than for any technical reasons. The number of photographs required varies according to the complexity of the specimen and to the resolution required of the digital model. In order to produce a three-dimensional Cartesian coordinate, any given point must be present in at least three photographs from different positions, even if those positions differ by only a small amount. For complex subjects in which some parts occlude others from many angles (e.g., a mounted skeleton), photographs taken at least every 15° are recommended (totalling at least 24 images taken around the specimen) in order to produce a complete digital model. Ideally, overlap of ~50% between images should be obtained. For less complex subjects with no occluding parts (e.g., a relatively low relief fossil track), high quality models can be produced from as little as three photographs of the specimen. The images do not need to be taken or named in any specific order. For the specimens used in this paper, the number of photographs was altered accordingly to ensure the best coverage (see Results section for comparison between models produced from differing numbers of images).
2. Producing a Sparse Point Cloud and Determining Camera Positions
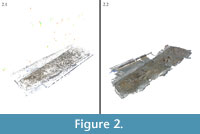 Having acquired an image set of the specimen to be digitised, the next step is to calculate camera positions and produce a sparse point cloud as a basis for the model. The point cloud was obtained using the freely available software "Bundler" and associated programs or (see section 3b below for specific Windows version). Bundler reconstructs a scene from the images and has been previously applied to collections of photographs of tourist attractions including Notre Dame and the Great Wall of China (Snavely et al., 2006, 2007). The "Bundler" software requires inputs generated by other programs, including sets of images, image features, and image matches. The matches and features are generated using additional programs packaged with Bundler, and the inclusion of a bash shell script within the package means that the entire process is automated if run on a Linux platform (or on Windows using a Linux emulator such as Cygwin). After installing the Bundler package, and editing the shell script accordingly, the user places the script and photographs together in a folder and runs the script. Good datasets of images will result in keypoint matches (reported by the script) on the order of thousands or tens of thousands of keypoints for each image (for models presented here, the Bundler script typically reported between 5,000 and 50,000 keypoints found for each image). For the examples used in this paper, this stage takes approximately 30-40 minutes on a 2 GHz dual core laptop to match the images and produce a sparse point cloud (Figure 2.1). Once the user has produced a sparse point cloud using Bundler, the data must be prepared for generation of a dense point cloud by using the Bundle2PMVS script included with the Bundler package.
3a. Producing a Dense Point Cloud
In order to generate a high density point cloud from the images, camera positions, and sparse point cloud generated by Bundler and the associated programs, multi-view stereo (MVS) software is used. Here, Clustering views for Multi-View Stereo (CMVS) and Patch-based Multi-View Stereo (PMVS v2) software was used (Furukawa et al., 2010; Furukawa and Ponce, 2010). These programs are freely available under the GNU General Public License (GPL) as source code for compilation on either Linux or Windows, for both 32- and 64-bit platforms, and can be downloaded from Yasutaka Furukawa's site and the site of Yasutaka Furukawa and Jean Ponce. As with Bundler, these programs can be run from within the image directory according to the instructions supplied with the downloads. CMVS is run first, to produce clusters of images and enable PMVS-2 to handle large datasets. PMVS-2 is then run on the resulting clusters to produce a dense point cloud (Figure 2.2). In order to produce dense point clouds from the 8 megapixel images for each model, 64-bit versions of the programs were required in order to utilise as much computer memory (RAM) as possible. For the examples presented here, an eight core desktop with 32 Gb of RAM and running a 64-bit operating system was used. Total time to produce a dense point cloud was on the order of 30 minutes to an hour for average datasets of ~30 photographs, but increased to almost 12 hours when datasets of over 200 photographs were used (see results below). The programs are able to utilise parallel processing and will experience considerable speed up on powerful computer hardware such as multi-core workstations or computer clusters.
3b. Automating Sparse and Dense Point Cloud Production with the Osm-Bundler Package for Windows
The methods outlined above rely on installing and running the software in a Linux environment, either native or emulated (e.g., via Cygwin). This can make the software difficult to use for those unfamiliar with such a computing environment. As an alternative, the above software (Bundler and associated programs, PMVS, CMVS) can be downloaded in a single package. The osm-bundler package contains pre-compiled software for Windows (32-bit and 64-bit), and python scripts to automate the process. Installation and use is outlined at the above link. The python scripts carry out the processes described above for generation of both sparse and dense point clouds.
4. Post Processing and Production of a 3D Mesh
The dense point cloud generated by CMVS and PMVS-2 is in the *.PLY polygon file format, which can be read by many computer-aided design (CAD) packages for visualisation and post processing. Additional *.PLY files include calculated positions of the camera for each photograph. For visualisation purposes, the free software Meshlab was used. The resultant point cloud may include spurious points due to false keypoints found in photos, or may include points relating to the subject's surroundings that are not required. These undesired points can be easily deleted, as is the case with any other digital 3D acquisition technique such as laser scanning.
Because the method relies on photographs, rather than directly measuring XYZ position as in laser scanning, the resultant point cloud is scale-less. In order to scale the point cloud such that digital units are representative of the dimensions of the physical specimen, an object of known dimension should be included in the dataset (e.g., the placement of a scale bar beside the specimen). A 3D object of known dimensions will aid in scaling the point cloud to the correct dimensions. Once the dense point cloud has been imported into the CAD package, it can be processed and surfaced in the same way as a point cloud generated via any other technique such as laser scanning, including surfacing the point cloud in order to produce a solid, phototextured, 3D model.
A 3D mesh can be produced from the point cloud in the same way as is common for point clouds captured through laser scanning (e.g., see Bates et al., 2008b; Adams et al., 2010). Although researchers will often work with surfaced (meshed) models, this paper will not describe the process of producing a mesh in detail as the process depends heavily upon the software being used and the computational resources available. In this case, the Poisson Surface Reconstruction function was used in Meshlab to produce surfaced models (Appendix 3 and Appendix 6).
RESULTS
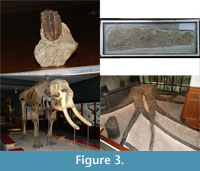 Using the methods described above, digital models were produced from a trilobite (Phacops latifrons, ~0.04 m in length, UMTC– 9/11), a fossil trackway (Chirotherium, ~1.4 m in length, BIKGM 159), a mounted elephant skeleton (~3 m in length, MANCH– A1225), and a fossil tree root system (Stigmaria ficoides, ~6 m in diameter, MANCH – L.L.11627). These specimens cover a range of sizes and levels of surface detail (Figure 3). Table 1 summarises the number of photographs used, and the size of the resulting point clouds, and also lists appendices in which the reader can download the final point cloud as a *.PLY file, and in the case of Chirotherium and the fossil tree root system, a meshed 3D object as well. In addition to these specimens, the front of the Manchester Museum was also used to generate a 3D model.
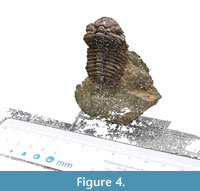 The smallest object digitised using the methods outlined in this paper was the Trilobite, Phacops latifrons. The quality of this model was limited by the macro capabilities of the camera used, given that the lens limited how close photographs could be taken. Nevertheless, the individual axial rings measuring only 2 mm are clearly recorded in the 3D model, as are other small details such as the eyes (Figure 4, Appendix 1).
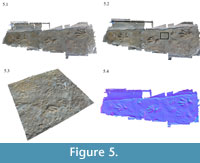 The Chirotherium trackway resulted in a high quality point cloud (Figure 5.1, Appendix 2), which recorded small tracks (~ 2 cm in length and ~2 mm in relief) among the larger Chirotherium tracks (Figure 5.3). Rain drop impressions and other small features in the rock surface are clearly visible in the 3D digital model (Figure 5.3). The Chirotherium trackway was mounted in a case behind glass. By ensuring correct lighting to minimise reflections, the glass did not appear in the final point cloud. The small section of scale bar present within the point cloud can be accurately measured to within 1 mm. The generation of a mesh (Appendix 3) blurs the boundaries between centimeter markings on the scale bar, however, making measurements more difficult after post-processing.
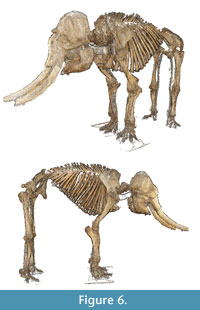 Two point clouds were produced of the mounted Asian elephant skeleton, one using 44 photographs (Appendix 4) and a second from 207 photographs (Figure 6. Appendix 5). The larger model (207 photos) consists of over six times as many points after removal of extraneous points (background walls and 'floating' points). The quality of the model does improve with an increased number of photographs, particularly around the jaw (Figure 7) and feet, where additional close-up photographs were taken. However, this increase in quality is relatively small, given that individual bones can be observed in both point clouds, including individual phalanges in the feet.
 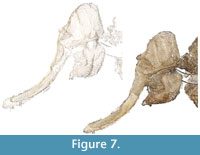 Both models have missing details from the dorsal surface of the specimen's back, though this is a consequence of the height of the mounted skeleton (and comparative height of the photographer) rather than a limitation of the method, and would equally apply to other digitisation techniques such as laser scanning. It should be noted that the relatively small increase in point cloud quality between models made from 44 and 207 photographs came at the expense of computational resources. Whilst the smaller model was produced on a standard desktop PC in ~1 hour, the larger model required over 22 Gb of RAM and took over 12 hours on an 8-core workstation.
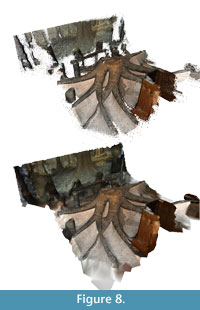 The fossil tree root system was the largest specimen digitised using the method presented here. It was also the specimen for which the least number of photographs were taken (24, see Table 1). Given that the specimen is in a fixed position against a wall within the Manchester Museum, photographs could not be taken from a full 360° arc. Nevertheless, the final point cloud captured the visible morphology of the tree, including complex areas in which roots intersect (Figure 8, Appendix 6). Fine detail such as surface texture is not visible in the model, as all photographs were taken from some distance to capture the whole structure.
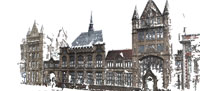
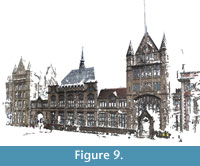 To further illustrate the utility of the method presented here, the front of the Manchester Museum itself was also imaged, and a 3D digital model was produced (Figure 9, Appendix 7). The model was produced from 52 images, however, the presence of a major road directly in front of the building meant that photographing the building from multiple angles was made difficult. Nevertheless, the final point cloud consisted of 1,071,961 points and recorded the overall geometry of the building.
Comparison with a Digital Model Produced with a Laser Scanner
In order to demonstrate the accuracy/resolution of the photogrammetric method outlined here, models were generated of a cast bird track (CU-MWC224.4; see Falkingham et al., [2009] for previous application of a laser scan of this specimen, and Lockley et al. [2004] for original description) using both the photogrammetric method and a laser scanner. The laser scanner was a NextEngine 3D Scanner HD and was used to generate a model of the track at a resolution of 5,500 points per square inch (~852 points cm-2) - a resolution of approximately 0.3 mm. Note that this is not the maximum resolution of the scanner, but was used in order to provide a scan of known dimension and resolution for comparison while maintaining a reasonable file size and scan time. Scans were produced from three angles in order to avoid occlusion and then aligned in the NextEngine software. 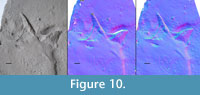 The photogrammetric model was produced from 75 photographs of the whole cast and then cropped to the same size as the area scanned. The merged laser scans produced a model consisting of 96,832 vertices, and the same area in the photogrammetric model consisted of 1,390,894 vertices. The photogrammetric model achieved a considerably higher density point cloud than the 0.3 mm laser scans, recording the subtle surface texture of the specimen (Figure 10).
DISCUSSION
The digitisation method presented in this paper requires only basic equipment (consumer digital camera and a personal computer) in conjunction with freely available open source software to acquire accurate and high resolution 3D digital models. These basic requirements mean that this method of producing digital models of specimens (or outcrops) is extremely cost effective compared to most laser scanning or photogrammetric options, which require expensive proprietary hardware and/or software. In addition, the inclusion of shell scripts with the software means that use requires little training or expertise on behalf of the operator once the software has been correctly set up; there is no manual alignment via point picking required by the user, unlike with laser scanning or other photogrammetric methods. The 3D digital model of the mounted elephant skeleton (Figure 7, Appendix 4–5) is of a higher resolution than the mounted skeletons digitised by laser scanning by Bates et al. (Bates et al., 2009b, 2009d), but was achieved for a fraction of the cost, and in a much shorter timescale.
The lack of complex scanning equipment makes this method of 3D digital acquisition immensely portable, requiring only a pocket-sized camera. Importantly, the software requires little in the way of specific markers or features within the photographs, meaning that 3D models can retroactively be produced of previously visited sites or specimens from collections of digital photographs (providing enough photographs were taken).
The method is also applicable within relatively short time frames. Within only a couple of hours, a specimen or site can be photographed and those images processed to produce a high quality model. In order to produce higher resolution point clouds, more computational resources are required, however, the lack of necessary user interaction means that processing can be accomplished over-night for larger models, providing computational facilities such as a workstation or cluster are available. In cases where such computational resources are not available, the user may wish to make a low resolution model from a limited number of photographs (<30), then produce high resolution models of areas of interest from additional photographs, and finally merge the two point clouds (after scaling). This technique has previously been applied to laser scan recordings of large track sites, in which detailed scans are required of tracks, but low resolution models of the whole site must be used to enable handling of the data (Bates et al., 2008a, 2008b). The nature of the work requiring a digital specimen will ultimately determine the density of point cloud required and consequently the number of photographs to be taken.
As shown by the Chirotherium model, specimens behind glass are not a problem for the method presented here, providing reflections can be minimised (the use of a flash is not applicable for specimens behind glass). This is another advantage over some forms of laser scanning, which can produce severe aberrations if the laser reflects off glass. The production of digital models from subjects ranging in size from a centimetre scale trilobite to the front of the Manchester Museum building acts as evidence for the applicability of the method to palaeontological specimens of all sizes, including rock outcrops and excavation sites. The somewhat inconvenient presence of a major road made taking photographs from all angles of the Manchester museum difficult, whilst the lack of a dedicated macro lens proved to be the limiting factor for the trilobite.
Making a Good Model
As illustrated by the elephant models produced from 44 (Figure 7, Appendix 4) and 207 (Figure 6, Figure 7, Appendix 5) photographs, increasing the number of images will result in a higher resolution point cloud and consequently higher fidelity 3D digital model. However, as noted above, this increase in fidelity comes at the cost of computational resources and may push the method from the desktop into the realms of specialist workstations or computer clusters (at least with current hardware). Because the processing stage is carried out after taking the photographs, the best option is to take as many photographs as possible at the time, and then if computational resources are a limiting factor, manually select the best 30-40 for producing a digital model.
The camera used to acquire images for the models generated in this paper was an 8 megapixel digital SLR, however, additional tests showed that an 8 megapixel digital compact camera produced models of comparable quality (similar density point clouds). Images beyond ~10 megapixels will provide little benefit, while serving to substantially increase processing time. Production of denser point clouds, and the capture of more complex detail, should be achieved through more photographs taken closer to the object, rather than simply using higher resolution images.
Limitations of the Method
As is the case for other digitisation techniques such as laser scanning, difficulties arise from attempting to produce models of specimens or outcrops in complex surroundings. In cases where the background is complex in both colour and topology, and when the background appears in many photographs (for instance, when photographing a mounted skeleton in a museum), the software can produce models where a large portion of the point cloud represents extraneous and unwanted parts. While these parts of the resulting point cloud can be subsequently removed during post-processing, their inclusion does increase both processing and post-processing time. In the case of small specimens, this difficulty is easily remedied by placing the object against a plain background, for instance white or black paper. Larger specimens or outcrops will benefit from ensuring the depth of field of the photograph is focused on the specimen, as blurred backgrounds will result in fewer keypoints located away from the specimen. Tracks, or specimens mounted against a wall or floor, provide the best subjects for the method as there is no 'background' to be incorporated into the processing phase.
Unlike laser scanning, which directly measures the xyz coordinate of each point, the method presented here relies on colour differences between images to locate matching keypoints and produce points. As such, areas of solid colour will not result in points within the point cloud. Whilst this is advantageous for removing unwanted areas (as noted above), it can cause difficulties for objects such as scale bars (Figure 4, Appendix 1). However, because solid colour will only occur on flat surfaces (uneven surfaces will produce variation in colour due to lighting), no information is lost. Depending on the software used for post-processing, the user will be able to either fill the hole with additional points, or employ a meshing algorithm that produces a flat surface between the points at the edge of an area of solid colour.
Because the method is scale-less, it can be equally applied to objects of all sizes, providing one of the greatest strengths of the method. However, this lack of scale means that care must be taken to either include an object of known dimension in the images (e.g., a scale bar), or measure part of the object, so that once the 3D model is produced, it can be scaled to the correct size. Whilst models can be produced of inaccessible specimens then, measurements cannot be taken from those models, and in these cases laser scanning is advantageous.
Future Possibilities
It is hoped that the method outlined in this paper will enable all researchers from any discipline access to digitisation of specimens, free from the costs and expertise required by previous laser scanning or photogrammetric techniques. The method is potentially applicable to collections of photographs taken in the past, allowing researchers retroactive access to digital data, with the potential of producing exciting 3D models of specimens, which no longer exist. With 3D models already becoming more commonplace within palaeontology and other sciences, it will only be a small step to full 3D models being commonly distributed between researchers via the internet, much as digital images are today. Production of the highest resolution models pushes the limits of today's desktop computers, but within only a few years extremely high resolution models will be easily generated on even mid-range office PCs, either through the use of more powerful CPUs, or by the adaptation of the code to run on consumer GPUs.
The advances in computational resources are not limited to the desktop however. The increasing number of smartphones possessing a high resolution camera, 1 Ghz + processors, and gigabytes of RAM, combined with the development platforms of modern phone operating systems, means that in the immediate future we may begin to see this technology appearing in common handheld devices, and with that, palaeontologists heading into the museum or the field, recording a specimen in 3D and then emailing it to colleagues anywhere in the world, all within a matter of minutes.
CONCLUSION
This paper has detailed the process of producing accurate, high resolution, 3D digital models using photographs taken using a consumer camera and freely available open source software. Digitisation of palaeontological resources represents an exciting advance for the science, and it is hoped that the adoption of this method will greatly facilitate research, allowing workers in all areas access to technology that has previously remained prohibitively complicated and expensive. As well as enabling researchers to produce their own 3D models, the widespread adoption of 3D digitisation will significantly aid in facilitating collaboration through the sharing and dissemination of digital data.
ACKNOWLEDGEMENTS
I wish to thank K. Bates (University of Liverpool, UK) for reading and commenting upon an early draft of the manuscript, and also D. Gelsthorpe (Manchester Museum, UK) for access to specimens and the willingness for those specimens to be digitised and distributed with this paper. I also wish to thank R. Savage and R. Crompton (University of Liverpool, UK) for access to the laser scanner. Finally, I thank two anonymous reviewers for useful comments and suggestions on the manuscript.
REFERENCES
Adams, T., Strganac, C., Polcyn, M.J., and Jacobs, L.L. 2010. High resolution three-dimensional laser-scanning of the type specimen of Eubrontes (?) glenrosensis Shuler, 1935, from the Comanchean (Lower Cretaceous) of Texas: implications for digital archiving and preservation. Palaeontologia Electronica,13.3.1T, palaeo-electronica.org/2010_3/226/index.html.
Bates, K.T., Manning, P.L., Hodgetts, D., and Sellers, W.I. 2009d. Estimating body mass properties of dinosaurs using laser imaging and 3D computer modelling. PLoS ONE 4(2): e4532. doi:10.1371/journal.pone.0004532
Bates, K.T., Manning, P.L., Vila, B., and Hodgetts, D. 2008a. Three dimensional modelling and analysis of dinosaur trackways. Palaeontology, 51:999.
Bates, K.T., Breithaupt B.H., Falkingham, P.L., Matthews Neffra, A., Hodgetts, D., and Manning, P.L. 2009a. Integrated LiDAR & photogrammetric documentation of the Red Gulch Dinosaur Tracksite (Wyoming, USA). In Foss, S.E., Cavin, J.L., Brown, T., Kirkland, J.I., and Santucci, V.L. (eds.), Proceedings of the Eighth Conference on Fossil Resources, Utah, pp. 101-103.
Bates, K.T., Falkingham, P.L., Breithaupt, B.H., Hodgetts, D., Sellers, W.I., and Manning, P.L. 2009b. How big was 'Big Al'? Quantifying the effect of soft tissue and osteological unknowns on mass predictions for Allosaurus (Dinosauria: Theropoda). Palaeontologia Electronica,12.3.14A, palaeo-electronica.org/2009_3/186/index.html.
Bates, K.T., Falkingham, P.L., Rarity, F., Hodgetts, D., Purslow, A., and Manning, P.L. 2010. Application of high-resolution laser scanning and photogrammetric techniques to data acquisition, analysis and interpretation in palaeontology. International Archives of the Photogrammetry, Remote Sensing, and Spatial Information Sciences, XXXVIII, Part 5:68-73.
Bates, K.T., Rarity, F., Manning, P.L., Hodgetts, D., Vila, B., Oms, O., Galobart, À., and Gawthorpe, R. 2008b. High-resolution LiDAR and photogrammetric survey of the Fumanya dinosaur tracksites (Catalonia): Implications for the conservation and interpretation of geological heritage sites. Journal of the Geological Society, London, 165:115-127.
Bates, K.T., Falkingham, P.L., Hodgetts, D., Farlow, J.O., Breithaupt B.H., O'Brien, M., Matthews Neffra, A., Sellers, W.I., and Manning, P.L. 2009c. Digital imaging and public engagement in palaeontology. Geology Today, 25:134-139.
Belvedere, M., and Mietto, P. 2010. First evidence of stegosaurian Deltapodus footprints in North Africa (Iouaridène Formation, Upper Jurassic, Morocco). Palaeontology, 53:233-240.
Belvedere, M., Dyke, G., Hadri, M., and Ishigaki, S. 2011b. The oldest evidence for birds in Northern Gondwana? Small tridactyl footprints from the Middle Jurassic of Msemrir (Morocco). Gondwana Research, 19:542-549.
Belvedere, M., Baucon, A., Furin, S., Mietto, P., Felletti, F., and Muttoni, G. 2011a. The impact of the digital trend on ichnology: ICHNOBASE. Dinosaur Track Symposium Abstract Book, Obernkirchen, Germany.
Breithaupt, B.H., and Matthews, N.A. 2001. Preserving paleontological resourcs using photogrammetry and geographic information systems. In Harmon, D. (ed.), Crossing Boundaries in Park Management: Proceedings of the 11th Conference on Research and Resource Management in Parks and Public Lands. The George Wright Society, Inc.
Breithaupt, B.H., Matthews, N., and Noble, T. 2004. An Integrated Approach to Three-Dimensional Data Collection at Dinosaur Tracksites in the Rocky Mountain West. Ichnos, 11:11-26.
Breithaupt, B.H., Southwell, E.H., Adams, T., and Matthews, N.A. 2001. Innovative Documentation Methodologies in the Study of the Most Extensive Dinosaur Tracksite in Wyoming. 6th Fossil Research Conference Proceedings Volume:113-122.
Chapman, R.E., Andersen, A., and Jabo, S.J. 1999. Construction of the virtual Triceratops: procedures, results and potentials. Journal of Vertebrate Paleontology, 19(Supplement to No. 3):37A.
Falkingham, P.L., Margetts, L., Smith, I.M., and Manning, P.L. 2009. Reinterpretation of palmate and semi-palmate (webbed) fossil tracks; insights from finite element modelling. Palaeogeography, Palaeoclimatology, Palaeoecology, 271:69-76.
Farlow, J.O., O'Brien, M., Kuban, G.J., Dattilo, B.F., Pinuela, L., Bates, K.T., Falkingham, P.L., Rose, A., Freels, A., Kumagai, C.J., Libben, C., Smith, J., and Whitcraft, J. 2010. Dinosaur tracksites of the Paluxy River (Glen Rose Formation, Lower Cretaceous), Dinosaur Valley State Park, Somervell County, Texas, USA. 5th Jornadas Internacionales sobre Paleontology; a de Dinosaurios y su Entorno, Salas de los Infantes, Burgos, Spain, pp. 15-16.
Furukawa, Y., and Ponce, J. 2010. Accurate, Dense, and Robust Multi-View Stereopsis. IEEE Trans. on Pattern Analysis and Machine Intelligence, 32:1362-1376.
Furukawa, Y., Curless, B., Seitz, S.M., and Szeliski, R. 2010. Towards Internet-scale Multi-view Stereo. CVPR.
Gatesy, S.M., Bäker, M., and Hutchinson, J.R. 2009. Constraint-Based exclusion of limb poses for reconstructing theropod dinosaur locomotion. Journal of Vertebrate Paleontology, 29:535-544.
Gunga, H.-C., Suthau, T., Bellmann, A., Stoinski, S., Friedrich, A., Trippel, T., Kirsch, K., and Hellwich, O. 2008. A new body mass estimation of Brachiosaurus brancai Janensch, 1914 mounted and exhibited at the Museum of Natural History (Berlin, Germany). Fossil Record, 11:33-38.
Hutchinson, J.R., Anderson, F.C., Blemker, S.S., and Delp, S.L. 2005. Analysis of hindlimb muscle moment arms in Tyrannosaurus rex using a three-dimensional musculoskeletal computer model: implications for stance, gait, and speed. Paleobiology, 31:676-701.
Lockley, M.G., Nadon, G., and Currie, P.J. 2004. A diverse dinosaur-bird footprint assemblage from the Lance Formation, Upper Cretaceous, Eastern Wyoming: implications for ichnotaxonomy. Ichnos,11:229-249.
Mallison, H. 2010a. CAD assessment of the posture and range of motion of Kentrosaurus aethiopicusHennig, 1915. Swiss Journal of Geosciences, 103:211-233.
Mallison, H. 2010b. The digital Plateosaurus II: An assessment of the range of motion of the limbs and vertebral column and of previous reconstructions using a digital skeletal mount. Acta Palaeontologica Polonica, 55:433-458.
Marty, D. 2008. Sedimentology, taphonomy, and ichnology of Late Jurassic dinosaur tracks from the Jura carbonate platform (Chevenez-Combe Ronde tracksite, NW Switzerland): insights into the tidal flat palaeoenvironment and dinosaur diversity, locomotion, and palaeoecology. GeoFocus, 21:278.
Matthews, N.A., Noble, T.A., and Breithaupt, B.H. 2006. The application of photogrammetry, remote sensing and geographic information systems (GIS) to fossil resource management. Bulletin New Mexico Museum of Natural History and Science, 34:119-131.
Matthews, N.A., Breithaupt, B.H., Noble, T., Titus, A., and Smith, J. 2005. A geospatial look at the morphological variation of tracks at the Twentymile Wash dinosaur tracksite, Grand Staircase-Escalante National Monument, Utah. Journal of Vertebrate Paleontology, 25(Supplement to No. 3):90A.
Rybczynski, N., Tirabasso, A., Bloskie, P., Cuthbertson, R., and Holliday, C. 2008. A three-dimensional animation model of Edmontosaurus (Hadrosauridae) for testing chewing hypotheses. Palaeontologia Electronica,11.2.9A, palaeo-electronica.org/2008_2/132/index.html.
Sellers, W.I., Manning, P.L., Lyson, T., Stevens, K., and Margetts, L. 2009. Virtual palaeontology: gait reconstruction of extinct vertebrates using high performance computing. Palaeontologia Electronica,12.3.13A, palaeo-electronica.org/2009_3/180/index.html.
Smith, N.E., and Strait, S.G. 2008. PaleoView3D: from Specimen to Online Digital Model. Palaeontologia Electronica,11.2.11A, palaeo-electronica.org/2008_2/134/index.html.
Snavely, N., Seitz, S.M., and Szeliski, R. 2006. Photo Tourism: Exploring image collections in 3D. ACM Transactions on Graphics (Proceedings of SIGGRAPH 2006).
Snavely, N., Seitz, S.M., and Szeliski, R. 2007. Modeling the world from internet photo collections. International Journal of Computer Vision.
