RESULTS
Comparison by Group Membership
 Geographic range reconstructions for species representative of each taxon group are illustrated in
Figure 4. Visual comparison of the 95% confidence intervals of the mean geographic range of the four taxon groups delineated above suggests significant differentiation of geographic range size within these groups. Congruent results were obtained regardless of coding strategy or standardization procedure (Figure 5.7,
Appendix 5). A series of hypotheses related to how taxonomic groups responded to the invasive regime were assessed using one-tailed t-tests (Table 5,
Appendices 3, 6, 8).
Geographic range reconstructions for species representative of each taxon group are illustrated in
Figure 4. Visual comparison of the 95% confidence intervals of the mean geographic range of the four taxon groups delineated above suggests significant differentiation of geographic range size within these groups. Congruent results were obtained regardless of coding strategy or standardization procedure (Figure 5.7,
Appendix 5). A series of hypotheses related to how taxonomic groups responded to the invasive regime were assessed using one-tailed t-tests (Table 5,
Appendices 3, 6, 8).
Results indicate that among native Cincinnatian taxa, species or genera that cross over into the Richmondian had statistically larger geographic ranges than those that do not (Table 5.1).
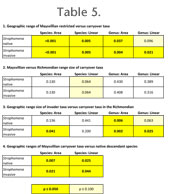 Species area, species linear, and generic area analyses are highly significant under both coding strategies. The genus linear analysis is significant at the level of p = 0.096 when Strophomena is treated as native and p = 0.021 when Strophomena is treated as a Richmondian invader. For those native taxa that carry over into the Richmondian, geographic ranges are statistically identical at in all analyses (Table 5.2), indicating that the introduction of the invader taxa did not produce a significant range size shift in these taxa. The mean Richmondian range size of carryover taxa is larger than that of the invasive taxa. When Richmondian Strophomena species are coded as native descendants, this pattern is statistically significant only for the generic area analysis (Table 5.3); however, when Strophomena species are treated as invasive, ranges of invader taxa are significantly smaller in all analyses except the species linear analysis. Finally, the geographic ranges of new species that evolve in the Richmondian from Cincinnatian ancestors are significantly smaller than the ranges of carryover taxa in the Richmondian in all analyses (Table 5.4).
Comparison by Sequence
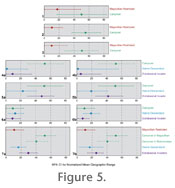
 A second way to assess the biogeographic impact of the Richmondian Invasion is to examine patterns temporally. Species ranges illustrated in
Figure 4 are representative of patterns for each time slice. Geographic range size for species groups within each depositional sequence were assessed through Analysis of Variance (ANOVA) tests. Results are similar regardless of normalization procedure or whether Richmondian occurrences of Strophomena were coded as native or invasive in origin (Figure 5,
Table 6,
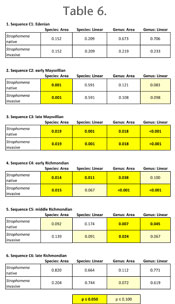
Appendices 4, 5, 7, 9). Differences in statistical significance between tests using the different coding strategies are relatively minor and are restricted to the C4 and C5 sequences (Table 6).
A second way to assess the biogeographic impact of the Richmondian Invasion is to examine patterns temporally. Species ranges illustrated in
Figure 4 are representative of patterns for each time slice. Geographic range size for species groups within each depositional sequence were assessed through Analysis of Variance (ANOVA) tests. Results are similar regardless of normalization procedure or whether Richmondian occurrences of Strophomena were coded as native or invasive in origin (Figure 5,
Table 6,
Appendices 4, 5, 7, 9). Differences in statistical significance between tests using the different coding strategies are relatively minor and are restricted to the C4 and C5 sequences (Table 6).
In the C1 sequence, there is no statistical difference between geographic ranges of taxa which will ultimately survive into the Richmondian and those that become extinct by the end of the Maysvillian (Figure 5.1,
Table 6.1). In the C2 sequence, Maysvillian restricted taxa occupy smaller geographic ranges than carryover taxa, although this is statistically significant in only half of the analyses of the species area method (Figure 5.2,
Table 6.2). In the C3 sequence, Maysvillian restricted taxa occupy geographic ranges that are statistically smaller than carryover taxa in all analyses (Figure 5.3,
Table 6.3).
The C4 sequence includes the earliest evidence of extrabasinal invaders and represents the initial phases of the invasion and establishment of invasion ecology. In this sequence, invader taxa occupy restricted geographic ranges with respect to the carryover taxa (Figure 5.4). When Strophomena species are coded as native descendants, new speciation is limited to three species (Table 1,
Table 3), but these species are narrowly distributed (Figure 5.4). If Strophomena species are coded as invasive, then only one native descendant species, Platystrophia clarksvillensis, occurs in the sequence, which renders analysis of that taxon group spurious. Even so, differences between carryover, native descendant, and invasive species are statistically significant or nearly so in all analyses (Table 6.4).
In the C5 sequence, the most broadly distributed taxa are still the carryover taxa, but invaders exhibit larger ranges than they did in the C4 sequence (Figure 5.5). Newly evolved species, however, continue to occupy restricted ranges (Figure 5.5). Whereas statistical differences between the three classes remain at the genus level, the overlap between carryover and invader taxa at the species level renders these groups biogeographically indistinguishable (Table 6.5). By the late Richmondian C6 sequence, all class size differentiation has broken down and differences are no longer statistically significant in any analysis (Figure 5.6,
Table 6.6).