Issue
Table of Contents

Marine biogeography controls:
BROOKS &
CERVATO

Plain-Language &
Multilingual  Abstracts

Abstract

Introduction

Methods

Results

Discussion

References

Appendix


Print article


RESULTS

Biodiversity measures reported in the main paper are given at the species level, which is where the effects of ecosystem factors would be most apparent. Genus level diversity measures are very comparable, generally with correlation coefficients similar to within 0.1 or less. Complete tables of genus level diversity measures appear in Appendix Table 6. A time series of diversity measures that compare passive and convergent tectonic settings is presented in Table 3 and Figure 2, with rarefied diversity shown in parentheses. Table 3 shows an alpha diversity peak in Europe in the Eocene, during a protracted period of collision between Africa and Europe that resulted in the orogeny of the Pyrenees (Burbank et al. 1992; Vergés et al. 2002). Japan, which experienced tectonism continuously throughout the past 50 m.y. (Hall 2002), and Table 3 shows an alpha diversity peak during the late Miocene. It should be noted that data from other tectonically active regions, such as the Indo-Australian Archipelago, are not reported in Table 3 because they were not well represented in this data set.

Consistently the most diverse region in complete and rarefied alpha diversity was eastern North America where marine fauna existed along a passive continental margin (Table 3 and Figure 3). The average alpha diversity per grid cell in eastern North American computed from complete occurrence lists was 87.8, ahead of Europe (α = 56.1) and Japan (α = 31.5). Although rarefied alpha diversity numbers between the three regions were more homogeneous, ranging from 9.5 to 13.6, eastern North America was still the most diverse overall and consistently the most diverse in six of ten sub-epoch. The beta diversity components indicate that the average eastern North American grid cell (β = 0.81) was more different from its neighbors, than was the case in Europe (β = 0.62) or Japan (β = 0.67).

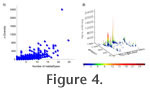
When all 1,565 globally distributed grid cells were considered, correlation tests between diversity measures indicated that the two most related factors were the diversity of k-means habitat types and alpha diversity (at species level: r = 0.763, at genus level: r = 0.857, see Figure 4 and Table 4). Rarefied subsetting slightly decreased these correlations, but generally by less than 0.1 (at species level: r = 0.679, at genus level: r = 0.762, Appendix Table 6). Because the diversity of habitat types represents a clustering of multiple parameters, correlations to the constituent parameters were also tested. Insignificant correlations occurred between alpha diversity and all such parameters including water depth, percent sand, silt, clay, and lime mud (see Table 4). The beta diversity component showed no correlation to other parameters, except a possibly significant correlation to connectivity (r = 0.632), which represents the spatial (not ecological) connectivity of grid cells.

The robustness of the habitat type–alpha diversity correlation was tested against two null models. The first null model was used to decipher our method of clustering from random chance by assuming that habitat type correlations could be the result of analytical chance introduced by our clustering algorithm. We performed 100 random seed cluster trials, each of which started with a different collection of k seed centroids. The data were then analyzed as described above and correlated. The species level correlations from the 100 random trials were quite similar, ranging from r = 0.733 to 0.745. The total range of correlations across all 100 trials varied by less than 2% (0.012), with a standard deviation of 0.004. The 2% range in correlation values is small enough to reject this null hypothesis and to affirm that our k-means cluster assignment protocol is rather insensitive to variation in starting seed values.

The second null model assumed the diversity of any grid cell was merely the result of source pool effects, meaning that the alpha diversity of a grid cell should be related to the diversity of its source pool (neighborhood). We measured source pool diversity for each grid cell and tested the correlation between alpha diversity and source pool diversity. The correlation was weak (r = 0.341), and indicates that the diversity of the average grid cell was independent of its surrounding neighborhood. Therefore, the habitat(s) of each grid cell was not necessarily bound by trends of the neighborhood at this grid cell resolution which suggests that a grid cell can respond to environmental forcing independent of its source pool.


Next Section

Marine biogeography controls
Plain-Language & Multilingual  Abstracts | Abstract | Introduction | Methods
Results | Discussion | References | Appendix
Print article